How Depolymerization-Based Plasticization Affects the Process of Cold Crystallization in Poly(P-Dioxanone)
Abstract
The self-plasticization, i.e., the increase in the polymer chains' mobility by including its monomer, has a major impact on a polymer's structural, thermal, and mechanical properties. In this study, differential scanning calorimetry (DSC), optical and Raman microscopies, thermo-mechanical analysis (TMA), size exclusion chromatography equipped with a multi-angle light scattering detector (SEC-MALS), and X-ray diffraction analysis (XRD) are used to investigate the effect of thermally induced self-plasticization of poly-(p-dioxanone), PDX, on the crystal growths from the amorphous and molten states. Significant changes in the crystallization behavior and mechanical properties of PDX are found only for samples self-plasticized at the depolymerization temperature (Td) above 150 °C. The intense self-plasticization leads to the decrease of the crystallization temperature, increase of the crystal growth rapidity, disappearance of the distinct α→α’ polymorphic transition, reduction of the overall melting temperature, and segregation of the redundant monomer. Although the morphology of the crystalline phase has a major impact on the mechanical properties of PDX, the self-plasticization itself does not seem to result in any major changes in the magnitude, localization, or morphology of formed crystallites (these are primarily driven by the temperature of crystal growth). The manifestation of the variable activation energy concept is discussed for the present crystallization data.
1 Introduction
For polymers, plasticization refers to the process of incorporating a plasticizing molecule into the polymer matrix to improve its flexibility, processability, and other desired properties. Plasticizers are low molecular weight substances that can interact with polymer chains through various mechanisms, leading to changes in the physical and mechanical properties of the polymer.[1-3] The addition of plasticizers to polymers can enhance the mobility of polymer chains, reducing intermolecular forces (e.g., hydrogen bonding or van der Waals interactions) and increasing chain flexibility. As a consequence, the plasticizers also lower the glass transition temperature (Tg) of the polymer.[2, 4-8] In addition to improving the flexibility, plasticizers can also increase the elongation at break, impact resistance, and toughness of the polymer and reduce the viscosity of the polymer melt.[9-14] The choice of plasticizer and its compatibility with the polymer matrix is crucial for achieving the desired plasticization effects. Different plasticizers have different molecular structures and interactions with polymers, resulting in varying degrees of plasticization. Factors such as molecular weight, polarity, solubility, and concentration of the plasticizer can influence its effectiveness in plasticizing the polymer.[15]
It is important to note that plasticization can also have negative effects on the properties of polymers, such as decreasing mechanical strength, dimensional stability, and resistance to environmental factors (i.e., heat and chemicals).[14, 16-21] This is particularly relevant and crucial to comprehend in case of the (unintended) thermally induced depolymerization proceeding via the end-chain scission mechanism[22-26] (as opposed to the random chain scission), where the resulting self-plasticization by a released monomer.[27-29] can be unpredictably and unexpectedly introduced into the polymer matrix. One of the recently studied polymers that exhibit dominant end-chain scission depolymerization and are regularly processed at temperatures close to its ceiling temperature is polydioxanone (PDX) PDX is a biodegradable poly(ester-ether) prepared by ring-opening polymerization of p-dioxanone[30−32] and utilized in numerous medical applications.[33-40] Since PDX is mainly utilized for the manufacturing of surgical sutures, stents, and various implants, its high-temperature processing via hot-melt extrusion or injection molding is readily applied, and the potential changes induced by partial depolymerization of the material become relevant.
In a recent study,[41] a series of depolymerized PDX samples was prepared to study the influence of the increasing amount of the released p-dioxanone monomer being incorporated into the polymer matrix (providing the plasticization effect) on the structural relaxation behavior of the bulk material. The study has demonstrated that the increasing intensity of the temperature-induced self-plasticization leads to a large decrease in Tg (by ≈40 °C), non-monotonous evolution of the relaxation activation energy (decrease from ≈450 to 200 kJ mol−1 followed by an increase to ≈310 kJ mol−1), increase of the broadness of the relaxation times distribution (corresponding to the increased structural variety of the relaxation entities/domains being employed in the relaxation motions), and increased cooperativity of the relaxing domains. The present study introduces affiliated research focused on the influence of self-plasticization on the formation of the crystalline phase in PDX. The study will be focused on the real-life consequences of the high-temperature PDX processing. Since PDX is a semi-crystalline polymer with a degree of crystallinity between 45% and 55%,[42] the rapidity and intensity of the crystal growth from the amorphous phase can significantly affect the resulting mechanical properties of the semi-crystalline material.
2 Results and Discussion
This section will be split into several parts. The first sub-section will contain the main data series on plasticization and plasticization-influenced non-isothermal crystallization. In the second sub-section, the supplementary differential scanning calorimetry (DSC) measurements will be shown, focusing on the identification of different crystalline phases formed in PDX during the isothermal annealing at different temperatures. The third sub-section will introduce the results by additional experimental techniques (optical microscopy, Raman spectroscopy, thermomechanical analysis (TMA), size exclusion chromatography equipped with a multi-angle light scattering detector (SEC-MALS), and X-ray diffraction (XRD)) obtained for differently crystallized and plasticized samples. The fourth and fifth sub-sections will deal with plasticization-influenced crystallization kinetics modeling for the samples crystallized from the glassy state.
2.1 Plasticization and Plasticization-Influenced Crystallization
The preparation of the PDX samples plasticized to a different extent was already described in detail in the reference.[41] Thus, only a significantly shortened version of this description will be presented here. Examples of the DSC curves obtained during the cyclic plasticization treatment are shown in Figure 1.
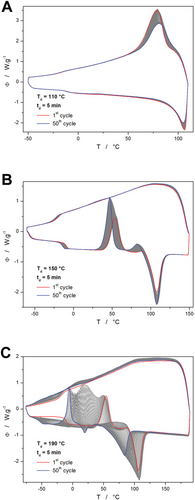
The most typical behavior is depicted in Figure 1B (50 annealing cycles at 150 °C, 5 min duration of each annealing), where the glass transition shifts to the slightly lower temperature (by ≈5 °C), and the exothermic crystallization peak shifts to lower temperature by ≈7 °C (the crystallization also proceeds to a larger extent, as evidenced by a larger peak area, which corresponds to the crystallization enthalpy). Moreover, an exothermic peak (corresponding to the α'→α polymorphic transition, as will be discussed in detail in Section 2.2) closely preceding melting significantly increases in proportion and shifts by ≈7 °C to lower temperature. The least apparent is then the shift of the melting peak (by ≈2.5 °C), which, however, exhibits a large increase in the associated enthalpy change. This type of behavior was observed for the following combinations of depolymerization temperature (Td) and number of cycles: 130 °C and 50 cycles, 150 °C and 50 cycles, 170 °C and 50 cycles, 190 °C and 20 cycles, and 190 °C and 10 cycles.
The second case of typologically distinct behavior is depicted in Figure 1A. In the case of the 5 min annealing at 110 °C, the sample barely melted, and an increasingly larger portion of the material remained either in a macroscopic solid form or at least significantly nucleated. This is indicated by the increased rapidity of the crystallization proceeding at the beginning of the cooling steps. This behavior was specific only for the annealing temperature (Ta) of 110 °C. Note that before any further testing, this sample was fully melted for 2 min at 130 °C and then rapidly cooled down to obtain a fully amorphous material.
The third archetypal response to the plasticization cycles is depicted in Figure 1C. As this figure represents the most intense temperature-induced plasticization (50 × 5 min at Ta = 190 °C) performed within the framework of the present study, the decrease in the characteristic temperatures is quite large: Tg decreased by ≈43 °C, crystallization temperature (Tc, defined as the maximum of the crystallization peak) decreased by ≈60 °C, and the melting temperature (Tm, defined as the extrapolated onset of the melting peak) decreased by ≈34 °C. Whereas the glass transition and melting effects become broader with plasticization, the crystallization is more rapid, with a narrower peak. In addition, a new minor melting peak occurs with the extrapolated onset at ≈15 °C, which corresponds to the melting of the crystalline solid monomer p-dioxanone. Lastly, a non-monotonous evolution of the exothermic α“→α transition peak (preceding the melting process) occurs. First signs of this (third) archetypal DSC response occurred at 30 cycles and Ta = 190 °C, thus it can be attributed to the following plasticized PDX samples: 190 °C and 50 cycles, 190 °C and 40 cycles, 190 °C and 30 cycles. In these cases, the exothermic α”→α peak first increases in magnitude and decreases in temperature with an increasing number of plasticization cycles, but after ca. 25 plasticization cycles, the magnitude of this crystallization peak starts to decrease, and at 50 cycles it is almost indistinguishable.
To determine the crystallization kinetics for the differently plasticized samples, several series of simple heating scans were performed at different heating rate q+—as depicted in Figures 2 and 3. Regardless of the degree of plasticization, the crystallization process appears to exhibit a remarkably consistent behavior concerning applied q+ (the shape, asymmetry, and reproducibility of the crystallization peaks remain unchanged). Moreover, the same is valid for the melting peaks, which reflect on the quality (composition, morphology, size of crystalline domains) of the formed crystallites. This confirms that both the plasticizing monomer, as well as the formed crystalline phase, are distributed homogeneously throughout the volume of the PDX material (in the opposite case, irregularities arising from preferential nucleation/crystal growth initiated by the energy surplus at high q+ would occur on the DSC curves). Note that Figure 2 depicts only several selected examples of the series of the DSC crystallization measurements.
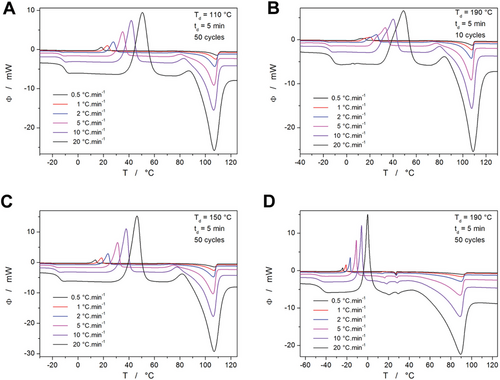
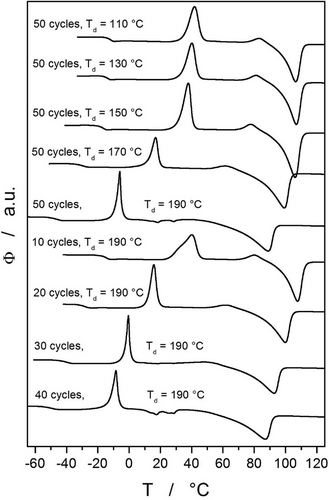
All conformable graphs (as corresponds to the comparison shown in Figure 3 for all curves measured at 10 °C min−1) are included in Figures S1–S9 (Supporting Information); the Supporting Information (see Tables S1–S9, Supporting Information) also contains the list of Tg, Tc1 (temperature corresponding to the maximum of the main crystallization peak), ΔHc1 (crystallization enthalpy of the main crystallization peak), Tc2 (temperature corresponding to the maximum of the α“→α transition peak), ΔHc2 (crystallization enthalpy of the α”→α transition peak), Tm (temperature corresponding to the extrapolated onset of the melting peak), ΔHm (enthalpy of melting). Based on these data, the crystallization kinetics will be modeled in Sections 2.4 and 2.5. However, before introducing the kinetic calculations, the nature of certain minor effects identified on the DSC curves shown in Figures 2 and 3 will be discussed in detail in the following text.
2.2 Detailed Insight into the Temperature-Resolved Formation of the Crystalline Phase
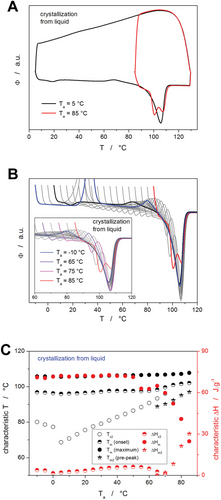
To better understand the formation of the crystalline phase in the PDX material, two additional series of cyclic crystallization↔amorphization measurements were performed for the as-purchased suture. In the first series, the fully amorphous material was heated from −40 °C to a selected Ta (differing from −10 to 85 °C with a step of 5 °C) at 50 °C min−1, where the sample was crystallized (example of the corresponding temperature program is shown in Experimental Section.). The crystallized sample was then heated through the melting region to assess the presence of the α'→α transition peak (closely preceding the melting peak), Tm, melting enthalpy ΔHm, etc. These measurements are shown in Figure 4, where graph A depicts two example cycles with Ta = 5 and 85 °C, respectively.
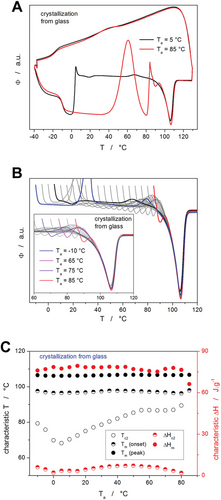
Whereas for Ta = 5 °C, the sample was fully crystallized at Ta, and only the α'→α transition peak occurred on the black curve, for high Ta (>50 °C), most of the crystallization proceeded non-isothermally as even q+ = 50 °C min−1 was not sufficient to avoid the crystal growth before reaching Ta. Contrary to the signals observed during the standard non-isothermal crystallization measurements (Figures 2 and 3), each isothermal crystallization step depicted in Figure 4A is followed by a small endothermal dip. These endotherms are attributed to the mobilization of the rigid amorphous phase (RAF), which represents the portion of the amorphous polymer matrix that is constrained by the neighboring crystalline phase.[43-45] In particular, RAF mobilization involves the process akin to the structural relaxation of the (main/mobile) amorphous phase, with the occasional associated process of partial fusion occurring at the RAF/crystal interface.[43-45]
A full set of the heating steps (depicting the melting signal of the crystallized material) is shown in Figure 4B. For Ta between −10 and 0 °C, practically no crystallization proceeded during the annealing period, and the sample was crystallized only during the heating step. At a higher Ta, the annealing time was sufficient to achieve equilibrium crystallinity during the annealing step. This is well reflected by the comparison of the heating scans obtained after annealing at Ta −10 and 5 °C, where the former exhibits the α“→α transition peak at a higher temperature (despite having lower Ta) because the main crystallization proceeded in this case in the 20–40 °C range. On the other hand, Ta = 5 °C was the lowest annealing temperature at which the samples could be crystallized isothermally, which resulted in the α”→α transition occurring at lowest T. Nonetheless, all monitored parameters were for the melting peaks depicted in Figure 4B very similar (as is documented by their quantification shown in Figure 4C), which indicates that during the cold crystallization, the exact temperature of crystallization practically only affects the onset of the α'→α transition (shifts to lower temperature with lower Ta). In addition, it is worth noting that the endotherm corresponding to the RAF mobilization indeed occurs exclusively after the significant portion of the amorphous matrix was crystallized isothermally (as opposed to non-isothermal crystallization depicted in Figures 2 and 3, and in Figure 4B for Ta = −10, −5, and 0 °C). This striking difference is probably caused by the difference in internal structural stress being built up within the two scenarios. During the isothermal crystal growth, the formation of the interface between the crystalline and amorphous phase is associated with stretching and bending of the adjacent or partially incorporated polymer chains and/or amorphous domains, where only the surplus energy supplied during the consequent temperature increase can newly equilibrate and relax/mobilize. On the other hand, during the non-isothermal crystallization, each incrementally growing crystalline phase/interface is accompanied by a continuous increase in temperature, which practically immediately equilibrates/relaxes the newly formed structural ordering. Hence, no large amount of internal stress can build up and lead to the pronounced RAF mobilization effect.
In the second series of cyclic crystallization↔amorphization measurements, the molten material (equilibrated at 130 °C) was cooled to a selected Ta (differing from −10 to 85 °C with a step of 5 °C) at 50 °C min−1, where the sample was crystallized. An example of the temperature program corresponding to the hot crystallization experiment is shown in Experimental Section). The crystallized sample was then, similarly to the first series of measurements, heated through the melting region, and the corresponding data were evaluated. Two cycles corresponding to the borderline crystallization/melting behavior are displayed in Figure 5A. Whereas the material crystallized at 5 °C provides a response identical to the first-series measurement performed at the corresponding Ta, the crystallization from melt at 85 °C leads to an occurrence of a complex melting peak. This indicates the formation of an additional distinct crystalline phase (high-temperature polymorph/stable phase) that exhibits a melting peak with lower Tm (by ≈10–15 °C). The existence of the melting double-peak is confirmed in Figure 5B, which depicts a full set of heating scans following the isothermal crystallization from the molten/liquid phase. The simultaneous occurrence of the RAF mobilization endotherm and the melting pre-peak testifies to the independent nature of these two processes.
Apart from the RAF mobilization endotherm being ceased at Ta ≥ 80 °C (which is a consequence of the naturally high mobility of the liquid phase at the crystal/liquid interface at such high temperatures), the occurrence of the double melting peak is practically the only significant change between the two crystal growth routes compared via Figures 4 and 5. Since the transitional regime for the self-nucleation occurs for PDX in the 105–115 °C temperature range,[46] it cannot be associated with the formation of the two melting peaks, because in the present case, the samples were always annealed at 130 °C to fully dissolve all crystalline phase before rapidly cooling to Ta. However, as was reported in the reference,[47] the melting pre-peak occurring at temperatures ≤ 100 °C can be associated with the competition between the two nucleation-growth regimes (rapid regime III with the growth rate maximum at 45 °C and slow regime II with the growth rate maximum at 60 °C), which manifest themselves through spherulites with different lamellar thicknesses. The microscopically measured growth rates[47] in the two regimes indicate that at slow cooling, the apparent balance between the two growth rates occurs near 65 °C. Considering that the present cooling to Ta is rapid (50 °C min−1), it is understandable that the slower nucleation within regime II leads to a significant amount of the corresponding spherulitic type being formed only at Ta ≥ 75 °C (as shown in Figure 5B). The crucial role of the nucleation process also confirms the absence of the melting pre-peak in the case of the isothermal crystallization from glass (Figure 4), where after the initial rapid cooling to −40 °C, the nucleation occurs dominantly only in regime III.
In addition to the above-described nucleation-growth regimes of the polymorphic α phase, the α’→α transition (where α’ represents a mesomorphic phase with loose chain packing) can be interpreted in agreement with results reported in the reference[48] for PDX and in the references[49, 50] for the polylactic acid (PLA), which exhibits practically identical but more thoroughly explored crystallization behavior. The crystallization of these polymers is temperature-dependent, exhibiting the formation of two distinct polymorphic phases. At lower temperatures, the mesomorphic α“-form crystalline phase with a less ordered structure is formed, in which the chain packing and conformation are loose.[48, 49] Contrariwise, at higher temperatures, the more densely packed α-phase with stronger interchain interactions and a larger “long” period is formed during the crystallization. The small exothermic peak closely preceding the melting then represents a polymorphic phase transition (possibly of a monotropic nature but alternatively as a true phase transition as evidenced by an isosbestic point in the XRD patterns), also denoted as α”→α or disorder→order transition.[48-50]
Whereas the presence of the α’→α peak indicates a significant amount of the disordered α’ crystalline phase being formed, the magnitude of the peak is mostly irrelevant due to its overlap with the adjacent melting, which masks the potential correlation between the magnitude of the α’→α peak and the amount of the α’ phase being formed. On the other hand, there is a strong correlation between the (true) temperature of crystallization Ta (or ≈25–35 °C for Tas < 5 °C) and the position of the small exothermic peak (α’→α transition). This suggests that the α’ phase is formed at different quality (possibly the packing density) at different Tas, which in turn influences the α’→α transition onset (low Ta ≈ looser packing of the α' phase ≈ earlier initiation of the α“→α transition). A similar qualitative explanation can also be associated with the nucleation into the α” phase, which should dominantly occur at lower temperatures. Furthermore, the attribution of the small exothermic peak to the α'→α transition has crucial consequences for the interpretation of the double-peak melting behavior. Since the main (higher-temperature) melting peak can be attributed to the fusion of the α phase formed by recrystallization, and the lower-temperature melting peak (occurring for hot crystallization from the melt at Ta > 65 °C) can be associated with the α crystals formed directly from the slightly undercooled melt, the large temperature difference of the two melting onsets has to be indeed (in agreement with the refs. [46, 47]) attributed solely to the morphological variation of the two α phases. This hypothesis (among others) will be explored in the following text.
2.3 Additional Analyses of Selected Plasticized and Isothermally Crystallized PDX Samples
Based on the DSC data presented above, several PDX samples/states representing archetypal thermo-kinetic behavior were selected for further analyses employing other experimental techniques: as-prepared (untreated) sample (cooled from 130 °C to 25 °C via heat sink annealed at 25 °C); sample crystallized at 20 °C from glass; sample crystallized at 80 °C from melt; samples plasticized 50 × 5 min at 130/150/170/190 °C and cooled from 130 to 25 °C, sample plasticized 50 × 5 min at 170 °C and crystallized at 10 °C from glass, sample plasticized 50 × 5 min at 170 °C and crystallized at 60 °C from melt. Note that the Ta temperatures for the samples plasticized at 170 °C were adjusted to reflect similar states (onset of the cold crystallization, maximum of the exothermic α’→α peak) to those of the specifically crystallized non-plasticized samples.
The first findings to be introduced are those from the optical microscope—see Figure 6. Well-developed crystallites (with spherulitic morphology) were found to form at high temperatures during the crystallization from melt. For the as-prepared sample annealed at 80 °C (Figure 6A), the spherulites were ≈100 µm in diameter, with fairly uniform size distribution, which indicates crystal formation from a constant but low number of nuclei.[46, 47]
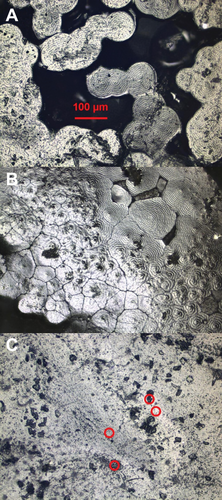
In the case of the plasticized sample (50 × 5 min at 170 °C), areas with increased density of nuclei (inferred from a large number of smaller touching/overlapping crystallites) were formed, and the overall positional regularity of the crystal formation was disrupted—see Figure 6B. This may be a sign of the monomer (from the temperature-induced depolymerization) not being distributed homogeneously throughout the polymer matrix. In all other samples, which were crystallized from the glassy state and at significantly lower temperatures, no signs of large spherulitic crystals were detected. Instead, various types of visual heterogeneities were observed—a representative illustration is shown in Figure 6C; a very similar appearance occurred for all these samples, regardless of the degree of plasticization. This is in agreement with several reports on PDX[48, 51] and also on PLA,[49, 52] where the spherulitic morphology is characteristic of high-temperature crystal growth modes, and sub-micron crystallites grow at low temperatures. The similarity of the crystalline phase content for the samples crystallized at low and high Tas also indicates much higher nucleation density for the crystallization at low Tas, which corresponds to the switch from sporadic to instantaneous nucleation.[46, 47] This marked difference in the size of formed crystallites results in a large variability of the area associated with the glass-crystal interface, which should be consequently projected in the amount of the RAF phase. This is indeed well recognizable in Figure 5B, where the RAF endotherm significantly decreases in magnitude for high Ta.
Raman microscopy was employed to gain further insight into the differences in temperature-dependent crystal growth. The typical Raman spectrum of PDX is shown in Figure 7A. The main region of interest is, however, rather narrow.[41, 53, 54] In particular, the band at 1733 cm−1 and its shoulder at ≈1745 cm−1 are believed to be roughly indicative of the ratio between the amounts of the crystalline and amorphous phases. This is at least partially confirmed by the present data shown in Figure 7B. The shoulder was found significantly smaller in the case of the large spherulites formed during the high-temperature crystallization from melt, where the collection of the Raman signal was focused directly on a particular crystal.

On the other hand, in the case of the samples crystallized at low temperatures from the glassy phase, the shoulder area (supposedly correlating with the proportion of the amorphous phase) is significantly larger. Since only sub-micron-size crystallites are reported[48, 51] to form in this temperature region, the spot from which the Raman signal collection was realized (≈3–5 µm) inevitably included a more proportional representation of the true ratio between the amorphous and crystalline phases. The possible additional enlargement of the 1745 cm−1 shoulder associated with the crystallization from a glassy state at the lowest temperatures could indicate a further decrease in the quality of the crystalline phase. Still, the enlargement itself is inconclusive based on the present data. It is noteworthy that even the Raman signal of large (well-crystallized) spherulites still comprises a significant shoulder, and thus these spherulites contain a significant amount of the amorphous phase. This is consistent with the general understanding[55] that, considered from a central point, each spherulite consists of a radial assembly of thin crystalline lamellae which are separated by amorphous layers. The Raman microscopy was also used to check the nature of the heterogeneities commonly observed on the surface of the low-temperature-crystallized samples (as depicted in Figure 6C). In Figure 7C, the Raman spectra are shown, corresponding to the four positions marked in Figure 6C. The perfect overlap of the four Raman signals confirms that the surface heterogeneities have identical chemical and crystallographic composition and that the heterogeneities are of a purely corrugate nature.
Key findings concerning the topic of the present study were obtained using TMA. The dynamic-oscillation TMA data are for the differently crystallized/plasticized samples shown in Figure 8. Steady-state storage modulus (Figure 8A) and loss tangent (Figure 8B) were recorded to evaluate the viscoelastic behavior of the samples. The storage modulus is an indicative parameter of the elastic energy stored in the material. It can also be understood as a measure of energy that must be put into the sample to distort it. The loss tangent, which is the ratio between the loss modulus and the storage modulus, is indicative of the amount of energy used to deform the material that is directly dissipated into heat. In other words, the loss tangent expresses the internal mechanical losses or damping and can be a significant measure of material impact strength. In the case of polymers, the loss tangent also provides a measure of the balance between the elastic and viscous phases in a polymeric structure and is associated with molecular movements and chain flexibility.
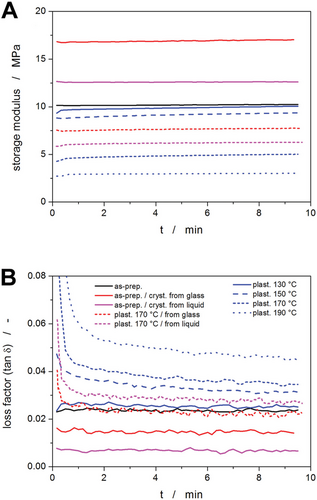
Concerning the effect of plasticization, the TMA results revealed a decrease in storage modulus (representing material stiffness) and an increase in loss tangent (reflecting material toughness) with increasing depolymerization temperature. These findings confirmed a significant effect of depolymerization temperature on the degree of plasticization by the released monomer, indicating a more pronounced viscous character of PDX samples subjected to thermal annealing. Regarding the effect of crystallization, a seemingly contradictory behavior was found when comparing the sample crystallized at 20 °C from glass and the sample crystallized at 80 °C from melt. Note that very similar crystalline phase content is supposed for both samples. In the case of the sample crystallized at a lower temperature from glass, higher values of storage modulus and loss tangent were detected. This phenomenon is probably associated with the size of crystallites. Since the crystallization can be considered a form of thermos-reversible physical crosslinking, where the crystalline regions represent the junction points,[56] the material comprising numerous sub-micron-sized crystallites resembles a dense polymer network characterized by both high storage modulus and high damping and dissipation ability.[57] On the contrary, the PDX sample crystallized from the melt at a higher temperature comprised pronouncedly larger (≈100 µm) crystallites that may be considered rather hard heterogeneities/defects than physical crosslinks, therefore the sample exhibited lower storage modulus and loss tangent values revealing also lower mechanical strength.
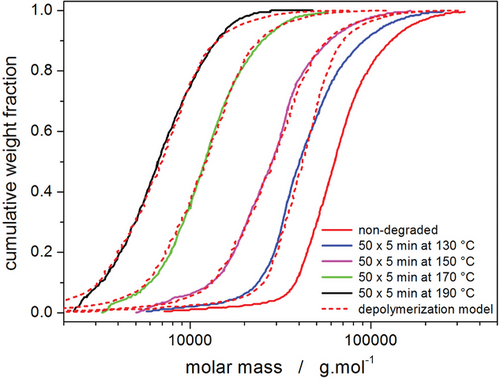
To reflect the impact of the thermally induced depolymerization on the polymer chains themselves, the molar mass distribution and molar mass averages were measured employing SEC-MALS for the as-purchased PDX sample and the samples depolymerized at 130, 150, 170, and 190 °C—see Figure 9 and Table 1.[41] To estimate the content of the monomer released during the thermally induced depolymerization (end-chain scission is the dominant depolymerization mechanism in PDX),[30-32] a simplified approach described in the ref. [58] was adopted in the present study to model the change of molar mass during depolymerization. In particular, the contributions of the end-chain scission and random chain scission (with or without the option of proportionality to the chain length) were calculated. The initial state was represented by the molar mass distribution of the as-purchased PDX. Using a non-linear optimization (least squares method), the molar mass distributions of the partially depolymerized samples were modeled by applying a combination of the repeated end-chain and random chain scissions—dashed lines in Figure 9 (a simplifying option of counting only the random scissions which split the chain in half was adopted).
| Td / °C | Mn [g mol−1] | Mw [g mol−1] | Mw/Mn | ZEC | ZRC | Wm [%] |
|---|---|---|---|---|---|---|
| – | 56 000 | 74 900 | 1.34 | – | – | 0 |
| 130 | 36 400 | 51 000 | 1.40 | 127 | 0 | 17.3 |
| 150 | 22 400 | 33 000 | 1.47 | 264 | 0 | 36.0 |
| 170 | 10 400 | 14 200 | 1.36 | 306 | 2.4 | 41.7 |
| 190 | 5900 | 7900 | 1.34 | 334 | 4 | 45.5 |
The two key parameters arising from the depolymerization model are the number of end-chain scissions (ZEC) and the number of random scissions (ZRC) per original polymer chain. For the selected partially depolymerized PDX samples, these parameters are listed in Table 1; the ZEC can be further used to estimate the weight concentration of the released monomer (Wm) in the overall monomer/polymer mixture (calculated based on weight-average molar mass, Mw). As can be seen from the estimates by the present simplified depolymerization model, at Tds ≤ 150 °C, the depolymerization proceeds practically exclusively employing the end-chain scission mechanism and the depolymerization rate significantly increases with temperature. At higher Tds, the amount of the released monomer produced by the end-chain scission still increases but at a slower rate, apparently limiting to a possibly saturated equilibrium value. However, the random scission depolymerization mechanism starts to manifest itself at the higher Tds. The concept of the polymer matrix being saturated by the released monomer can also be inferred from the presence of the p-dioxanone melting peaks (occurring in Figures 1C and 2D) which indicate that the surplus monomer segregates into a separate crystallizing phase. Considering the melting enthalpy of this signal being 11.6 J g−1, the melting enthalpy for pure p-dioxanone of 16.14 kJ mol−1,[59] and molar mass of the p-dioxanone of 102.089 g mol−1, it can be calculated that for Td = 190 °C, the corresponding Wm of the crystallizing monomer portion is ≈7.3%.
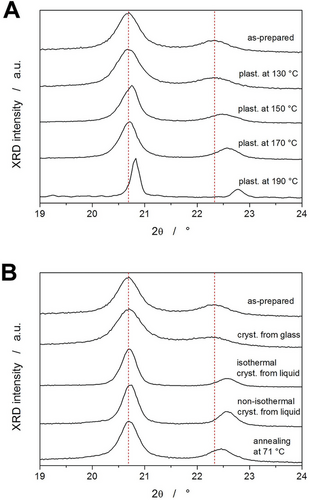
The last experimental technique used to characterize the selected PDX samples/states representing archetypal thermo-kinetic behavior was XRD. The diffraction patterns are shown in Figure 10, where the vertical dashed lines indicate the positions of the two main diffractions obtained for the as-prepared PDX (once re-melted and cooled via heat-sink). Both main diffractions depicted in Figure 10 correspond to the α form of PDX. As was shown in the ref. [48], the mesomorphic α’ form exhibits only the low-degree diffraction with a shoulder on the high-degree side, and it gradually transforms into the α form pattern with increasing temperature. The proportional increase of the diffraction near 22.4°, and its shift to higher degree values can therefore be interpreted as an increase in the amount of the α phase in the polymer structure, and as an increase in the chain packing density and better ordering of the crystalline lamellae. As can be seen in Figure 10A, the plasticization at Td ≥ 150 °C led to the formation of better ordered α polymorph during the ballistic cooling from the melt. This can be explained by the increased tendency toward crystallization, where possibly also the nucleation of the α phase proceeds at a higher intensity and for a longer time during the cooling of the plasticized melt. The supplemental measurements for differently treated non-degraded PDX samples (Figure 10B) show that under practically all tested conditions, the α polymorph forms dominantly. Most well-packed crystalline phase and developed crystallites were formed during slow cooling (1 °C min−1) of the liquid; a narrower 20.7 ° diffraction peak and shifted secondary diffraction at 22.4–22.6° were also observed after isothermal annealing of the liquid at 80 °C. Only slightly worse quality of the α crystalline phase was obtained by crystallizing a PDX sample from glass and then annealing it at 71 °C, i.e., in the region of the α’→α transition. On the other hand, the ballistically cooled PDX sample and the sample crystallized from the glassy state at 20 °C exhibit significantly different diffraction patterns, reminiscent of those reported46 for the gradual transformation of the α’ phase into the α phase during slow heating.
2.4 Crystallization Kinetics Evaluated via Classical Kinetic Analysis
The interplay between plasticization and crystal growth has crucial consequences for the mechanical properties of the PDX material. Since the slow high-temperature crystallization from the molten state is not practical for the manufacturing of either extruded, 3D-printed, or injection-molded medical implants, the plasticization-influenced crystallization kinetics will be determined for the samples crystallized from the glassy state—data introduced in Section 2.1. The following discussion will be split into two subsections, where the first one will be focused on the classical approach of the current kinetic analysis, and the second sub-section will adopt a novel (very recently published[60]) evaluation based on the concept of variable activation energy.
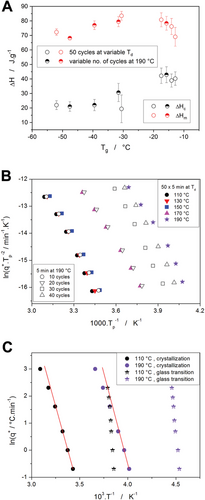
The enumeration of Equation (1) often starts with the quantification of ΔHc—see Tables S1–S9 (Supporting Information) for the list of all values. The averaged ΔHc values are shown in Figure 11A together with the corresponding enthalpies of fusion; both values are depicted in dependence on Tg, which very well reflects the degree of self-plasticization[41] (the correspondence between Tg and the particular plasticization states is listed in Table 2). It should be noted that the absolute majority of the samples exhibited practically no crystallization during the cooling—see Table 2—only the sample plasticized at 170 °C has shown an increased tendency towards high-temperature crystallization during cooling (correspondingly lower ΔHc value was recorded during the consequent heating, as shown in Figure 11A).
| Td [°C] | 110 | 130 | 150 | 170 | 190 | 190 | 190 | 190 | 190 |
|---|---|---|---|---|---|---|---|---|---|
| No. cycles | 50 | 50 | 50 | 50 | 10 | 20 | 30 | 40 | 50 |
| Tg [°C] | −12.8 | −14.1 | −17.5 | −30.6 | −15.7 | −31.6 | −39.5 | −47.6 | −52.0 |
| ΔHccooling [J g−1] | 1.0 | 0.4 | 0.1 | 11.3 | 0.1 | 2.0 | 5.6 | 3.9 | 3.2 |
The evolution of ΔHc with the degree of plasticization depicted in Figure 11A shows a marked decrease in the determined crystallization enthalpy. Since the increased tendency to the crystallization on cooling accounts only for a small portion of the overall ΔHc decrease, the loss of ≈20 J g−1 needs to be attributed to the effect of the plasticization. However, as the true overall content of the crystalline phase is expressed by ΔHm, the decrease of which is ≈13 J g−1, the significantly larger ΔHc decrease still needs an explanation additional to the plasticization resulting in a decreased amount of the polymeric phase being able to crystallize.
One such additional explanation could simply be a manifestation of Kirchhoff's law,[63] where the characteristic enthalpies change with temperature in accordance with the corresponding changes in heat capacity. The alternative but less probable explanation may also be based on different morphology of the crystalline phase (consequently responsible for significantly different enthalpies of crystal growth) being formed in the presence of a large monomer/plasticizer amount.
For the present DSC data, the Kissinger dependencies are shown in Figure 11B. From the Kissinger plot, Ec is determined based on the linear slope of the ln(q+·Tp−2)−Tp−1 dependencies. It is immediately notable that the Kissinger dependencies in Figure 11B are not linear. To determine the nature of the curvature, the so-called constant ratio (CR) cyclic experiments[65] (commonly used to study structural relaxation) were performed in the glass transition range for the same samples as were used for the crystallization measurements. As was shown in the reference,[65] the increase of Tg during the CR cycles is very sensitive to all types of instrumental distortions arising, e.g., from thermal lags (either within the sample or on the heat-transfer path to the DSC sensor), imprecise heating/cooling rates, or inaccurate temperature calibration. The depiction of the CR cycles evaluation is for the obtained Tg values shown in Figure 11C—the practically perfect linearity of these dependencies rules out the effect of the above-listed distortions. Nonetheless, if the crystallization data are displayed in a similar scaling, the dependencies are still curved, which points to the curvature being the consequence of an intrinsic change in the crystallization mechanism.
If one neglects the curvatures of the Kissinger dependencies (Figure 11B), the determined activation energies for the crystallization process would exhibit the evolution depicted in Figure 12A (the Ec values are again displayed in dependence on Tg, as explained above). A qualitatively very similar trend was also observed[41] for the activation energy of structural relaxation (glass transition kinetics). A similar explanation for the non-monotonous trend can also be adopted in the present case of crystal growth data: The initial decrease of the activation energy (from 100 to 80 kJ mol−1) is consistent with the plasticization-caused spacing apart of the polymer chains resulting in larger free volume and increased mobility for the folding movements of the polymer chains. For the highly plasticized PDX samples, the activation energy of crystal growth increased from 80 to 110 kJ mol−1, which may be associated either with possible segregation of the portion of the plasticizer into a discrete phase or with a potentially increased entanglement of the much shorter (and therefore more interspersed) polymer chains. Note that SEC-MALS has determined a decrease of the average molar mass Mw from 75 000 to 8000 g mol−1 along the plasticization progression—more details are reported in the ref. [41].
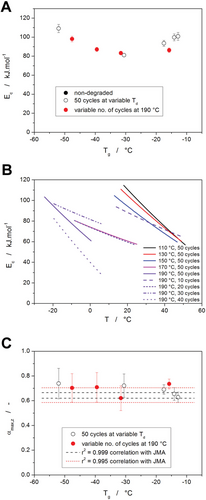
A more complex approach to the kinetic analysis can utilize the concept of variable activation energy, where the Kissinger dependence can be used to estimate the temperature-dependent evolution of Ec. In the case of the present data, the curved ln(q+·Tp−2)-Tp−1 dependencies from Figure 11B were fit by the second-order polynomial function, and the derivative of this function was used to calculate the Ec-T dependencies shown in Figure 12B. As is apparent, the self-plasticization of PDX initially led to a flattening of the said dependencies, where their decreased slope could indicate homogenization of the polymer matrix structure concerning the ease of the crystal growth formation. At the high plasticization degrees (40+ cycles at Td = 190 °C), the span of apparent activation energies increases, while the initial low-temperature Ec value also increases.
An explanation for this behavior may be sought in the earlier report on the structural relaxation in the plasticized PDX. As was shown in the reference,[41] the plasticization causes a steady increase in the width of the relaxation times distribution (plasticizer loosening the polymeric chains and enabling a wider variety of the segmental movement) and a higher dependence of the segmental relaxation movements on their current physicochemical and steric surrounding. The opposing effect of these phenomena on the steric barriers for the chain/domain movement can be interpreted via translation into the energetic barriers, i.e., activation energy.
As is apparent, except for the very low degrees of self-plasticization (50 × 5 min cycles at 110 and 130 °C), most PDX samples lie on the borderline or outside of the JMA applicability window. This is further visualized in Figure S10–S18 (Supporting Information), where the direct fits of the DSC data by the combination of Equations (1) and (4) can be found. Accordingly, the crystallization behavior of the plasticized PDX needs to be described by the AC model. Since the present paper aims to introduce base plasticization-crystallization interaction rather than detailed kinetics analysis, the detailed information about the results of the non-linear optimization used to fit the DSC data by the combination of Equation 1 and Figure 5 (or by the combination of Equation S1 and Figure S2, Supporting Information) is included in Table S10–S18 (Supporting Information).
2.5 Crystallization kinetics evaluated in terms of the variable activation energy concept
As shown in Figure 11B and Figure 12B, the activation energy of the crystallization process in PDX exhibits a significant temperature dependence. The average Ec values (Figure 12A) were further utilized in the sc-MKA method[72] to obtain the description of the DSC data in terms of Equation 1 – the results are included in Table S10–S18 (Supporting Information), where significant q+/T-based trends in the values of the AC kinetic exponents are evident. One of the main reasons for such evolution of the M and N exponents is the significantly changing asymmetry of the crystallization peaks. In the present study, the recent findings[60] (introducing the utilization of the temperature-dependent activation energy in the kinetic description of the crystallization data) will be applied to the present case of PDX. In particular, the change of the crystallization peak asymmetry as the consequence of certain Ec-T profiles will be demonstrated and discussed for the two borderline cases of the crystallization datasets obtained for Td = 110 and 190 °C (both after for 50 × 5 min cycles).
The initial evaluation of the PDX Ec-T dependencies (akin to those depicted in Figure 12B) is for the two demonstrative cases shown in Figure 13A. The experimentally obtained Kissinger dependencies are fit by the second-order polynomial, the derivative of which is used to calculate the Ec-T dependence following Equation 3. Note that the Ec-T dependencies in Figure 13A were calculated in significantly broader temperature ranges (compared to Figure 12B) that cover the whole region in which the corresponding macroscopic crystallization signal occurs. To determine the corresponding A-T dependencies, the sc-MKA method with the implemented Ec (single values evaluated at Tp from the Ec–T dependencies) was used to fit the PDX crystallization data by the AC model, and the obtained values of the pre-exponential factor A (set of six values determined for the six experimentally applied q+) were again fit by the second-order polynomial function. Consequently, these Ec–T and A–T dependencies (depicted in Figure 13A) were used to simulate the crystallization peaks at q+ = 0.5, 1, 2, 5, 10, and 20 °C min−1; for simplicity, the first-order reaction model (identical to the JMA model with the kinetic exponent m = 1) was used as a substitute for f(α) in these simulations. Note that this model offers the weakest consequences for the changes of the crystallization peak asymmetry with Ec–T,[60] and thus the derived conclusions need to be magnified/multiplied in their effect for the generic crystallization process. Examples of the crystallization peaks simulated with the implemented Ec–T and A–T dependencies are for the Td = 110 and 190 °C shown in Figure 13B,C, respectively.
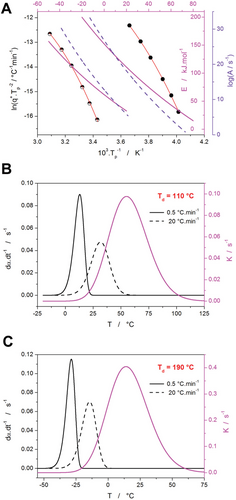
All asymmetry criteria (αmax,z, AF, and TF; listed for the present data in Tables 3 and 4) identically testify to the marked change of the asymmetry of the originally characteristic negatively asymmetric first-order peaks.
| q+ [°C min−1] | 0.5 | 1 | 2 | 5 | 10 | 20 | 50 |
|---|---|---|---|---|---|---|---|
| αmax,z | 0.599 | 0.595 | 0.588 | 0.576 | 0.563 | 0.543 | 0.496 |
| AF | 0.630 | 0.650 | 0.674 | 0.728 | 0.793 | 0.893 | 1.154 |
| TF | 0.797 | 0.808 | 0.821 | 0.851 | 0.887 | 0.945 | 1.106 |
| q+ [°C min−1] | 0.5 | 1 | 2 | 5 | 10 | 20 | 50 |
|---|---|---|---|---|---|---|---|
| αmax,z | 0.606 | 0.603 | 0.599 | 0.591 | 0.585 | 0.574 | 0.556 |
| AF | 0.605 | 0.615 | 0.633 | 0.660 | 0.693 | 0.737 | 0.829 |
| TF | 0.783 | 0.789 | 0.798 | 0.814 | 0.831 | 0.855 | 0.907 |
In the case of both simulation series, the asymmetry of the crystallization peaks slowly changes from largely negative skewing towards the rather symmetric peak shape. The effect is less pronounced for the simulations based on the Ec–T and A–T dependencies obtained from the highly plasticized PDX sample, where the overlap of the crystallization signal with the K(T)–T peak is not so large (see Figure 13C). For the same reason, the simulations performed for mJMA = 2 (not shown here) resulted in a less pronounced change of the peak asymmetry—this is in contrast with the findings presented in ref. [60]. In this case, the higher mJMA value led to a shift of the kinetic peak to a lower temperature, and thus a smaller overlap with the K(T)–T peak. Apart from shedding light on the evolution of the shape/asymmetry of the PDX crystallization peaks, the present simulations have pointed out the importance of the overlap between the crystallization signal and K(T)–T peak (which can largely vary for each particular kinetics case). Correspondingly, for a complete understanding of the practical influence of the variable activation energy on the crystallization kinetics, it is paramount to always consider the course of the K(T)–T dependence concerning the temperature ranges of the given crystallization process; i.e., via visualization shown in Figure 13B,C.
3 Conclusion
The effect of self-plasticization on the process of crystal growth in amorphous PDX was studied for samples periodically annealed at different depolymerization temperatures. Significant changes in the crystallization behavior were observed for Td > 150 °C; the depolymerization temperature was found to have a stronger impact compared to the cumulative annealing time. The self-plasticization of PDX led to the shift of the crystallization process to lower temperature, resulting in a more dominant formation of the α polymorphic phase (as opposed to the low-temperature formation of the mesomorphic α’ phase), and leading to an increase of the crystal growth rapidity. The crystallization kinetics of differently plasticized PDX samples were shown to be compatible with the concept of variable activation energy, which was discussed concerning the general principles of kinetic analysis methodology. For the harshest depolymerization conditions (Td = 190 °C, total td ≥ 200 min), the amount of formed p-dioxanone monomer increased above the saturation level of the polymeric matrix, which resulted in its partial separation and consequent crystallization (as evidenced by the melting peaks at ≈15–30 °C). Such intense self-plasticization also led to the disappearance of the distinct α→α’ polymorphic transition in PDX, and the decrease of the overall melting temperature. Apart from the apparent decrease of ΔHc (above the amount naturally inhibited by the plasticization), nothing indicates a major difference in the crystalline morphology being induced by the self-plasticization. The dominant aspect in this regard is still the temperature of crystallization, where the high-temperature crystal growth from molten PDX results in the formation of large spherulites, and the low-temperature growth during the slow heating of the glassy PDX leads to a homogeneous distribution of sub-micron crystalline domains throughout the whole polymeric matrix. The major effect of the self-plasticization was (expectedly) observed for the mechanical properties of the PDX polymer, where the storage modulus largely decreased and the loss factor (tanδ) increased with self-plasticization. However, as the significant changes of the PDX mechanical properties only occurred for Td > 150 °C, the common ways of PDX processing (hot melt extrusion, injection-molding, etc.) still have sufficient leeway between the minimum temperature for achieving the fully molten state (few min at ≈125–130 °C) and the temperature where self-plasticization becomes relevant and detrimental.
4 Experimental Section
Surgical sutures made from polydioxanone were purchased from SMI AG (St. Vith, Belgium). The filaments (containing <0.1 wt% of the Solvent Violet 13 dye—i.e., 1-hydroxy-4-(p-tolylamino)anthracene-9,10-dione) were cut into pieces and used as source material to prepare (via re-melting) thin discs for the calorimetric measurements. The heat treatment and the consequent crystallization measurements were primarily realized in the heat flow differential scanning calorimeter Q2000 (TA Instruments, USA) equipped with an autosampler, RCS90 cooling accessory, and T-zero technology. The DSC was calibrated based on the melting temperatures and enthalpies of the In, Zn, and H2O standards. For the DSC heat treatment/measurements, the thin PDX discs were hermetically sealed in low-mass T-zero Al pans, which ensured a reproducible static air atmosphere. The mass of each disc was determined with ±0.01 mg accuracy; the masses varied between 10 and 12 mg.
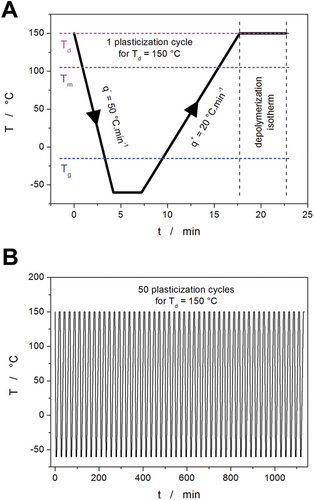
Different degrees of self-plasticization were achieved in the PDX samples (thin discs) by depolymerization at different temperatures, as described in detail in ref. [41]. In particular, the PDX samples were treated directly in the DSC. Cyclic temperature programs were applied, consisting of repeated annealing at Td for 5 min, followed by fast cooling below Tg and consequent heating back to Td. Exemplary visualization of the cyclic depolymerization temperature program for Td = 150 °C is shown in Figure 14. The following combinations of Td and number of cycles were used to prepare 9 PDX samples with different amounts of released monomer: 110 °C and 50 cycles, 130 °C and 50 cycles, 150 °C and 50 cycles, 170 °C and 50 cycles, 190 °C and 50 cycles, 190 °C and 40 cycles, 190 °C and 30 cycles, 190 °C and 20 cycles, and 190 °C and 10 cycles. SEC was used to determine the average molar mass Mw, which decreased with the degree of plasticization from 75 000 to 8000 g mol−1—more details are reported in ref. [41].
For each of the plasticized samples, a series of non-isothermal crystallization DSC measurements was performed. They were realized as simple heating scans in the −70 to 130 °C temperature range (i.e., originating from the glassy state; hence, the cold crystallization type of the measurements) at heating rates q+ = 0.5, 1, 2, 5, 10, and 20 °C min−1—see Figure 15A. Note that the crystallization process occurs in the rubbery/undercooled liquid state.
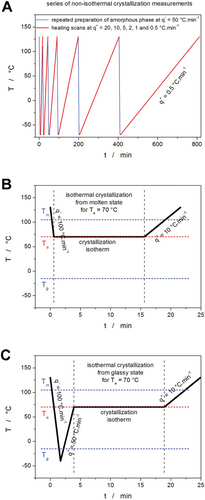
In addition to the above-described plasticization-crystallization-correlating measurements, two additional series of isothermal DSC experiments were performed to shed light on the kinetics of the formation of different polymorphic states (different crystalline phases) in the PDX. In these experiments, the as-prepared (not plasticized) PDX samples were either rapidly cooled from the melt or rapidly heated from the glassy state to a selected temperature Ta, where they were annealed (up to 1 h) until a high/full degree of crystallinity was reached. Afterward, the samples were heated at 10 °C min−1 to 130 °C to record the shape of the melting peak. The cooling from the molten state to Ta was realized at the maximum possible rate (programmed 100 °C min−1, factual rates varied with T). In the case of the crystallization from the glass/rubber state, the molten PDX was first cooled at the maximum cooling rate of −40 °C to avoid any crystallization during cooling. Afterward, the sample was heated at 50 °C min−1 to Ta. For both types of isothermal crystallization, the specific Ta was successively selected from the −10 to 90 °C range with the step of 5 °C. To avoid confusion, the two types of crystallization will be from now on denoted as “cold crystallization” (crystallization during or after heating from the glassy state) and “hot crystallization” (crystallization during or after cooling from the molten state)—see Figure 15B,C for the examples.
In addition to the DSC experiments, the potential changes in the structural arrangements of the differently crystallized and/or plasticized samples were investigated using a DXR2 Raman microscope (Thermo Fisher Scientific, USA) equipped with a 785 nm excitation diode laser (30 mW source, laser spot size 1.6 µm) and a CCD detector. The conditions for the Raman measurements were: 20 mW laser power on the sample, 1 s duration of a single scan, and 100 scans accumulated in one spectrum, with a spectral range of 50–3375 cm−1. The changes in the mechanical behavior of the differently crystallized and/or plasticized PDX samples were studied by using a thermo-mechanical analyzer Q400EM (TA Instruments, USA) equipped with the standard expansion-mode probe. The dynamic oscillation measurements were performed on thick PDX discs (diameter 4 mm, height 1.2 mm) prepared specifically for these experiments, where the molten polymer was molded at 130 °C for 1 min and then ballistically cooled down by putting the metal mold (Al, 40 mg) in contact with a 25 °C heat sink. The solidified thick PDX discs (still placed in the molds) were consequently subjected to various DSC treatments with thermal histories identical to those used for the preparation of differently crystallized and/or plasticized samples (as described in the paragraphs above). After careful removal from the molds, the thick PDX discs were used to determine the materials’ modulus under the following conditions: expansion/compression mode, temperature 40 °C (stabilized to ± 0.1 °C), constant load 0.15 N, soak time (equilibration) 20 min, force oscillation frequency 0.1 Hz (tested beforehand to produce frequency-unbiased results), force oscillation amplitude 0.1 N.
The distribution of the molar masses in selected partially depolymerized samples was measured using size exclusion chromatography (SEC) equipped with a multi-angle light scattering detector (MALS). The measurements were performed using Agilent 1200 Series Isocratic Pump and Agilent 1200 Series Autosampler; a MALS detector HELEOS, a differential refractometer (RI detector) Optilab T-rEX, and ASTRA software (Wyatt Technology). The separation was done with two Shodex HFIP-806 M 300 × 8 mm columns and hexafluoroisopropanol (HFIP) at a flow rate of 1 mL min−1 as the mobile phase. The samples were prepared as solutions in HFIP at a concentration of ≈4 mg mL−1 and dispensed in volumes of 100 µL. The used HFIP was modified by the addition of 0.02 m CF3COONa. The polymorphic crystalline phases in these samples were identified utilizing X-ray diffraction analysis (XRD), using the Empyrean XRD instrument (Malvern Panalytical, UK)–CuKα line and 5–60° 2θ range.
Acknowledgements
This work was supported by the Ministry of Education, Youth and Sports of the Czech Republic (project LM2023037). The authors thank Dr. Daniel Jezbera (University of Hradec Králové, Czech Republic) for providing the PDX material and inspiring discussions.
Open access publishing facilitated by Univerzita Pardubice, as part of the Wiley - CzechELib agreement.
Conflict of Interest
The authors declare no conflict of interest.
Open Research
Data Availability Statement
The data that support the findings of this study are available from the corresponding author upon reasonable request.


