Ball Lens-Assisted Cellphone Imaging with Submicron Resolution
Abstract
One of the most significant developments in life sciences—the discovery of bacteria and protists—was accomplished by Antoni van Leeuwenhoek in the 17th century using a single ball lens microscope. It is shown that the full potential of single lens designs can be realized in a contact mode of imaging by ball lenses with a refractive index of n ≈ 2, suitable for developing compact cellphone-based microscopes. The quality of imaging is comparable to basic compound microscopes, but with a narrower field-of-view, and is demonstrated for various biomedical samples. The maximal magnification (M > 50) with the highest resolution (≈0.66 µm at λ = 589 nm) is achieved for imaging of nanoplasmonic structures by ball lenses made from LASFN35 glass, the index of which is tuned near n = 2 using chromatic dispersion. Due to limitations of geometrical optics, the imaging theory is developed based on an exact numerical solution of the Maxwell equations, including spherical aberration and the nearfield coupling of a point source. The modeling is performed using multiscale analysis: from the field propagation inside ball lenses with diameters 30 < D/λ < 4000 to the formation of the diffracted field at distances of ≈105 λ. It is shown that such imaging enables the transition from pixel- to diffraction-limited resolution in cellphone microscopy.
1 Introduction
Many breakthrough developments in science result from curiosity and the discovery of microorganisms by Antoni van Leeuwenhoek (1632–1723) is a perfect example of that. It was made using an efficient and compact microscope of his own make.[1] Compared to modern microscopes, it was a simple device using a single ball lens, mounted in a tiny hole in the brass plate that makes up the body of his instruments. The objects were placed sufficiently close to the millimeter-scale ball lens with index of refraction n = 1.54 and their images magnified in some of his instruments over 200 times were observed directly by eye under natural illumination. The resolution was limited at ≈2 µm by the numerical aperture (NA) and spherical aberration for the most of his instruments.[1] Historically, however, single ball lens designs remained largely an example of scientific curiosity since the microscopy evolved toward the use of compound objectives and bulky stands.
The advent of megapixel charge-coupled device (CCD) and complementary metal-oxide semiconductor (CMOS) sensor arrays in the 1990s and 2000s stimulated interest in developing portable microscopes which can operate without bulky and heavy microscope stands and objectives.[2-5] They can be taken to the world's most remote locations and they can replace standard microscopes in many applications such as mobile water quality examination for bacterial contamination,[6] diagnosis of infectious and hematological diseases,[7, 8] telemedicine for the diagnosis and treatment of rash, ulcers and skin lesions termed teledermatology,[9, 10] and even more advanced biopsy-free imaging of the potentially malignant skin developments.[11] The millimeter-scale uncorrected single ball lenses are used to enhance cellphone imaging in such applications as diagnosis of iron deficiency and sickle cell anemia in a blood smear,[12] detection of soil helminths in stool samples,[13] male infertility screening,[14] and identification of malaria parasites,[15] but typically with much smaller magnifications compared to the van Leewenhoek's instruments. This results in a pixel-limited resolution of such cellphone-based microscopes at ≈1.2–1.5 µm level[12-18] with a field-of-view (FoV) limited at ≈150 µm level.[15]
The increase of magnification requires contact or near-contact operation of single lenses involving a complicated interplay of such factors as spherical aberrations and near-field coupling phenomena affecting the resolution and FoV in a situation where geometrical optics provides only a rough guidance. The spherical aberrations manifest themselves due to deviation of focusing from the geometrical optics predictions termed the focal shift with the associated blurring the image.[19] The role of spherical aberrations can be exacerbated at short distances between the object and lens because of the larger NAs involved, NA = nosinθ, where no is the index of object space, and θ is the half angle of the collection cone that enters the objective.[20] It is rather difficult to develop theory of such imaging since on the one hand larger NA values facilitate improved resolution due to the classical diffraction limit, ≈ λ/(2NA), where λ is the illumination wavelength, but on the other hand, the resolution can be degraded by the spherical aberration.[21] The spheres’ size dependence of these effects is also poorly understood. It is conceptually difficult to introduce spherical aberrations for microspheres with the wavelength-scale radius since their focusing properties can no longer be considered as a result of a small deviation from the corresponding classical geometrical optics case. Nevertheless, by considering near-field effects, it has been shown that the focal shift is greatly diminished in microspheres with the wavelength-scale radius under condition 1.5 < n < 1.75.[22]
An important direction of these studies is represented by so-called “microsphere-assisted” or “microspherical superlens imaging (MSI)” where dielectric microspheres with mesoscale diameters (D), typically in a 5 < D/λ < 20 range, are placed in contact with the nanoscale objects.[23-43] The interest in such imaging is determined by its label-free nature, inherent simplicity, potential biomedical applications, and extremely high resolution ≈λ/7 exceeding the classical diffraction limit. The MSI theory is an active area of research with several factors being considered including image magnification with a participation of the optical near-fields. Evanescent coupling effects between the nanoscale objects and mesoscale microspheres call for an exact solution of the Maxwell equations as the only possible way of theoretical understanding of such imaging.[44-51] The factors responsible for the superresolution imaging involve structured illumination with the plasmonic hot spots,[40, 42] coherent contributions,[47] resonant enhancement of near-fields under coupling with whispering gallery modes in microspheres,[44, 45] and extreme curvature of mesoscale microspheres.[48, 49] The MSI is performed using standard optical microscopes with the high-quality objectives providing an additional magnification of the virtual images obtained through microspheres. Superresolution imaging by mesoscale microspheres can be achieved in a broad range of index contrasts in 1.4 < n < 2.0 range, but the magnification is typically limited to a 2.5 < M < 5 range.[25] Another limitation of this technology is its narrow FoV ≈ D/4.[25]
Successes and limitations of MSI microscopy led to a proposal to use high-index ball lenses with significantly larger diameters spanning the range from meso- to millimeter-scale in similar applications, especially in the context of developing high-resolution cellphone-based microscopes.[52-54] The ball lenses with n ≈ 2 represent a case of special interest since, according to the paraxial ray tracing, they focus light exactly, on the shadow-side surface of such lenses[55] and, hence, a supermagnified contact-ball imaging is expected.
In this work, we develop a multilevel approach to this problem beginning from a summary of the geometrical optics results in Section 2. It is shown that in a close proximity to a certain critical index, nc = (2g + D)/(2g + D/2), where g is the gap between the ball lens and object, extremely high image magnifications can be realized for the millimeter-scale ball lenses. In Section 3, the proposed approach is applied to a cellphone imaging of various biomedical samples. It is shown that the overall quality of cellphone imaging through the ball lens approaches that for standard microscopes with 10× objective, but with a narrow field-of-view, FoV ≈ D/10. The ways of increasing FoV are discussed. It is shown that the quality of cellphone imaging is sufficient for studying the spatial distribution of tumor-infiltrating lymphocytes (TILs) in histological human melanoma samples. Section 4 is devoted to the magnification studies which are not restricted by the geometrical optics assumptions. We propose that a spectral tuning of refractive index n(λ) near the critical value of nc = 2 for the contact ball lenses made from LASFN35 glass opens a novel way of achieving maximal magnification values. This concept is demonstrated for imaging various nanoplasmonic structures. To overcome the geometrical optics limitations, we develop a magnification theory based on an exact numerical solution of the Maxwell equations at different spatial scales from the nearfield coupling of a point source, to the field propagation inside ball lenses with diameters 30 < D/λ < 4000, and, finally, to the formation of the diffracted field at distances ≈105λ. This theory explains the results of experimental contact-ball imaging. Section 5 is devoted to resolution studies demonstrating a transition from the pixel-limited to diffraction-limited cellphone imaging with increasing wavelength in contact-ball imaging with the highest resolution ≈0.66 µm realized at λ = 589 nm. The FoV studies in the case of focusing on the real image are presented in Section 6. Finally, in Section 7 we discuss the results of this work and demonstrate a clear prospect of achieving the cellphone imaging with a submicron resolution over a millimeter-scale FoV using high-index ball lenses.
2 Summary of Geometrical Optics Results
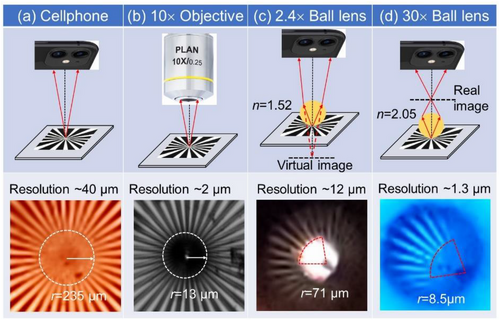
The standard cellphone cameras have a pixel-limited resolution typically in the 20–40 µm range that is well below the classical diffraction limit, λ/(2NA). The comparison of the cellphone and microscope imaging of a Siemens star in Figure 1a,b shows that the microscope with the basic 10× objective provides 20 times better resolution. Contact ball lenses can increase the magnification and, hence, resolution at the expense of FoV. Modest magnification of 2.4× is illustrated in Figure 1c for virtual imaging (in a spirit of MSI) by a millimeter-scale ball lens with n = 1.52. Significantly higher magnification of 30× is illustrated in Figure 1d for real imaging by LASFN35 ball lens with n = 2.05.
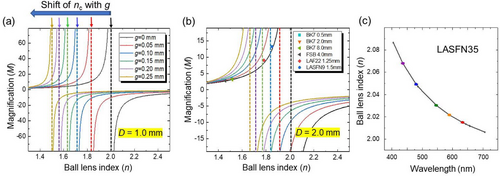
The key feature is an asymptotic increase of |M| at a certain critical value (nc) of the ball lens index, nc = (2g + D)/(2g + D/2), indicated in the case of D = 1 mm by the vertical arrows on top of Figure 2a. For a contact condition (g = 0), nc = 2 irrespective of D, as indicated by the black vertical lines in Figure 2a,b. For increasing g, the nc value decreases reaching nc = 1.5 for g = 0.25 mm and D = 1 mm. For the same g, the shift of nc to smaller values is larger for smaller ball lenses, as can be seen by comparing Figure 2a,b. The parameter nc separates the regimes of imaging. The comparison of virtual imaging (M > 0 at n < nc) with real imaging (M < 0 at n > nc) is schematically illustrated in Figure 1c,d, respectively.
The situation with the lens in contact with the object is particularly interesting since in principle it permits increased resolution due to solid immersion lens (SIL) effect.[20] Since the magnification at g = 0 does not depend on D, we compared M values measured for ball lenses with different n and D values with the calculations illustrated by the black curve in Figure 2b. Good agreement with the geometrical optics calculations is seen for ball lenses made from different glass materials.
As illustrated in Figure 2c, the spectral tuning of the refractive index of the LASFN35 ball lens glass can be realized in close proximity to critical index nc = 2 (at g = 0).
To summarize, the condition n ≈ nc can be met by selecting g and D parameters for any ball lens materials with n ≤ 2. Under contact conditions, the use of ball lenses with n ≈ 2 is particularly favorable for increasing |M| with the possible candidates of LASFN35 or barium titanate glasses (BTG).
3 Cellphone Imaging of Biomedical Samples
The geometrical optics results in Figure 2a,b show that both virtual and real imaging can be used for maximizing |M| in the vicinity of nc. The virtual imaging provides significantly larger FoV, however, it can lead to an undesirable contact between the ball lens and camera objective since the plane of the virtual image is located deeply inside the sample. In contrast, the real imaging provides a comfortable object-cellphone separation by the expense of FoV.[36] Thus, in Sections 3-6 of this work we used real imaging with the focusing on the image performed by tuning the position of the cellphone with a disabled autofocus option.
Such imaging was tested using a set of biomedical samples obtained from Carolina Biological Supply company.[56] The samples were several microns thick and covered with a thin glass coverslip creating a lens separation of g = 170 µm. The samples were stained with hematoxylin and eosin (H&E). The optical contrast mechanism, however, did not use the fluorescence (FL) properties of these samples, but was based on the local modulation of their absorption and light scattering properties.
3.1 Imaging of Human Melanoma Samples
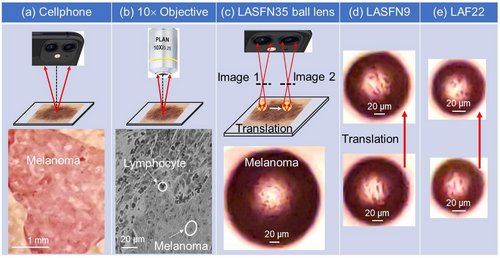
The images of histopathological human melanoma samples obtained by transmitted microscopy with the white light illumination from tungsten halogen lamp passed through the glass diffuser are presented in Figure 3. A comparison of the cellphone camera image (obtained without ball lenses) with the Mitutoyo microscope image obtained with 10× objective is presented in Figure 3a,b, respectively. Adding a ball lens on top of the coverslip of the sample allows us to dramatically improve the resolution capability of the cellphone in a circular FoV centered with a point where the ball lens touches the coverslip, as illustrated in Figure 3c–e. Translation of the ball lens was provided by a micromanipulated fiber in this example. Inside such FoVs, the quality of magnified image of the melanoma sample is comparable to that in the microscope image in Figure 3b. This is illustrated in Figure 3c-e for three ball lenses fabricated from different glass materials with a negligible absorption in the visible region of spectrum[57]: LASFN35, LASFN9, and LAF22, respectively. The parameters of the ball lenses are combined in Table 1 along with the estimated nc values and measured |M| values.
| Glass | LASFN35 | LASFN9 | LAF22 |
|---|---|---|---|
| D [mm] | 2 | 1.5 | 1.25 |
| n at 550 nm | 2.03 | 1.85 | 1.78 |
| nc for g = 170 µm | 1.74 | 1.69 | 1.65 |
| |M| (experiment) | 6 ± 1 | 9 ± 1.5 | 11 ± 2 |
As represented in Table 1, for imaging biomedical samples we realized situations where n exceeded nc by 7–14%. It resulted in a real imaging (M < 0) with the experimental magnification values in a 6 < |M| < 11 range that was sufficient for drastic improvement of the quality of cellphone imaging in a relatively narrow FoV = 0.03D centered with the point where the ball lens touches the coverslip, as illustrated in Figure 3.
3.2 Methods of Increasing FoV
FoV can be increased by the following techniques: (i) virtual imaging illustrated in Figure 1c, (ii) real imaging at oblique illumination in reflected light microscopy illustrated in Figure 4d, (iii) close-up imaging with the cellphone objective focused to infinity,[15] (iv) translation of the ball lenses followed by stitching of the corresponding images which can be combined with the methods (i–iii), and (v) parallel imaging through arrays of ball lenses. Some of these techniques are briefly described below.
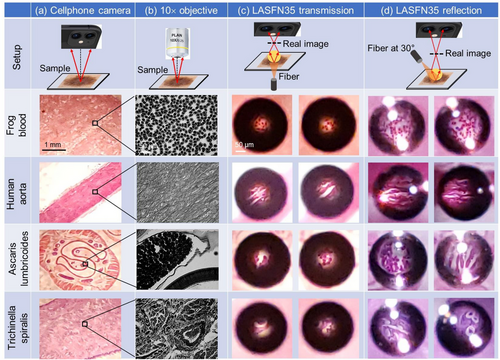
The real imaging at oblique illumination (ii) is illustrated in Figure 4 where we compared transmitted (Figure 4c) and reflected (Figure 4d) light microscopy images of various cellular samples such as frog blood and human aorta as well as images of parasitic nematodes such as ascaris lumbricoides and trichinella spiralis. In Figure 4a,b the widefield transmitted light microscopy images of these samples are obtained by the cellphone camera and by the Mitutoyo microscope with 10× objective, respectively. As shown in Figure 4c, after adding the LASFN35 ball lens with n = 2.03 and D = 2.0 mm on top of the coverslip of these samples, an additional magnification |M| = 6 is realized and the cellular-level of resolution is achieved by ordinary cellphone in a circular FoV centered with the ball lens.
As shown in Figure 4d, oblique illumination at 30° angle of incidence in reflected microscopy allows us to markedly increase FoV up to ≈0.1D in comparison with the case of transmitted microscopy illustrated in Figure 4c. In addition, oblique illumination performed along different azimuthal directions with stitching corresponding images in principle allows further increasing FoV up to ≈0.15D.
The technique of translation the millimeter-scale ball lenses followed by stitching the corresponding images (iv) is illustrated in Section 7.
The technique of parallel imaging through arrays of ball lenses (v) can be realized by embedding spherical lenses in a PDMS[31-33] or plastic[42] coverslips providing parallel imaging by multiple lenses. The coverslips can be translated along the surface of the sample.[33] Previous studies were performed with clusters of deeply embedded microspheres, however larger-scale and better ordered arrays can provide a wider FoV due to more complete area coverage with the spherical lenses. One of the methods of obtaining such highly ordered arrays is based on using suction assembly of ball lenses in microhole arrays.[58, 59]
Cellphone-based microscopy with wide FoV can be used for biopsy-free inspection of various skin diseases[11] as well as in teledermatology.[9, 10] While the basic melanoma diagnostics is dependent primarily on tumor thickness and other characteristics such as mitotic rate and ulcerative state,[60] the high-resolution imaging of the skin surface using cellphone-based microscopy can be a useful additional resource. In the case of using plastic coverslips with embedded microspheres, a large area of the skin can be imaged with a single application of the coverslip due to parallel imaging through hundreds of ball lenses.
The cellphone-based microscopy can be also used for histopathological studies. As illustrated in Figure 3b, optical microscopy allows differentiating between TIL (compact dark spots) and melanoma cells (larger objects). Since melanoma is an immunogenetic malignancy, studies of the TILs distribution in the vertical growth phase of primary melanomas has prognostic significance.[60, 61] As an example, so-called “brisk” patterns are defined by TILs diffusely infiltrating the entire melanoma or infiltrating across the entire base of its vertical growth phase. They are better correlated with prolonged disease-free and overall survival compared to so-called “non-brisk” and “absent” patterns. By translating the ball lens or by using coverslips with embedded arrays of high-index ball lenses, the images of large areas of histological samples can be obtained by cellphone-based microscopy with sufficiently high resolution.
4 Magnification Quantification
In this Section, we concentrate on imaging of nanoplasmonic structures in contact geometry (g = 0) where nc = 2. An attractive feature of the contact geometry is that it opens a principal possibility to enhance resolution by the factor of n due to the fact that the object space is filled with the lens index.[20] In the original SIL proposal, the lens is formed by a truncated sphere placed in contact with the object. It has been also argued that there are only two types of truncated spheres with hemispherical and superspherical shapes for which SIL can provide aberration-free imaging.[20] In this sense, imaging by ball lenses is fundamentally susceptible to the spherical aberrations.[17-19]
4.1 Observation of Highly Dispersive Magnification
Two types of metallic nanostructures, see left images in Figure 5a, were used in our magnification studies: (i) chrome on glass Siemens Star (Edmond Optics) and (ii) Au double-stripes on a sapphire substrate.
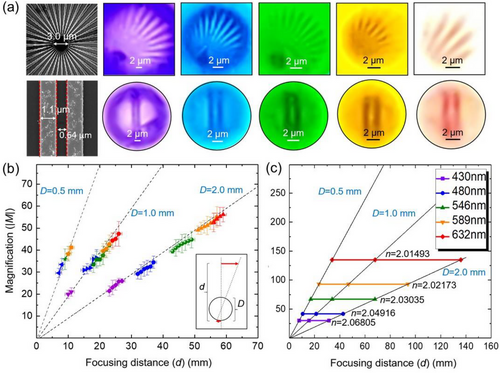
As illustrated in Figure 5a, transmitted light microscopy images of these structures were obtained using a cellphone through the ball lens with D = 2 mm. The diffused white light illumination was provided through narrow (≈10 nm) bandpass filters with transmission peaked at λ = 430, 480, 546, 589, and 632 nm. For imaging Siemens Star (first row), the ball lens was placed slightly off the center of the target to have a region of interest in the center of FoV. For imaging Au double-stripes, the ball lens was placed at the center of this object to obtain the least distorted images.
It was found that due to chromatic aberration of LASFN35 glass ball lenses in close proximity to nc = 2, the magnification of the images in Figure 5a dramatically increases with λ. |M| value was determined by comparing the pixel sizes in microns measured with and without ball lenses. We also determined the distance (d) between the object and its real image by measuring the vertical displacement of the cellphone required for refocusing from the object to its image, as shown on the insert in Figure 5b.
Due to the conformal imaging, |M| = 2d/D − 1, as shown by the dashed lines for D = 0.5, 1.0, and 2.0 mm in Figure 5b. It is seen that there is a very good agreement of experimental points with this equation. Due to a finite depth of focus, however, for each λ the image has an acceptable sharpness in a certain range of d. For this reason, the measurements were repeated many times, thus explaining a large number of experimental points for each illumination wavelength. Typical experimental error in determining |M| values was about 10%, as illustrated by the error bars in Figure 5b.
It is seen that for each D, the magnification increases with λ reaching extremely high |M| > 50 values at λ = 632 nm. Although the ball lenses with different diameters show comparable |M| values for the same λ, there is a tendency for larger ball lenses to have slightly higher |M| values.
4.2 Comparison with Geometrical Optics
The dispersive behavior of magnification was calculated for g = 0 based on the paraxial approximation of geometrical optics according to |M| = n(λ)/[n(λ) − 2], as illustrated in Figure 5c. It is seen that geometrical optics qualitatively describes the main trends observed experimentaly in Figure 5b, however it predicts significantly larger |M|GO values with much longer focusing distances compared to that observed experimentally. As an example, at λ = 632 nm geometrical optics predicts |M|GO = 135 whereas the corresponding experimental value is |M| = 50. This difference shows that the paraxial approximation used in Equation (1) is not applicable in the contact geometry due to a broad range of propagation directions involved leading to a significant role of spherical aberrations. It can be understood using shorter “effective” focal length of the lens.[62] More detailed discussion of these issues can be found.[52] The deviation from geometrical optics is, however, so significant that the whole imaging process needs to be understood based on a solution of the Maxwell equations.
4.3 Full-Wave Solution for Microscopic Imaging
To understand the imaging process in the contact geometry we investigate the point spread function (PSF) of our system in a two-dimensional (2D) geometry retaining the essential physics of the problem. While the sphere reduces to a cylinder in 2D, we will still refer to it as a sphere (or ball) to indicate the modeled object. The Maxwell equations are solved using the expansion into cylindrical functions. The use of eigenfunctions with the symmetry matching the geometry of the problem saves computational time and represents an advantage of our method over finite-difference time-domain (FDTD) or finite element methods (FEM) for imaging applications. In particular, our approach accommodates well multiple scales of the problem: submicron g/λ<<1 gap, millimeter size R/λ = 103 ball lens (R = D/2) and the centimeter range x/λ = 104 focusing distance.
The point current source is J(x, y) = zj0δ(x + R + g)δ(y), where z is the unit vector along the z axis, j0 is the amplitude of the source, δ is the Dirac delta-function, g is the source-to-sphere separation, see the coordinate system in Figure 6a. Without the sphere, the current produces a cylindrical wave. Solving the Maxwell equations, we can find the fields generated by the current in the presence of the sphere. Due to the 2D geometry and the choice of the current polarization, the electric field has only one component Ez(x,y). In the far field region, it can be represented as a superposition of plane waves propagating at different angles. The microscope objective transforms these spatial Fourier components into an image. Essentially, the image intensity coincides with the intensity distribution of the far field transformed to the position of the focal plane of the objective lens. The knowledge of the Fourier expansions allows reconstructing the fields at any location. We can introduce IM(x,y) as the image intensity, where x denotes the position of the focal plane of the microscope objective. By scanning over x, a continuous map IM(x,y) can be obtained. In experiments one naturally chooses the value of x which gives the sharpest image. We can also define IE(x,y) = |Ez(x,y)|2 as the true intensity distribution.

Figure 6a shows a typical image of a point current near a ball with R/λ = 10. This size is significantly smaller than in the experiments, but it allows us to see clearly the main features of IM(x,y). The intensity IM(x,y) is not very large inside the sphere and its maximum is on the optical axis at x/λ≈70. Despite the presence of sidelobes and a rather significant depth of field, this position can be easily identified due the narrowest width and the highest intensity.
Figure 6b shows the true intensity IE(x,y). Since the intensity diverges near the point source, the maximum of the color scale was set by hand. The intensity IE(x,y) shows significant enhancement inside the sphere near its boundary and IE(x,y) = IM(x,y) at x > R sufficiently away from the ball, where its evanescent fields do not contribute. The enhancement of the field is related to the trapping of the rays due to their total internal reflection at the sphere boundary. Indeed, a ray originating at x = −R, y = 0, and propagating inside the sphere at an angle α with respect to x will be totally reflected if sin α > 1/n. After the first total reflection, the ray undergoes subsequent total reflections without escaping the sphere. For large n a significant part of the source emission becomes trapped inside the sphere near its periphery as seen in Figure 6b. The rays propagating at the smaller angles are refracted at the sphere surface and form the image. Thus, the total internal reflection limits significantly NA of the lens.
The variation of n results in two main imaging scenarios which are similar to that introduced previously in the geometrical optics limit. In the first scenario for n < 2 (not shown here), the focal planes are found to be located at x<-R describing the virtual images with M > 0 where IE(x,y) ≠ IM(x,y). This case has been studied by modeling for smaller microspheres.[44, 47-49] As n approaches the critical index 2, the virtual image plane moves away from the sphere leading to the corresponding increase of M in good agreement with the geometrical optics predictions.
In the second scenario for n > 2, the focal planes are found to be located at x > R describing the real images with M < 0, where IE(x,y) coincides with IM(x,y), see Figure 6a,b. The |M| values, however, are found to be significantly smaller compared to that in the geometrical optics limit. As an example, the case illustrated in Figure 6a demonstrates real imaging with |M| = 7 whereas geometrical optics, see Equation (1), predicts a much higher value |M|GO = 50.37.
The intensity IE(x,y) along the optical axis calculated for real imaging with the experimental ball lens's parameters is shown in Figure 6c. The intensity shows multiple peaks with gradually decreasing spatial frequency. The pattern is a result of diffraction of the wave front emitted by the source on the effective aperture of the ball lens defined by the critical angle of the total internal reflection: the parts of the wave-front propagating at large angles cannot escape the sphere. The transmitted coherent light forms the oscillatory behavior due to the interference of all transmitted wave-front parts, i.e., depending on the number of the Fresnel zones visible from the given point on the axis.
In our experiments, however, there are factors which are likely to smear out the frequent coherent oscillations closer to the ball lens. They include incoherent or partly coherent illumination with a finite frequency bandwidth. Under these conditions the frequent oscillations closer to the ball lens are averaged out and the furthest peak with the dominant intensity can be considered as the location x where the objective is focused to capture the image. The furthest peak moves closer to the sphere with increasing n and becomes narrower, see Figure 6c. This corresponds to decreasing magnification and depth of field. This location is analogous to the peak position around x/λ = 70 illustrated for the small microsphere in Figure 6a. The location of the image gives the magnification according to |M| = x/(R + g) ≈ x/R since g<<R.
Figure 6d shows the magnification as a function of the size R at different values of n(λ) together with the experimental data points. The following properties of the calculated |M| can be observed: (a) |M| is significantly smaller than the values predicted by geometrical optics; (b) an increase of |M| with R observed for g = 0 is in a striking contrast to the geometrical optics predictions in which |M| does not depend on R in the limiting case of g = 0, but it is in a good agreement with the experiments; (c) an increase of |M| with n approaching 2 is observed. Figure 6d demonstrates a good agreement with the experiment in the overall trend M(R) for different n(λ), especially considering that no fitting parameters were used. Thus, the location of the image (and therefore, its magnification) is governed not by pure geometrical optics but by diffraction effects that explains significantly smaller magnifications observed in our work compared to the geometrical optics predictions.
5 Resolution Quantification for Real Imaging
Multiple criteria have been proposed to quantify the resolution based on discernibility of images produced by two closely spaced point sources.[63] Each point source produces a finite size image termed PSF. The exact shape of PSF intensity distribution is not known and it is typically approximated by the Gaussian function. According to the Houston resolution criterion the two point sources are just resolved if the distance between the central maxima of the composite intensity distribution equals the full width at half-maximum (FWHM) of the image intensity pattern of either point source.[64] Based on this definition, FWHM of the Gaussian PSF represents the resolution of the system.
For the resolution quantification we selected arrays of Au double-stripes. Due to long period of such arrays (>10λ), these double-stripes can be viewed as stand-alone objects. Such objects with sharp edges and recognizable shape permit more reliable resolution quantification compared to short-period arrays such as Blu-ray disks because they allow us to study the response to all spatial frequencies in the pass-band of imaging optics.[33, 34]
Our approach[33, 34] involves calculations of images using a convolution of the arbitrarily shaped objects with the 2D Gaussian PSF, as schematically illustrated in Figure 7a. Then the calculated images (Figure 7b) and their intensity profiles (Figure 7c) are fitted numerically to the observations using FWHM of the Gaussian PSF as a fitting parameter.
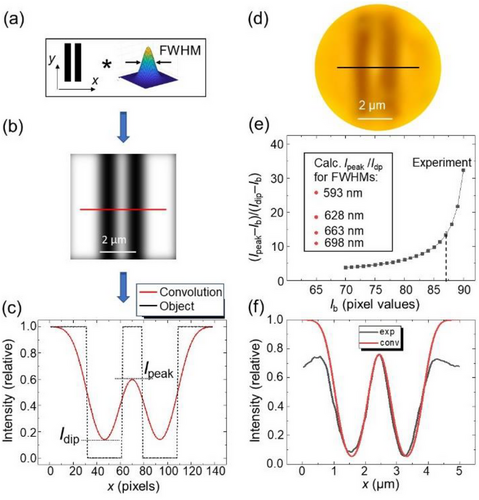
Cellphone-based transmitted light microscopy image of Au double-stripe object obtained through contact LASFN35 ball lens with D = 2 mm is illustrated in Figure 7d. The illumination was provided through yellow bandpass filter at 589 nm using a diffuser. The metallic stripes appear as dark stripes in the image.
The fitting procedure is depicted in Figure 7e,f. It was complicated due to the presence of a uniform background of scattered light (Ib) in the magnified image obtained through the diffuser and ball lens. This scattering background was not accounted for in the theoretical treatment presented in Figure 7c. It needs to be subtracted from the experimental intensity profiles to permit comparison with the theoretical results in Figure 7c calculated for the ideal case of Ib = 0. Analysis of the cellphone images showed that the pixel value of background scattering was typically in the 70 < Imin < 90 range that was quite substantial in comparison with the standard (0–255) range of pixel values for the RGB color imaging. Because of the spherical aberrations and weaker illumination toward the FoV edges, the fitting was possible only in a central part of FoV region. The main goal was to reproduce the relative intensity modulation depth across double-stripe image defined as (Ipeak − Ib)/(Idip − Ib) in the experimental profiles. As illustrated in Figure 7e by the black curve, this modulation depth strongly depends on the choice of Ib pixel value which was not known precisely. Figure 7e,f shows that the best fit to the overall intensity profile was obtained for the PSF width ≈0.66 µm after subtracting a uniform background pixel value of Ib = 87 from the experimental profile.
Good agreement with the experimental intensity profile in Figure 7f means that the wavelength-scale resolution (≈0.66 µm) was achieved by the cellphone imaging through contact ball lenses at λ = 589 nm. It should be noted, however, that in practice obtaining perfect fits is complicated by a number of factors such as pixilation of images, aberrations of imaging system, imperfections of the object, lack of the knowledge of exact PSF shape, noise in the system leading to random errors, and nonuniform illumination intensity. In particular, the sidelobes in Figure 7f have smaller intensity in the experimental image due to reduction of the illumination intensity toward the edges of FoV.
Following this procedure, the resolution was quantified for different illumination wavelengths using three LASFN35 ball lenses with D = 0.5, 1.0, and 2.0 mm, as shown in Figure 8. Similar to our magnificaton studies in Figure 5, the diffuse white light illumination was provided through narrow bandpass filters with transmission peaked at λ = 430, 480, 546, 589, and 632 nm. The color of the points in Figure 8 represents the illumination wavelength. The shape of the points represents different D values.
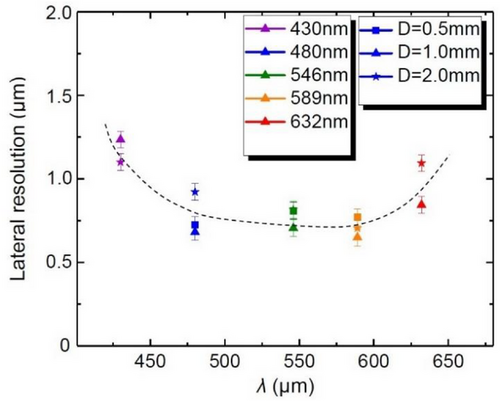
It is seen that the dependence of resolution on D is either absent or not detectable for all λs. The small deviations of resolution for ball lenses with 0.5 < D < 2.0 mm are within experimental error.
In contrast, the dependence of lateral resolution on λ can be revealed as shown by the dashed line in Figure 8. It provides some evidence that we achieved the diffraction-limited resolution at longer wavelenghts. Indeed, the resolution ≈1.2 µm at the shortest wavelength λ = 430 nm is pixel-limited due to the insufficient magnification of the ball lens (M = 20), as seen in Figures 5b and 6d. Increase of λ results in a rapid magnification enhancement. In its turn, this leads to the resolution enhancement to ≈0.8 µm at λ = 480 nm. However, further increase of the wavelength does not result in a marked improvement of resolution. Instead, the resolution tend to stabilize in a 0.7–0.8 µm range at 480 < λ < 589 nm. With further increase of λ, the resolution starts to degrade reaching ≈1.0 µm at λ = 632 nm. This behavior takes place under extremely high image magnifications (M = 50 at λ = 632 nm), so that it is not related to any pixelation effects introduced by the sensor array of the cellphone camera. However, this behavior can be naturally explained by reaching the classical diffraction limit, ≈λ/(2NA), with the effective value of NA = 0.4 describing a combined operation of the ball lens with the cellphone camera lens.
6 FoV for Real Imaging
As we discussed in Section 3, modest magnifications of ball lenses, 6 < |M| < 11, were realized in our studies of biomedical samples that resulted in FoVs = 0.03D and ≈0.1D in the cases of transmitted and reflected light microscopy, respectively. Further increase of magnification in Section 4 was realized in our studies of metallic nanostructures by contact LASFN35 ball lenses. This magnification increase, however, has resulted in decreased FoVs.
This is illustrated in Figure 9 where the FoV of Au double-stripes through LASFN35 ball lenses is presented for different λs as a function of D. The magnification of images was in the 20 < |M| < 50 range, as represented in Figure 5b.
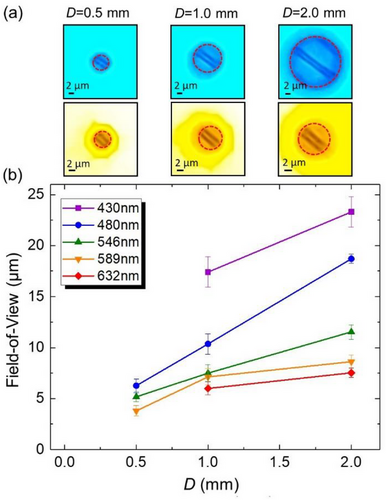
As shown in Figure 9a, FoV was determined as a circle where the quality of imaging can be slightly lower than that in the middle of FoV, but still acceptable, and where the pincushion distortions are still rather limited.[25] Despite the subjective nature of this definition, determination of FoV was not ambiguous in practice, as illustrated by multiple examples (red dashed circles) in Figure 9a for ball lenses with different diameters at λ = 480 nm (first row) and 589 nm (second row), respectively.
The FoV diameters in the object plane are summarized in Figure 9b for D = 0.5, 1.0, and 2.0 mm and for five different illumination wavelengths. It is seen that for the same ball lens diameter, FoV dramatically shrinks with increasing λ due to increased |M|. On the other hand, for the same λ, FoV tends to increase linearly with D. This increase, however, is less pronounced for λ = 589 nm and 632 nm, where the magnifications by the ball lenses reach the maximal experimental values of |M|= 50. It can be explained by a limited ability of the cell phone camera to capture the full size of such hugely magnified images.
7 Discussion and Future Work
This work takes inspiration from recent advancements in developing MSI techniques which became extremely popular area in label-free superresolution microscopy. The mesoscale diameters of the microspheres in MSI methods are critical for achievning better than diffraction-limited resolution.[23-43] The successes and challenges of MSI methods, however, created a broader question about a gap of knowledge in imaging by ball lenses with intermediate diameters representing a transition form meso- to macroscale. Contact or near-contact operation of such lenses leads to large NA factors which could potentially result in a better resolution, but stronger spherical aberration could negate these advantages. The counterplay of these factors becomes exarcerbated in the vicinity of critical index of two where images becomes strongly magnified what can be used in cellphone-based microscopy applications.
In this work, we developed a multilevel approach to this problem from a simplified geometrical optics picture to full wave consideration of microscopic imaging based on an exact numerical solution of the Maxwell equations. Our conclusion is that geometrical optics provides only a rough guidance to this problem predicting that the supermagnified imaging is possible by ball lenses with the critical index, nc = (2g + D)/(2g + D/2). For the special case of contact imaging our full wave solution accommodates multiple scales of the problem: submicron g/λ<<1 gap, millimeter size R/λ = 103 ball lens, and the centimeter range x/λ = 104 focusing distance. It is shown that the full wave approach is absolutely critical for describing the focal shift, as well as magnification and resolution properties of such strongly aberrated imaging.
Experimentally, the main results are obtained with the cellphone focusing on the real image produced by the millimeter-scale ball lenses. It is shown that the quality of imaging comparable to standard microscopy with 10× objective, but with the limited FoV = 0.1D, can be obtained for biomedical samples. As an example, it is shown that the resolution is sufficient for studying the spatial distribution of TILs in stained histological melanoma samples. We listed and briefly discussed different ways of increasing FoV including virtual imaging, real imaging at oblique illumination, close-up imaging with the cellphone objective focused to infinity,[15] translating the ball lenses followed by stitching the images, and parallel imaging through arrays of ball lenses.
The maximal magnification (M > 50) with the highest resolution (≈0.66 µm at λ = 589 nm) was achieved for contact imaging of nanoplasmonic structures. It was realized using dispersive properties, n(λ), of the material of the ball lenses made from the LASFN35 glass leading to the chromatic aberration in the vicinity of critical index of two. The ability to reach wavelength-scale resolution is demonstrated in cellphone-based microscopy using a resolution quantification based on convolution with PSF and Houston resolution criterion. Finally, a transition from the pixel-limited to diffraction-limited cellphone imaging with increasing wavelength is demonstrated in contact-ball imaging.
The systematic study of the glass ball lens properties performed in this work suggests that integration with such ball lenses is a way to develop an inexpensive gadget for cellphones, which may allow cellphone microscopy for everyday users. In fact, such system has been proposed and optimized for high resolution bright field imaging of malaria parasite in thin blood smears.[15] To enhance FoV, the motorized x–y movement of the ball lens was provided by a single compact step motor. However, only conventional ball lenses with low refractive index have been used in the previous work and the optimized system had a magnification limited at M = 4.5 with FoV = 150 µm.[15]
Since the ball lenses with n ≈ 2 offer an order of magnitude higher magnifications, they can boost the cellphone imaging beyond the resolution of a simple microscope with 10× objective. In addition, by using a close-up imaging similar to that in ref. [15], the individual millimeter-scale ball lenses can provide enlarged FoV > 200 µm which can be further increased by translation of such ball lenses.
Initial results of such imaging are illustrated in Figure 10 where we combined several close-up (d = 10 mm) images of the Siemens Star object obtained by Samsung Galaxy M12 (Model: SM-M127G/DS) cellphone using LASFN35 ball lens with D = 2 mm at λ = 632 nm. As shown in Figure 10a, the LASFN35 ball lens was fixed in a hole made in a stripe attached to a micromanipulation stage. Although our setup was rather bulky due to the use of the micrometer positional stage, a much more compact apparatus for the x-y movement of the ball lens can be constructed using a miniaturized stepper motor controlled by a low-cost microcontroller.[15] Figure 10b shows that due to small image distortions we were able to crop and combine the images obtained at different positions of the ball lens without using any stitching software tools. The vertical lines along which the images were cropped are visible in Figure 10b, but in future we plan to use ≈20% overlap between neighboring images where apparent aberration is minimal to improve the quality of stitching by using either a commercial software such as Topostitch, Image Metrology, or free ImageJ software according to procedures described in Ref. [37].
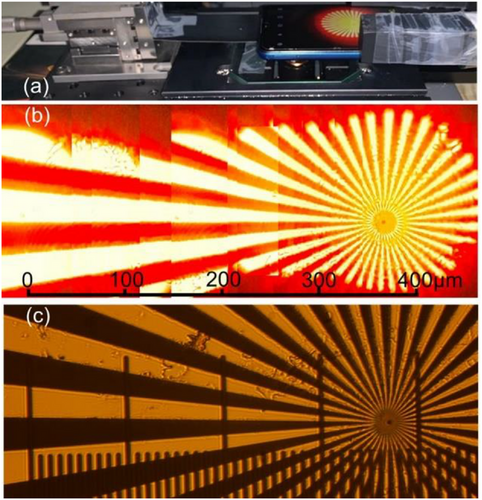
The cellphone image in Figure 10b illustrates a resolution advantage over a microscope image of the same structure (Figure 10c) obtained by the Mitutoyo 10× objective with NA = 0.26. Currently, the resolution ≈1.5 µm is demonstrated over FoV = 0.5 mm. Studying the theoretical resolution limit in the close-up geometry of imaging by high-index ball lenses requires exact solution of the Maxwell equations which can be performed using numerical modeling methods by analogy with the cases of real and virtual imaging.[54] Thus, these results show a clear prospect of achieving the cellphone imaging with a submicron resolution over a millimeter-scale FoV using high-index ball lenses.
The proposed technology could be extended to near-infrared (IR), mid-IR, or far-IR ranges. In comparison with the silicon SILs for improving the image resolution,[65, 66] it offers supermagnified imaging which could be particularly useful for minimizing the pixilation effects in the images captured by the IR photodetector focal plane arrays. Along with the LASFN35 glass (n = 1.96 at λ = 2.33 µm) one of the promising candidates for such imaging is represented by the barium titanate glass ball lenses which can be obtained with the refractive index in the 2.1–2.3 range in the visible regime (becoming close to n = 2 in the IR regime) and insignificant IR absorption.
8 Experimental Section
Samples and Ball Lenses
Biomedical samples including human melanoma, frog blood, human aorta, ascaris lumbricoides, and trichinella spiralis were obtained from Carolina Biological Supply company.[56] The samples were several microns thick and covered with a glass coverslip with 170 µm thickness. The samples were stained with H&E.
The high-resolution Siemens Star (Edmund Optics) consists of a radial pattern of Cr spokes on a silica substrate with 36 segment pairs, contained the smallest pattern sizes – 100 nm and 3300 lines/mm.
Au double-stripe arrays with various dimensions were fabricated at UNC-Charlotte on a sapphire substrate using a PMMA lift-off photoresist mask exposed in the Raith 150 e-beam lithography system. The width of fabricated stripes was 1.1 µm and the gaps between the stripes were varied from 0.47 to 0.71 µm.
The ball lenses made from LASFN35, LASFN9, and LAF22 glasses with different diameters were purchased from the Swiss Jewel company.
Optical Measurements
Comparison with standard microscopy was performed using Mitutoyo reflection and transmission microscope equipped with the long working distance objectives.
Cellphone-based imaging was performed using Samsung Galaxy S9+ with the autofocusing mode turned off. The cellphone was fixed to a boom stand with the adustable height for focusing on objects or their real images. The results in Figure 10 were obtained using Samsung Galaxy M12 (Model: SM-M127G/DS) cellphone.
In the case of transmitted light microscopy, a white light illumination provided by the halogen lamp in the base of Mitutoyo microscope was used. Illumination was provided through narrow (≈10 nm) bandpass filters with transmission peaked at λ = 430, 480, 546, 589, and 632 nm. A white light 120-grit ground glass diffuser (Edmund Optics) was installed at 8 mm distance below the sample to provide widefield incoherent illumination with a broad range of angles of incidence. The results in Figure 10 were obtaned without using the diffuser.
In the case of reflected light microscopy the illumination was provided at oblique angle of incidence using fiber coupled white light source Yokogawa/Ando. The fiber was manipulated to change the angle and direction of incidence.
Acknowledgements
The authors would like to thank Grant Bidney for discussions and Kenneth Allen for the help with developing the methodology of resolution quantification. The UNC-Charlotte team (B.J., A.R.J., and V.N.A.) was supported by the North Carolina Biotechnology Center and by the Center for Metamaterials, an NSF I/U CRC, Award No. 1068050. The work of A.V.M. was supported by the Ministry of Science and Higher Education of the Russian Federation (Grant No. 075-15-2022-293). There is no joint funding between the collaborating teams.
Conflict of Interest
The authors declare no conflict of interest.
Author Contributions
B.J. fabricated Au double-stripe structures, designed and carried out the experiments, analyzed the data, and prepared initial draft; A.J. performed imaging with enhanced FoV presented in Section 7; A.V.M. developed the theoretical model, conducted numerical modeling, and summarized its results; and V.N.A. conceived and designed the study, analyzed the experimental and theoretical data, managed the project, and wrote the final manuscript.
Open Research
Data Availability Statement
The data that support the findings of this study are available from the corresponding author upon reasonable request.


