Forest conversion alters the structure and functional processes of tropical forest soil microbial communities
Funding information: Central Public-interest Scientific Institution Basal Research Fund for Chinese Academy of Tropical Agricultural Sciences, Grant/Award Number: 1630022020008; Earmarked Fund for China Agriculture Research System, Grant/Award Number: CARS-34-ZP3; Finance Science and Technology Project of Hainan Province, Grant/Award Number: ZDYF2019145; Lancang-Mekong River International Cooperation Project, Grant/Award Number: 081720203994192003; National Natural Science Foundation of China, Grant/Award Number: 31770661
Abstract
Many studies have been carried-out on the effects of forest conversion on soil microbial community composition and diversity. However, impacts on soil microbial functions and how diversity changes across scales are poorly understood. To fill the research gap, we used metagenomic sequencing and 16S rRNA and ITS gene sequences to evaluate the microbial composition, diversity, and function of 260 soil samples collected from tropical rainforest and rubber plantation sites across Hainan Island, South China. The results revealed that: (a) Forest conversion resulted in shifts in microbial composition (from the Proteobacteria to Chloroflexi), archaeal composition (from Thaumarchaeota to Bathyarchaeota), and fungal composition (from Basidiomycota to Ascomycota). (b) Bacterial alpha, beta, and gamma diversity were not reduced by forest conversion. However, fungal beta diversity was lower in the plantations, resulting in a decrease in gamma diversity. Archaeal beta diversity was higher in rainforest versus rubber plantation soils, but archaeal gamma diversity showed the opposite pattern. (c) Soil functional composition and diversity did not differ with forest type; however, genes related to metabolism and degradation processes were significantly more abundant in the tropical rainforest. These changes in gene abundance could alter ecosystem processes. (d) Soil pH and environmental heterogeneity were the main drivers of microbial taxonomic composition and functional gene composition. Land use explained 13.28% of the variation in taxonomic composition but did not explain changes in functional gene composition. We concluded that land use changes can alter soil microbial community structure and have profound effects on ecosystem functions and processes.
1 INTRODUCTION
Hainan Island is located in the South China and is part of the Indomalayan botanical realm. It falls near the northern extent of the tropical rainforest ecological zone and conserves a large area of tropical rainforest and its biodiversity. However, over the last two decades, rubber plantations have rapidly expanded throughout Southeast Asia (Li et al., 2015), and a large previously forested area has been converted into rubber plantations (Ahrends et al., 2015). New rubber plantations are frequently established on lands that are important for biodiversity conservation and that fulfill key ecosystem functions (Ahrends et al., 2015). Conversion of the tropical rainforest to rubber plantations results in a series of environmental problems, such as biodiversity losses (Warren-Thomas, Dolman, & Edwards, 2015) and the depletion of soil water reserves (Ziegler, Fox, & Xu, 2009).
Soil microbes play a critical role in the maintenance of soil quality and function, and they represent the majority of biodiversity in terrestrial ecosystems (Philippot et al., 2013). Biodiversity may enhance ecosystem stability, productivity, and resilience to stress and disturbance (Torsvik & Øvreås, 2002). At present, there is a particular interest in how biodiversity may affect soil functions (Nannipieri et al., 2003). Recent work has examined soil microbial community composition and diversity in rubber plantations, in order to explore the impact of forest conversion on soil microbial communities. Studies conducted in Indonesia (Schneider et al., 2015), Malaysia (Kerfahi, Dong, Go, & Adams, 2016), and South China (Lan, Li, Jatoi, et al., 2017a; Lan, Li, Lesueur, Wu, & Xie, 2018; Lan, Li, Wu, & Xie, 2017b; Lan, Li, Wu, & Xie, 2017c; Lan, Wu, Li, & Chen, 2020) have found significant differences in soil bacterial communities between rubber plantations and tropical rainforest. Meanwhile, forest conversion can also result in a net loss of soil micro- and mesofaunal biodiversity (Singh et al., 2019) and decrease soil fertility and microbial biomass (Allen, Corre, Tjoa, & Veldkamp, 2015). Compared to primary forests, agricultural systems tend to have higher bacterial richness but lower fungal richness (Lan, Li, Jatoi, et al., 2017a; Cai, Zhang, Yang, & Wang, 2018,Tripathi et al., 2012, Kerfahi et al., 2016) and fungal biomass (Monkai et al., 2018). When assessing the effects of forest conversion on soil microbial diversity, it is important to focus not only on alpha diversity but also on beta and gamma diversity. Rodrigues et al. (2013) found that the beta diversity of soil bacterial communities was reduced after forest conversion, resulting in a net loss of bacterial diversity. However, that study used a nested sampling scheme centred on a 100-m2 quadrat. On such a small scale, heterogeneity in both the abiotic and biotic environment may have been very low. Thus, that study is uninformative for cases of high environmental heterogeneity. Despite the recent research's focus on the impacts of forest conversion, it remains unclear how microbial community composition (including bacteria, fungi, and archaea) is affected and whether the diversity (including alpha and beta diversity) of soil microorganisms is reduced by forest conversion. In particular, impacts on soil microbial functions are poorly understood.
Metagenomic studies can provide taxonomic and functional information for a given microbial community (Nannipieri et al., 2017; Xu et al., 2018), in cases where our knowledge of soil microbial diversity and function remains incomplete. In our study, metagenomic sequencing, as well as the sequencing of 16S rRNA and ITS rRNA genes, was used to evaluate the soil microbial composition, diversity, and function, based on a large number of soil samples from tropical rainforest and rubber plantation sites across Hainan Island. The following hypotheses were tested: (a) forest conversion results in significant changes in soil microbial community composition; (b) soil microbial diversity (including alpha, beta, and gamma diversity) is higher in tropical rainforest sites than in rubber plantation sites; and (c) forest conversion results in changes to soil microbial functions and diversity. The main aims of the study were to: (a) clarify the difference in soil bacterial, archaeal, and fungal compositions between rubber plantations and rainforest, (b) find how microbial diversity changes with scales, (c) discover how forest conversion affects soil functional process. This study will provide critical information for understanding and managing microbial functions in agroecosystems in tropical China and elsewhere.
2 METHODS
2.1 Study site
This study was conducted on Hainan Island (18°10′–20°10′N and 108°37′–111°03′E) in China. The total area of Hainan Island is about 34,000 km2 (Lopez et al., 2009). Hainan Island is the largest island within the Indo-Burma Biodiversity Hotspot in tropical Asia (Francisco-Ortega et al., 2010) and has a tropical monsoon climate. Hainan Island has a warm and humid climate all year round, with an average annual temperature of 22–26°C. The rainy season occurs from May to October, with a total precipitation of about 1,500 mm, accounting for 70–90% of the total annual precipitation. Only 10–30% of the total annual precipitation falls within the dry season, from November to April. Rainfall is abundant, ranging from 1,000 mm to 2,600 mm yearly, with an average annual precipitation of 1,639 mm. The majority of the Island (61.5%) is forested. The central part of Hainan Island is mountainous and contains old-growth tropical rainforests and monsoon forests. The tropical rainforest is vast, accounting for 17.3% of the Island's area, and mainly occurs in the south-central region at elevations greater than 500 m. Rubber plantations are found on the plateaus surrounding the central mountainous zone, where they are closer to water sources and more conveniently accessible.
2.2 Soil sampling
Sampling sites are shown in Figure S1. There are a total of five nature reserves containing tropical rainforest on Hainan Island: Bangwang Mountain, Diaoluo Mountain, Wuzhi Mountain, Yingge Mountain, and Jianfeng Mountain. These five tropical rainforests were selected for study. Five rubber plantations were also selected for study in Haikou, Danzhou, Qiongzhong, Wanning, and Ledong. These plantations are located in the north, mid-west, centre, east, and south of the Island, respectively. Study site information is provided in Table S1.
For each site, the first sample point (Figure S1: the red solid circle) was randomly selected, and then the bulk of the samples was taken along three transects facing north, southeast, and southwest. Along each transect, samples were taken at a distance of 10 cm, 1 m, 10 m, and 100 m from the first sample point. In total, 13 soil samples were collected for each site, for a total of 65 samples collected from both the rubber plantations and tropical rainforest. Soil sampling was performed twice in 2018, once in the rainy season (July) and once in the dry season (January), for a total of 260 soil samples (130 per forest type). Soil samples were divided into two parts: one was air-dried and passed through a 0.25-mm sieve before measuring soil organic matter (SOM), soil pH, and total nitrogen (TN) and the other was stored at −80°C for later DNA extraction. For metagenomic sequencing, the 13 soil samples from each site were mixed and homogenized to form a single compound sample. Thus, there were 20 metagenomic soil samples in total. Soils were analyzed using standard methods as described by Lu (1999). Soil pH was measured in a 1:1 soil:water mixture. Soil moisture was measured gravimetrically. Soil TN was determined using a micro-Kjeldahl digestion followed by steam distillation. Total phosphorus (TP) and total potassium (TK) were digested with NaOH. Nitrate nitrogen (NN) and ammonium nitrogen (AN) were determined by steam distillation and indophenol-blue colorimetry, respectively. Soil samples were extracted with NaHCO3, and the extracts were then used to measure the available soil phosphorus (AP) using molybdate-blue colorimetry. For available soil potassium (AK), soil samples were first extracted with ammonium acetate, before loading the extracts onto an atomic absorption spectrometer with ascorbic acid as a reductant (Chen et al., 2019). The soil properties of the rubber plantation and rainforest sites are shown in Table S2.
2.3 DNA extraction and PCR amplification
Microbial DNA was extracted from 0.5 g of soil using the E.Z.N.A.® Soil DNA Kit (Omega Bio-tek, Norcross, GA) following the manufacturer's protocol. The fungal ITS1 hypervariable region was amplified using the PCR primers ITS1F (5′-CTTGGTCATTTAGAGGAAGTAA-3′) and ITS2R (5′-GCTGCGTTCTTCATCGATGC-3′) (Adams, Miletto, Taylor, & Bruns, 2013). For bacteria and archaea, the V4 hypervariable region of the bacterial 16S rRNA gene was amplified using the PCR primers 515FmodF (5′-GTGYCAGCMGCCGCGGTAA-3′) and 806RmodR (5′-GGACTACNVGGGTWTCTAAT-3′) (Sampson et al., 2016; Walters et al., 2016). The PCR reactions were conducted using the following program: an initial 3 min denaturation at 95°C; followed by 27 cycles of 30s at 95°C, 30s of annealing at 55°C, and 45 s of elongation at 72°C; and a 10 min final extension at 72°C. PCR reactions were performed in triplicate in reaction volumes of 20 μl containing 4 μl of 5 × FastPfu Buffer, 2 μl of 2.5 mMdNTPs, 0.8 μl of each primer (5 μM), 0.4 μl of FastPfu Polymerase, and 10 ng of template DNA.
2.4 Illumina MiSeq sequencing
Amplicons were extracted from 2% agarose gels, purified using the AxyPrep DNA Gel Extraction Kit (Axygen Biosciences, Union City, CA) and quantified using a QuantiFluor™-ST Fluorometer (Promega, US). Purified amplicons were pooled in equimolar and then sequenced (paired-end, 2 × 250 bp) on an Illumina MiSeq platform according to standard protocols.
2.5 Bioinformatics and data analysis
Raw fastq files were demultiplexed and quality-filtered using QIIME (Caporaso et al., 2010) (version 1.17). Operational taxonomic units (OTUs) were clustered with a 97% similarity cutoff using UPARSE (Edgar, 2013) (version 7.1 http://drive5.com/uparse/), and chimeric sequences were identified and removed using UCHIME. Using the RDP Classifier (http://rdp.cme.msu.edu/), the phylogenetic affiliation of each 16S rRNA gene and ITS gene sequence was determined using a confidence threshold of 70% with the SILVA 16S rRNA database and UNITE database, respectively (Amato et al., 2013). The relative abundance was determined for each taxa (Good, 1953), and the Shannon and Simpson diversity indices were calculated based on resampled sequence data using MOTHUR (http://www.mothur.org) (Schloss et al., 2009).
2.6 Metagenomic sequencing and annotation
Metagenomic shotgun sequencing libraries were prepared and then sequenced by Majorbio, Inc. (Shanghai, China) using the Illumina HiSeq 2000 platform. Sequences were cleaned and assembled using Seqprep, Sickle, BWA, and SOAPdenovo (Version 1.06); contigs longer than 500 bp were retained for further bioinformatic analyses. The MetaGene software was used for open reading frame (ORF) prediction, and CD-HIT was used to build a nonredundant (NR) gene catalog. Taxonomic assignment of the predicted genes was carried out using BLASTP and the integrated NR database of the National Center for Biotechnology Information (NCBI) (Tatusov et al., 2003). BLASTP was also used to search for the protein sequences of the predicted genes in the evolutionary genealogy of genes: Non-supervised Orthologous Groups (eggNOG) database (Jensen et al., 2008). The NR gene catalog was aligned against the Kyoto Encyclopedia of Genes and Genomes (KEGG) database (Kanehisa, Goto, Kawashima, Okuno, & Hattori, 2004) using BLAST (Version 2.2.28+) and then functionally annotated using KOBAAS 2.0 according to previously described methods (Qin et al., 2010). Hmmscan was used to compare the nonredundant gene set with the carbohydrate-active enzymes (CAZy) database. Next, the abundance of CAZy was calculated as the sum of the abundance of genes corresponding to CAZy. Using BLASTP, the nonredundant gene set was compared to the Comprehensive Antibiotic Resistance Database (CARD) database. Annotation results were obtained by linking the genes of target species with information on drug-resistance functions.
2.7 Statistical analysis
Funguild was used to identify fungal guilds and the abundance of each guild (Nguyen et al., 2015). A PICRUST analysis of the amplicon data was also performed to evaluate differences in gene function between rainforest and rubber plantation sites. Significant difference between rubber plantations and tropical rainforest was determined based on statistically p < .05. For each site, the relative abundance of different taxa (Good, 1953) and the Shannon diversity index were calculated based on resampled sequence data using MOTHUR (http://www.mothur.org) (Schloss et al., 2009). Beta diversity was used to estimate the diversity of bacterial, archaeal, and fungal communities across sites and was calculated as follows (Whittaker, 1960): βw = S/mα-1, where S is the total OTU richness of all samples and mα is the mean OTU richness of these samples. Nonmetric multidimensional scaling (NMDS) based on Bray–Curtis dissimilarity was performed on the abundance data to compare the microbial and functional gene composition of rubber plantation versus rainforest sites. An analysis of similarities (ANOSIM) was then used to test for significant differences in composition between rubber plantation and tropical rainforest communities. In order to understand how microbial communities are structured by environmental factors, a redundancy analysis (RDA) for both the taxonomic abundance and functional gene abundance data was carried out using the Vegan package in R. Pearson correlation heat maps were also created to visualize the correlations. For these analyses, five environmental variables were included (temperature, rainfall, season, land use, and spatial location), as well as 10 soil variables (SOM, water content [WC], soil pH [pH], TN, TP, TK, NN, AN, AP, and AK). Statistical significance was assessed using Monte Carlo tests with 999 permutations. Using the Igraph package in R, a network analysis was performed based on the 300 most abundant OTUs, to explore how keystone taxa may shift with forest conversion.
3 RESULTS
3.1 Taxonomic composition
A total of 12,878,646 quality-filtered 16S rRNA gene sequences were obtained, with an average length of 273 bp across all samples. Using these, 14,131 bacterial OTUs and 201 archaeal OTUs were identified across the 260 soil DNA samples (Table S3). Meanwhile, 14,834 fungal OTUs were classified from a total of 13,868,998 ITS gene sequences. Using metagenomic shotgun sequencing on 20 soil samples, a total of 16,968 species were identified: 1,314 archaeal species, 13,336 bacterial species, 800 viruses, and 1,451 eukaryotic species.
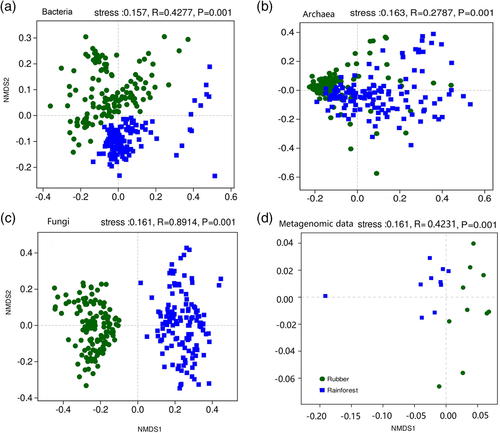
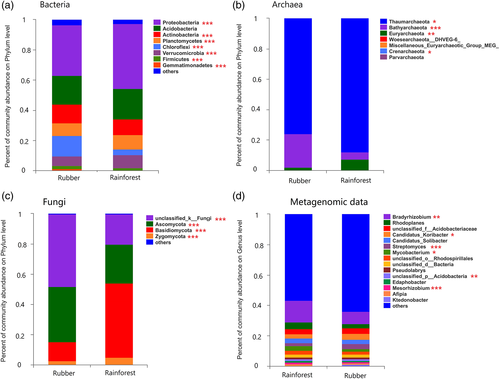
To compare the microbial soil communities of the rubber plantations and the tropical rainforest, an NMDS based on Bray–Curtis dissimilarity was performed at the OTU level, and barplots of phylum composition were also created. In the NMDS plots, the rubber plantation and tropical rainforest sites were clearly differentiated in soil bacterial composition (ANOSIM, R = 0.4277, p = .001), archaeal composition (R = 0.2787, p = .001), and fungal composition (R = 0.8914, p = .001) (Figure 1a–c). Analysis of the metagenomics sequence data also revealed differences between the two forest types (R = 0.4231, p < .001) (Figure 1d). Specifically, the relative abundance of Proteobacteria was significantly higher in rainforest versus rubber plantation soil communities (p < .001) (Figure 2a), while the Chloroflexi showed the opposite pattern (p < .001). For archaea, the relative abundance of Thaumarchaeota (p < .05) and Euryarchaeota (p < .01) was higher in rainforest soils, while the abundance of Bathyarchaeota was higher in rubber plantation soils (p < .001) (Figure 2b). For fungi, the relative abundance of Ascomycota was higher in rubber plantations (p < .001), whereas the Basidiomycota were more abundant in rainforest soils (p < .001) (Figure 2c). The metagenomic data also revealed significant differences between the rubber plantation and rainforest microbial communities at the genus level (Figure 2d).
In the network analysis for bacterial OTUs, the Planctomycetes and Acidobacteria had higher degree values in the rainforest, perhaps representing keystone taxa; however, in the rubber plantations, the Actinobacteria and Proteobacteria were likely keystone taxa (Table 1). For fungal OTUs, the network analysis identified Ascomycota and Basidiomycota as keystone taxa in the rainforest, while unclassified OTUs (not assigned to specific taxa) were most important for fungal community structure in the rubber plantations.
| Taxon | Season | Rainforest | Rubber plantation | ||||||
|---|---|---|---|---|---|---|---|---|---|
| OTU ID | Phylum | Abundance | Degree | OTU ID | Phylum | Abundance | Degree | ||
| Bacteria | Dry season | OTU13452 | Planctomycetes | 3,618 | 50 | OTU7157 | Actinobacteria | 4,164 | 52 |
| OTU11388 | Acidobacteria | 3,043 | 50 | OTU12862 | Chloroflexi | 2,522 | 49 | ||
| OTU11373 | Acidobacteria | 50,724 | 47 | OTU11199 | Actinobacteria | 5,225 | 48 | ||
| OTU12831 | Planctomycetes | 1,892 | 47 | OTU12835 | Actinobacteria | 2,222 | 47 | ||
| OTU12812 | Actinobacteria | 17,787 | 47 | OTU13202 | Acidobacteria | 2,597 | 43 | ||
| Rainy season | OTU11373 | Acidobacteria | 45,930 | 88 | OTU12588 | Actinobacteria | 2,428 | 78 | |
| OTU11421 | Verrucomicrobia | 5,437 | 79 | OTU7139 | Proteobacteria | 1,714 | 76 | ||
| OTU6675 | Acidobacteria | 2,019 | 79 | OTU8355 | Proteobacteria | 15,140 | 73 | ||
| OTU2626 | Acidobacteria | 26,970 | 78 | OTU6975 | Nitrospirae | 1,810 | 72 | ||
| OTU8228 | Acidobacteria | 6,839 | 77 | OTU2705 | GAL15 | 3,245 | 72 | ||
| Fungi | Dry season | OTU10768 | Ascomycota | 9,918 | 29 | OTU392 | Unclassified | 1,844 | 31 |
| OTU7656 | Basidiomycota | 4,373 | 26 | OTU23 | Unclassified | 696 | 30 | ||
| OTU10389 | Ascomycota | 1,261 | 25 | OTU61 | Unclassified | 1,307 | 28 | ||
| OTU9602 | Ascomycota | 1,109 | 24 | OTU136 | Unclassified | 1,646 | 27 | ||
| OTU13210 | Ascomycota | 1,303 | 23 | OTU2547 | Ascomycota | 777 | 26 | ||
| Rainy season | OTU10963 | Ascomycota | 4,510 | 36 | OTU4656 | Unclassified | 983 | 40 | |
| OTU11424 | Ascomycota | 1,413 | 35 | OTU5683 | Unclassified | 821 | 38 | ||
| OTU10509 | Ascomycota | 1,200 | 35 | OTU2200 | Unclassified | 5,021 | 37 | ||
| OTU10426 | Ascomycota | 1,115 | 33 | OTU5009 | Unclassified | 1,779 | 36 | ||
| OTU11799 | Ascomycota | 771 | 32 | OTU1965 | Basidiomycota | 5,951 | 35 | ||
3.2 Taxonomic diversity
To assess the impact of forest conversion on soil microbial diversity at a regional scale, the gamma diversity (i.e., the total taxonomic richness) of OTUs, species, genera, families, orders, classes, and phyla was calculated for the tropical rainforest and rubber plantations (Table S3). At the OTU level, the gamma diversity of bacteria and archaea was lower in tropical rainforest versus rubber plantation soils, while fungal richness showed the opposite pattern. The metagenomic data also showed lower bacterial and archaeal richness in rainforest soils but higher viral and metazoan richness (Table S4). It is worth noting that the gamma diversity (total species richness) of rubber plantation soils was higher than that of tropical rainforest soils.
To evaluate the impact of forest conversion on microbial community alpha diversity, the observed OTU richness and Shannon diversity index were compared between forest types. There was no effect of forest type on OTU richness for bacteria and fungi; however, the Shannon diversity index was lower in the rainforest versus rubber plantation bacterial and fungal communities. For the archaea, both the OTU richness and Shannon diversity index were lower in the tropical rainforest communities as compared to the rubber plantation communities. (Figure 3a).
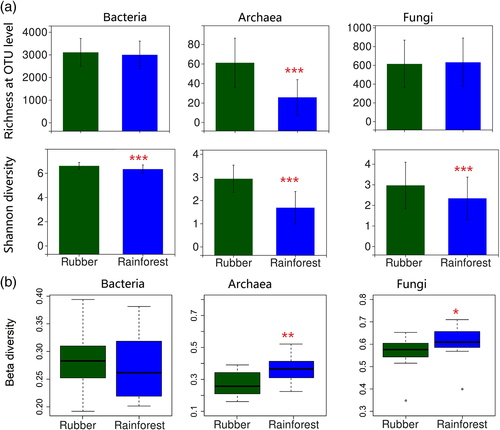
Whittaker's beta diversity was calculated to estimate the influence of forest conversion on soil microbial diversity. The beta diversity of bacterial communities did not differ between rainforest and rubber plantation sites (p = .309). The beta diversity of archaeal communities was higher in the rainforest than the rubber plantation sites (p = .001); however, this does not mean that forest conversion resulted in a net loss of archaeal diversity, as the gamma diversity of the archaea was lower in the rainforest. The fungal beta diversity was also higher in the rainforest versus rubber plantation communities (p = .001) (Figure 3b).
3.3 Gene function and functional diversity
The NMDS did not differentiate forest types on the basis of clusters of orthologous groups of proteins (COG) functional categories (ANOSIM, p = .275), KEGG functional categories (ANOSIM, p = .399), CAZy functional categories (p = .709), or antibiotic-related gene composition (ANOSIM, p = .174) (Figure 4a). However, the relative abundance of most COG functions differed between the rubber plantations and tropical rainforest (Figure 4b).
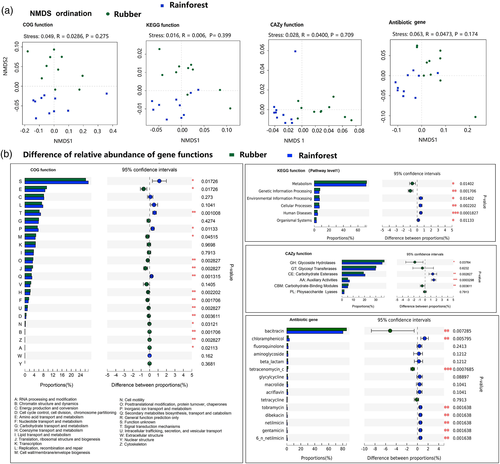
Significant differences were also found for several KEGG functional categories (pathway level 1) between rubber plantations and tropical rainforest samples. Specifically, the relative abundance of the metabolism (p < .05) and genetic information processing (p < .01) categories was lower in the tropical rainforest. In addition, three CAZyme categories differed between forest types. The relative abundance of glycoside hydrolases (GHs) (p < .05) was lower in the tropical rainforest than the rubber plantation samples, while the carbohydrate esterases (CEs) (p < .01) and auxiliary activities (AAs) category (p < .001) showed the opposite pattern (Figure 4b). Bacitracin was the most abundant antibiotic in both tropical rainforest and rubber plantation samples. The relative abundance of bacitracin was lower in the tropical rainforest (p < .01), whereas other antibiotics, such as chloramphenicol (p < .01) and tobramycin (p < .01), were more abundant in the rainforest (Figure 4b).
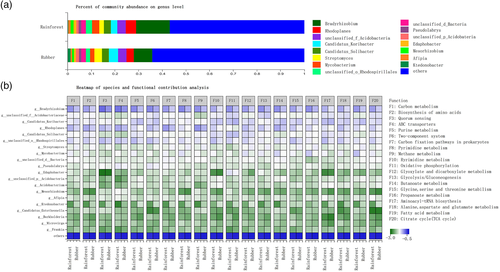
A PICRUST analysis showed that the abundance of most pathway level 3 genes was higher in the rainforest than the rubber plantation soil samples for both the dry and rainy seasons (Figure S4). For example, genes related to metabolism, such as carbon metabolism, sulfur metabolism, and nitrogen metabolism, were more abundant in the rainforest. Genes related to carbon fixation and degradation were also more common in the rainforest versus plantation samples. Meanwhile, a functional contribution analysis revealed that Bradyrhizobium (the most abundant bacterial genus in the microbial communities of both forest types) contributed most strongly to almost all tested functions (Figure 5).
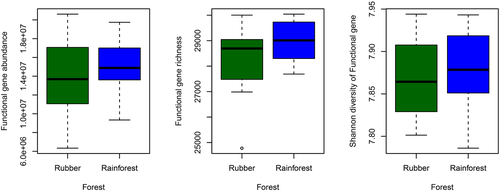
To assess the impact of forest conversion on microbial functional gene diversity, the abundance, richness, and Shannon diversity index of functional genes were compared for soil samples from the rubber plantations versus tropical rainforest (Figure 6). The abundance (mean abundance) (p = .560), richness (p = .210), and Shannon diversity index (p = .260) were unaffected by forest conversion.
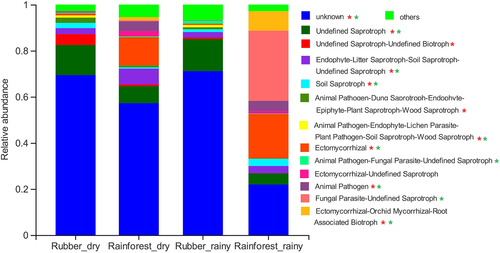
A FUNGULD analysis found a greater relative abundance of ectomycorrhizal fungi in the rainforest than the rubber plantation samples for both the dry and rainy seasons (Figure 7). At the same time, the variation in functional group composition was also greater in the rainforest. In the rainy season, the relative abundance of fungal parasite–undefined saprotrophs in the tropical rainforest was higher than in the rubber plantations.
3.4 Factors driving taxonomic and functional composition
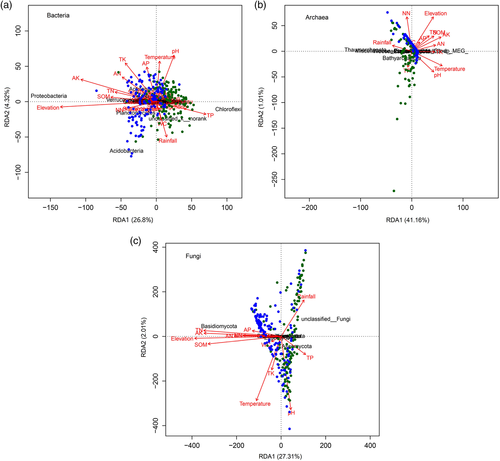
Heat maps were created to illustrate correlations between the environmental factors and either taxonomic composition (based on the metagenomic sequence data) or functional gene composition (Figure S3). Soil properties, such as soil pH, were strongly correlated with both taxonomic composition and functional composition. The RDA plots also show a negative association between soil pH and the abundance of Acidobacteria, while the soil TN was positively correlated with the abundance of Proteobacteria and Basidiomycota (Figure 8). Land use, spatial location, soil properties (soil pH and NN), and temperature all significantly impacted both the taxonomic composition and functional gene composition (Table 2). For taxonomic composition, spatial location explained 57.78% (p = .001) of the total variance and was the most influential factor. The next most important factors were soil pH (30.23%, p = .001), temperature (20.62%, p = .006), and land use (i.e., forest type), which only explained 13.28% (p = .020) of the total variance. For functional gene composition, soil pH was also most important and explained 56.92% (p = .002) of the total variance, while spatial location explained 53.79% (p = .043) of the total variance and ranked second. The next most important variables were NN, AP, and temperature, which explained 16.20% (p = .042), 14.99% (p = .048), and 13.78% (p = .049) of the total variance, respectively. Notably, the functional gene composition was little affected by land use (p > .050).
| Groups | Factors | Explained (%) | p_Value |
|---|---|---|---|
| Taxonomic composition | |||
| Land use | Land use | 13.28 | .020 |
| Spatial location | Site | 57.78 | .001 |
| Soil properties | Soil pH | 30.23 | .001 |
| WC | 3.31 | .729 | |
| SOM | 2.79 | .210 | |
| TN | 0.04 | .367 | |
| TP | 2.26 | .640 | |
| TK | 6.50 | .087 | |
| AN | 2.19 | .234 | |
| NN | 9.10 | .049 | |
| AP | 6.00 | .131 | |
| AK | 7.00 | .095 | |
| Climate | Season | 0.25 | .355 |
| Temperature | 20.62 | .006 | |
| Rainfall | 4.31 | .156 | |
| Functional gene composition | |||
| Land use | Land use | 0.34 | .308 |
| Spatial location | Site | 53.97 | .043 |
| Soil properties | Soil pH | 56.92 | .002 |
| WC | 3.59 | .450 | |
| SOM | 2.06 | .497 | |
| TN | 4.17 | .648 | |
| TP | 1.53 | .266 | |
| TK | 7.85 | .115 | |
| AN | 1.09 | .402 | |
| NN | 16.20 | .042 | |
| AP | 14.99 | .048 | |
| AK | 4.03 | .607 | |
| Climate | Season | 7.03 | .115 |
| Temperature | 13.78 | .049 | |
| Rainfall | 0.68 | .341 | |
- Abbreviations: AK, available potassium; AN, ammonia nitrogen; AP, available phosphorus; NN, nitrate nitrogen; pH, soil pH; SOM, soil organic matter; TK, total potassium; TN, total nitrogen; TP, total phosphorus; WC, water content.
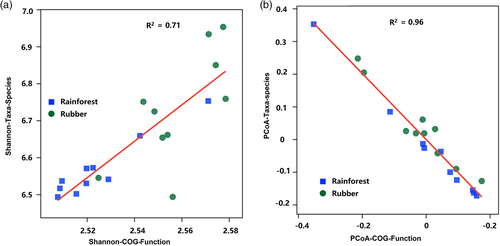
To explore the relationship between taxonomic composition and functional composition, a linear regression was performed between the Shannon diversity index of taxonomic abundance and COG function abundance (Figure 9a), revealing a strong positive relationship (R2 = 0.71, p < .001). The Bray–Curtis distances calculated from the taxonomic abundance data and functional gene abundance data were also significantly correlated (R2 = 0.96, p < .001) (Figure 9b), indicating that taxonomic and functional gene composition had similar patterns of beta diversity.
4 DISCUSSION
4.1 Taxonomic composition
Using 16S rRNA and ITS gene sequences, as well as metagenomic sequencing data, this study explored in detail how forest conversion affects microbial community structure and function. The bacterial, archaeal, and fungal composition of soil communities were altered by forest conversion (Figures 1 and 2), in line with previous studies that have shown that shifts from forested ecosystems to agricultural systems always result in changes in microbial composition (Curlevski, Xu, Anderson, & Cairney, 2010; Fierer, Leff et al., 2012) (Table S5). The most pronounced change in bacterial composition occurred for the Proteobacteria, which were significantly more common in the rainforest (Table S5). Proteobacteria are more abundant in soils with higher nitrogen levels (Chang, Haudenshield, Bowen, & Hartman, 2017; Fierer, Lauber et al., 2012), and indeed, here, TN and NN contents were higher in tropical rainforest soils (Table 2). The higher TN content may also explain the lower abundance of Chloroflexi bacteria (Debnath et al., 2016). In addition, Bradyrhizodium species (phylum Proteobacteria) are well known for their symbiotic relationships with legumes, which result in nitrogen fixation and enhanced crop productivity (Durán et al., 2014). The relative abundance of Bradyrhizobium species was higher in the rainforest (Figure 2d), perhaps as there were also more plant species in the rainforest. In the RDA, Chloroflexi were positively associated with rubber plantations, whereas Proteobacteria were positively associated with the rainforest sites (Figure 8a). This finding is in agreement with a global study that found Chloroflexi to be more abundant in agricultural systems, while Proteobacteria were more common in natural ecosystems (Trivedi, Delgado-Baquerizo, Anderson, & Singh, 2016) (Table S5).
Considering the archaeal communities, both rubber plantation and tropical rainforest soils were overwhelmingly dominated by Thaumarchaeota (Figure 2b), which have previously been shown to dominate terrestrial habitats (Auguet, Barberan, & Casamayor, 2010; Tripathi et al., 2013). However, the total abundance of archaea was lower in the rainforest than the rubber plantations (Figure S2), suggesting that there were competitive interactions between the archaea and N-oxidizing bacteria (most of which belong to the Proteobacteria) (Bates, Berg-Lyons, Caporaso, Walters, & Fierer, 2010). In all, there was a significant effect of land use on archaeal communities (Tripathi et al., 2013).
For fungal communities, the majority of the OTUs belonged to the Ascomycota and Basidiomycota (Figure 2c) regardless of forest type (Mueller, Rodrigues, Nüsslein, & Bohannan, 2016). In the RDA, Ascomycota were positively associated with rubber plantations, whereas Basidiomycota were positively correlated with the rainforest sites (Figure 8c); a reduction in the abundance of Basidiomycota has also been observed after the conversion of rainforests to artificial plantations (Kerfahi et al., 2016; Lan, Li, Jatoi, et al., 2017a). The lower abundance of Basidiomycota in the rubber plantations also explains a finding of lower relative abundance of ectomycorrhizal fungi in rubber plantations (Kerfahi et al., 2016), as most ectomycorrhizal fungi are associated with species belonging to the phylum Basidiomycetes.
Keystone species are those that have the highest degree of connectivity in a network (Rottjers & Faust, 2018), and their removal can lead to significant changes in microbial community composition and functioning (Herren & McMahon, 2018). In this study, forest conversion altered the identity of keystone taxa in microbial communities (Table 1), indicating that the soil microbial community structure had changed. However, forest conversion is not the sole factor influencing soil microbial keystone taxa; spatiotemporal heterogeneity can also affect the abundance and distribution of keystone taxa (Herren & McMahon, 2018).
4.2 Taxonomic diversity
Using alpha and beta diversity, as well as total diversity (here, total diversity means the accumulated diversity across the whole study region) (Table S3 and S4), the impact of forest conversion from tropical rainforest to rubber plantations on microbial communities was evaluated. Forest conversion did not reduce total abundance or total taxonomic richness (Figure S2), consistent with previous studies conducted in Indonesia (Schneider et al., 2015) and Malaysia (Kerfahi et al., 2016) that found higher soil bacterial alpha and beta diversity in managed lands than in rainforests. However, another similar study of soil bacterial communities conducted in the Amazon found that fine-scale (100 m2) beta diversity was lower in pastures than in tropical rainforest, likely due to the homogenization of the soil environment (Rodrigues et al., 2013). One possible reason for the higher beta diversity of bacterial communities in the rubber plantations in this study may be the relatively greater environmental heterogeneity (owing to large spatial distances at the regional scale). Thus, after careful analysis, forest conversion was deemed not to reduce bacterial alpha, beta, nor total diversity.
The beta diversity of archaeal communities was higher in the rainforest than the rubber plantation soils (Figure 3b), while the alpha diversity (Figure 3a) and total richness (Table S3) showed the opposite pattern, suggesting that diversity was not reduced by forest conversion. It is worth noting that, although forest conversion did not decrease the alpha diversity of the soil fungal community, it did reduce the beta diversity. This finding is consistent with that of a recent study conducted in Xishuangbanna, in Southwest China (Lan, Li, Jatoi, et al., 2017a; Lan, Li, Wu, & Xie, 2017b, 2017c). The lower beta diversity of fungal communities caused by forest conversion would result in a net loss of fungal diversity (Table S3). In terms of viral diversity, higher total abundance and richness were observed in the tropical rainforest (Table S4). A previous study conducted in Peru also found that rainforest viral communities were particularly rich (Fierer, Breitbart, Nulton, Salamon, & Jackson, 2007). These findings suggest that land use has a significant impact on viral community diversity.
4.3 Gene function and functional diversity
Most sequences obtained from tropical rainforest and rubber plantation soils were related to the metabolism of carbohydrates and amino acids (Figure 4b). This finding suggests that soil microbial communities are capable of degrading carbohydrates and play an important role in the carbon cycle through organic matter and litter decomposition (Castañeda & Barbosa, 2017). The relative abundance of sequences involved in secondary metabolism was significantly higher in the rainforest than the rubber plantations (Figure 4b), in agreement with a previous study conducted in Chile which found more secondary metabolism–related sequences in forest soils versus agricultural soils (Castañeda & Barbosa, 2017). The abundance of genes related to metabolism, such as carbon, sulfur, and nitrogen metabolism, was significantly higher in the tropical rainforest soils (Figure S4), indicating that microbial activities closely related to nutrient cycling decreased with forest conversion. In a previous study, the conversion of lowland tropical rainforest to rubber plantation affected nitrogen cycling because conversion decreased the NH4+ transformation rates (Allen et al., 2015). In another recent study, the conversion of rainforest to pasture led to changes in functional genes related to carbon cycling (Paula et al., 2014). Here, the relative abundance of GHs was higher in the rubber plantation soils (Figure 4b); GHs are involved in the synthesis of latex (Dai & Zeng, 2013). Latex synthesis or harvest may promote the production of GHs, which explains the greater relative abundance of GHs in rubber plantation soils. In contrast, the relative abundance of genes associated with antibiotic resistance was higher in the tropical rainforest (Figure 4b), indicating greater microbial competition; elevated microbe–microbe competitive interactions should select for increased antibiotic production and resistance (Fierer, Lauber et al. 2012; Fierer, Leff et al., 2012). Lastly, total soil functional gene abundance and diversity did not differ between forest types (Figure 6), suggesting that forest conversion did not reduce soil microbial functional diversity (Paula et al., 2014).
4.4 Factors driving taxonomic and functional composition
Previous studies have shown that soil pH is the best predictor of bacterial (Tripathi et al., 2012) and archaeal (Tripathi et al., 2013) community composition. Soil pH, which has long been regarded as a key factor driving microbial community structure and function (Fierer & Jackson, 2006), was also the most important factor here for microbial community composition and additionally affected soil microbial function. The abundance of most COG function genes was negatively associated with soil pH (Figure S3b), which suggests that soil pH was an important factor for functional gene composition. Negative correlations between functional gene composition and soil pH were also observed in Amazonian tropical rainforests (Paula et al., 2014), and lower soil pH did not reduce soil microbial function in a related study (Thomson, Ostle, Nicol, Bailey, & Griffiths, 2012). Further studies have found that the type and amount of available organic substrates strongly influence the abundance of microbial groups and their functional diversity in soil ecosystems (Torsvik & Øvreås, 2002). However, SOM was not an important driver of soil taxonomic and functional composition in this study (Table 2). Instead, study site explained more than 50% of the variation in taxonomic and functional composition (Table 2). In agricultural fields, spatially structured environmental heterogeneity can influence microbial community composition even at small scales (Franklin & Mills, 2009), and study sites here covered a broad geographical region with high environmental heterogeneity among sites.
Taxonomic diversity and functional diversity were positively correlated (Figure 9), which has also been observed in grassland soils in Northern China (Zhang, Johnston, Li, Konstantinidis, & Han, 2016), suggesting that changes in functional gene diversity were in line with changes in taxonomic composition. Though the functional composition did not change after forest conversion, the relative abundance of some functional groups did change (Figure 4), leading to an overall ecosystem shift.
5 CONCLUSIONS
This study comprehensively analyzed changes in soil microbial taxonomic composition and diversity, as well as gene functional composition and diversity, for tropical rainforest and rubber plantation sites, using metagenomics in addition to 16S rRNA and ITS gene sequencing. Taxonomic composition varied with forest type: rainforest soils were abundant in Proteobacteria and fungi in the phylum Basidiomycota, while rubber plantation soils had more abundant bacteria in the Chloroflexi and Ascomycota fungi. The alpha, beta, and total diversity of the soil community did not vary with forest type, except for the beta diversity of the fungal community, which was lower in the rubber plantations. Although the tropical rainforest and rubber plantations showed similar functional gene composition and diversity, there was variation in the relative abundance of different functional categories, suggesting that forest conversion can result in changes to microbial functional processes. In conclusion, land use changes may alter soil microbial community structure and can have profound effects on ecosystem functions and processes (Griffifiths & Philippot, 2013; Paula et al., 2014).
ACKNOWLEDGMENTS
We would also like to thank Dr. Emily Drummond at the University of British Columbia for her editing of the manuscript. This work was supported by the National Natural Science Foundation of China (31770661), the Finance Science and Technology Project of Hainan Province (ZDYF2019145), the Lancang-Mekong River International Cooperation Project (081720203994192003), the Earmarked Fund for Chinese Agricultural Research Systems (CARS-34-ZP3), and Central Public-interest Scientific Institution Basal Research Fund for Chinese Academy of Tropical Agricultural Sciences (No. 1630022020008).
CONFLICT OF INTERESTS
The authors declare no conflicts of interest.
Open Research
DATA AVAILABILITY STATEMENT
The raw reads were deposited into the NCBI Sequence Read Archive (SRA) database (Accession Number: SRP108394, SRP278296, SRP278319).


