Edge Enhancement Optimization in Flexible Endoscopic Images to the Perception of Ear, Nose and Throat Professionals
The authors have no funding, financial relationships or conflicts of interest to disclose.
Editor's Note: This Manuscript was accepted for publication on August 3, 2023.
Abstract
Objectives
Digital endoscopes are connected to a video processor that applies various operations to process the image. One of those operations is edge enhancement that sharpens the image. The purpose of this study was to (1) quantify the level of edge enhancement, (2) measure the effect on sharpness and image noise, and (3) study the influence of edge enhancement on image quality perceived by ENT professionals.
Methods
Three digital flexible endoscopic systems were included. The level of edge enhancement and the influence on sharpness and noise were measured in vitro, while systematically varying the levels of edge enhancement. In vivo images were captured at identical levels of one healthy larynx. Each series of in vivo images was presented to 39 ENT professionals according to a forced pairwise comparison test, to select the image with the best image quality for diagnostic purposes. The numbers of votes were converted to a psychometric scale of just noticeable differences (JND) according to the Thurstone V model.
Results
The maximum level of edge enhancement varied per endoscopic system and ranged from 0.8 to 1.2. Edge enhancement increased sharpness and noise. Images with edge enhancement were unanimously preferred to images without edge enhancement. The quality difference with respect to zero edge enhancement reaches an optimum at levels between 0.7 and 0.9.
Conclusion
Edge enhancement has a major impact on sharpness, noise, and the resulting perceived image quality. We conclude that ENT professionals benefit from this video processing and should verify if their equipment is optimally configured.
Level of Evidence
NA Laryngoscope, 134:842–847, 2024
INTRODUCTION
Flexible endoscopes are essential to examine nose, throat, and upper airway.1 Digital endoscopes have gradually replaced fiber optic endoscopes because of much better image quality.2-6 Digital endoscopes are connected to a video processor that applies various operations to enhance the image without perceivable delay for the observer. One of those operations is edge enhancement and its effect on an in vivo image of the larynx is illustrated in Figure 1. This operation makes the image sharper and sharpness is strongly correlated with the perceived image quality by Ear, Nose and Throat (ENT) professionals.7 Although edge enhancement is applied by all vendors, the literature on edge enhancement in ENT is limited to two articles. Kawaida et al reported that in their experience image quality was improved when structure enhancement, that is, a form of edge enhancement was applied.8 Kawaida et al later showed that edge enhancement also seems to improve diagnostic accuracy: applying structure enhancement refined the diagnosis in 2 out of 15 patients.9

Edge enhancement or sharpening is a known technique to sharpen edges by adding an undershoot on the darker side of an edge and an overshoot on the brighter side.10-13 In fact, this operation does not introduce new information or increases the resolution of the image, but increases the step in brightness of edges. This operation probably works so well, because it mimics the biological process of retinal lateral inhibition in the visual system.14 A major drawback of edge enhancement is that the operation cannot discern edges from noise and therefore enhances both.
Edge enhancement can be applied using various methods that determine the resulting image and can be optimized for different purposes, such as aesthetics and fidelity (i.e., the degree of exactness with which reality is reproduced) or diagnostics.11, 15
Edge enhancement is commonly applied in digital ENT endoscopes, but the specific method and parameters are not disclosed, and the units to express the level of edge enhancement are arbitrary and differ.13 Literature to substantiate the default settings has not been found and could not be provided by the manufacturers. Because we do not know the methods and parameters applied by the vendors, we can only measure the effects on images that are processed by the video processors.
The purpose of this study was to (1) objectively quantify the level of edge enhancement uniformly from test images, (2) measure the effect of edge enhancement on sharpness and noise, and (3) study the influence of edge enhancement on image quality perceived by ENT professionals.
MATERIALS AND METHODS
To study the effect of edge enhancement, we used three endoscopes. Because the purpose was to study image quality metrics and not to compare the types of endoscopes, we refer to endoscope A, B, and C throughout the manuscript and disclose the specific type of endoscope and video processor here once for sake of reproducibility of the study: (A) Olympus ENF-V4 connected to a CV-170, (B) Pentax VNL9-CP connected to a VIVIDEO CP-1000, and (C) Xion HD connected to a Matrix P Spectar. These systems were selected because they were operational in our outpatient clinic and readily available.
The user interfaces of the video processors have different names for the option to adjust the level of edge enhancement. System A and C have a numerical value, but system B has a wedge without numerical value. Therefore, we used a ruler on the display, to systematically vary the level of edge enhancement from 0% to 100% in nine steps of 12.5%. The exact levels of edge enhancement that are used in this study for in vitro and in vivo measurements are listed in Table I.
| Endoscope | Enhancement | Studied Settings |
|---|---|---|
| A | Structure enhancement | A0; A1; … A8 |
| B | Edge enhancement | 0; 12,5; … 100% |
| C | Contrast–edge sharpness | 0; 3; 5; 8; 10; 12; 15; 17; 20 |
To genuinely capture images, the endoscope was connected to a video processor and the DVI-D video output to the display was split using a Blackbox 1x2 DVI-D splitter. One output was connected to the surgical display for the ENT specialist, and the other output was connected to an Epiphan DVI2USB3 frame grabber. Images were stored as uncompressed 24-bit BMP files.
In vitro measurements
Pairwise Comparison
In Vivo Image Acquisition
To study the effect of edge enhancement in vivo, three different types of endoscopes were used to image the larynx of a single healthy volunteer. The endoscopes were introduced in the nose through the nasal cavities as it is the common practice for this medical examination. The ENT specialist pointed the endoscope at the larynx and steadied the view of the endoscope. For each studied level of edge enhancement (nine levels per type of endoscope), at least two images were captured. The acquired images were immediately quality checked by two ENT professionals, and the examination was repeated for the levels with unsatisfactory images. The best image was selected with respect to positioning, anatomy, and lack of motion blur. The selected images were included in the series for pairwise comparison. The protocol was reviewed by the accredited Medical Ethical Review Committee Erasmus MC and considered not to be subject to the Medical Research Involving Human Subjects Act (MEC 2022-0268).
In Vivo Image Pairwise Comparison
One image was selected per studied level of edge enhancement (n = 9) and used for a forced pairwise comparison, resulting in a series of (n2−n)/2 = (92–9)/2 = 36 test pairs of images to be compared by ENT professionals.17 Thirty-nine ENT professionals participated in this study: 16 ENT specialists, 16 ENT residents, 2 physician assistants, 3 speech therapists, and 2 researchers. All the participants had more than 6 months of relevant experience at the outpatient clinic. Three series of images with edge enhancement applied by the three included endoscopes were compared separately. The images were displayed on a color-calibrated diagnostic display (EIZO RadiForce MX315W 4096x2160) with their native resolution by a custom made Matlab program. The program randomized the sequence for each observer to prevent any form of learning effect. The side at which the images were presented was also randomized between left and right to prevent any selection bias. The resolution was checked by counting the pixels using the “print-screen” function. The characteristics sharpness, image noise, and color fidelity were verified by comparison of print screens of the in vitro test images to the original test images. The monitor was calibrated to sRGB color space with a color temperature of 6500 K and gamma of 2.2, and the luminance ranged from 0.5 to 300 cd/m2. The observers were asked to select the image with the best image quality characteristics for diagnostic purposes and neglect the influence of illumination, position, and viewing angle. The test series were preceded by a smaller training series (n = 4) to make the participants familiar with the assignment and user interface.
Pairwise Comparison Analysis
Pairwise comparison is an easy task for the participants, but the analysis is more challenging. We are not aware of pairwise comparison testing applied in the field of endoscopy, but camera industries have developed a solid theoretical basis for analyzing such data.17-21 The goal is to use the votes of the participants to determine the perceived difference of image quality on a psychometric scale. The unit of this scale is the just noticeable difference (JND). One JND is defined as the difference in image quality, where 50% of the observers perceive a difference and vote consistently, whereas the other 50% do not perceive a difference in image quality and will choose randomly. One half of the second group will randomly vote the same as the first group, resulting in 75% voting for the image with better image quality, versus 25% for the image with lesser image quality. Hence, +1 JND corresponds to a probability of 75%, 0 JND corresponds to 50%, and −1 JND corresponds to 25%. Using the JND as a unit provides an intuitive and meaningful measure to evaluate quality differences. We followed the guide of Pérez-Ortiz and Mantiuk,19 to find the differences on the psychometric scale between the nine levels of edge enhancement per endoscope.
RESULTS
In Vitro Measurements
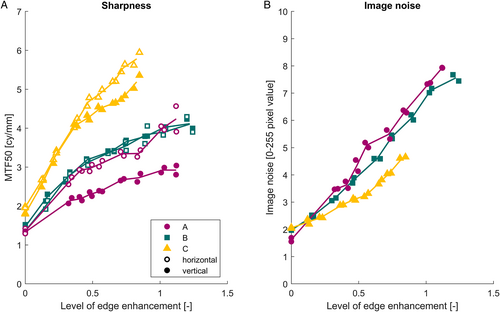
The measured levels of edge enhancement, sharpness (MTF50), and image noise using the in vitro images are shown in Figure 2A, B. The range of available amount of edge enhancement is similar for endoscope A (0–1.12) and B (0–1.24), but endoscope C has a smaller range (0–0.83).

Sharpness and noise both increased as the level of edge enhancement was increased. Endoscope C has a larger sharpness and is able to capture smaller details compared with the other endoscopes (Figure 2A). For endoscopes B and C, the horizontal sharpness is approximately equal to the vertical sharpness; however, endoscope A applies a remarkable lower amount of edge enhancement vertically compared with horizontally. Endoscope A has slightly higher levels of noise compared with B and C has the lowest noise levels (Figure 2B).
Pairwise Comparison
The pairwise comparison of in vivo images was completed by 39 ENT professionals. We found no differences in votes between the specialists and residents.
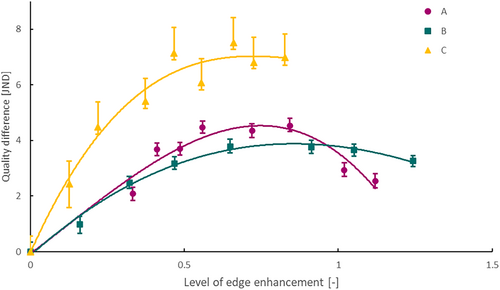
The maximum likelihood estimates of the quality differences with respect to zero edge enhancement and 95 confidence intervals (2.5 and 97.5 percentiles) are plotted versus the levels of edge enhancement measured in vitro in Figure 3. A third-order polynomial is fitted as a trend line through the quality scores of each endoscope. The trends steeply increase when edge enhancement is switched on for all endoscopes. The trend of endoscope C stabilizes at the level of edge enhancement of 0.7 at a peak of 7 JND. According the Thurstone V model, this means that more than 99.99% of ENT professionals will perceive a difference between the optimum setting and the image without edge enhancement and vote consistently for this optimum. Endoscope A and B reach an optimum at the levels of edge enhancement 0.75 and 0.90 with peak values of 3.8 JND (99.5%) and 4.5 JND (99.8%), respectively.

The general optimal level of edge enhancement is estimated between 0.7 and 0.9. This corresponds to setting A5–A6 for endoscope A, 50%–75% for endoscope B, and 15 to 20 for endoscope C.
One image of endoscope B was excluded from the analysis at setting 62.5% as this image had superior positioning and illumination compared with the adjacent settings yielding a quality score deviation of 2 JND above trendline. This indicates that the differences between image quality as a result of edge enhancement are relatively small and other factors like positioning and illumination start playing a role.
DISCUSSION
In this study, we quantified the level of edge enhancement from test images, measured the effect of edge enhancement on sharpness and image noise, and found the optimal setting by pairwise comparison for three different types of flexible ENT endoscopes.
Edge enhancement has a major impact on sharpness, noise, and the image quality as perceived by ENT professionals. We found optima of the trend lines at levels of edge enhancement between 0.7 and 0.9. Although the trend optima are in a relatively small range, the peak of the quality scores is relatively wide spread (Figure 3). For example, the difference in quality scores between the best five images of endoscope C varies by less than 1 JND, meaning that less than 50% of ENT professionals perceive a difference and vote consistently. This relatively wide peak is due to differences between observer preferences. When looking at the data of individual participants across different endoscopes, some observers prefer higher levels of edge enhancement whereas others tend to prefer more subtle levels. Even though individual preferences are present, the optimal setting is certainly not below a level of edge enhancement of 0.5 as smaller details will be perceived as too vague. Levels above 1.0 yield objectionably large edge enhancement artifacts and levels of noise. We think that users can select their setting of preference within the range of 0.5–1.0, without affecting their diagnostic accuracy, because the difference in image quality is within one JND.
In our experience, video processors can be distributed with suboptimal default settings and those settings cannot be motivated upon request. ENT professionals who are not using edge enhancement yet, can improve their endoscopic image quality by using this feature that is readily available. We encourage ENT professionals to test the effect of edge enhancement for themselves and we recommend to read the manual or contact the local vendor for support when adjusting the edge enhancement settings. Edge enhancement becomes objectionable when either the artifact or image noise becomes too large. The artifact is easily identified at the vocal cords as it is a straight well-illuminated anatomical structure against the dark background of the trachea. The bright line along the edge of the vocal cord and the darker line along the other side of the edge are physically absent, but are image artifacts produced by edge enhancement. When edge enhancement is applied too strong, it may obscure details for example near the sinus of Morgagni. Blood vessel demarcation on the mucosa is facilitated with higher levels of edge enhancement. Image noise is present in the entire image and will be increased by edge enhancement as well. Image noise will become objectionable first in the darker subglottic areas compared with well-illuminated areas such as the vocal folds and ventricular folds. When observing live images or videos, observers will notice that noise has a dynamic behavior resulting in moving noise.
Edge enhancement should be taken into account when comparing image quality of endoscopes for procurement. In our previous study, 30 ENT professionals compared in vivo images of one larynx captured using the settings as recommended by the vendors. Twenty-eight observers preferred endoscope B (edge enhancement setting 50%) over endoscope A (structure enhancement setting A1).7 From the results presented above, however, we know that both systems have similar sharpness and noise characteristics. The results of the previous study would have been different, if structure enhancement of endoscope A was set to a higher value.
Edge enhancement can improve diagnostic accuracy by enhancing surface irregularities of laryngeal lesions, so they are depicted more clearly as described by Kawaida et al, who found differences in clinical diagnosis between edge enhancement switched off (A0) and on (A4 or A8).8, 9 Later, Scholman et al showed that the difference in overall sensitivity between the fiber optic endoscope and the high-definition endoscope they compared was 47.2% versus 59.7% when reviewed by experienced ENT specialists5 or 61% versus 66.3% when reviewed by a more heterogeneous group of ENT professionals.6 We think that the key difference between these endoscopes is sharpness, that is, the level of details that can be recorded. In our previous studies, we measured the sharpness of a fiber optic endoscope and several high-definition endoscopes. High-definition endoscopes have a better sharpness compared with fiber optic endoscopes, and sharpness can be improved by edge enhancement applied in the video processor.7, 13 This may not be relevant for relatively large deviations, but will certainly improve visibility of pathologies with finer structures. This remains to be proven yet.
A limitation of this study is that we did not include images with pathology, and it might be possible that participants selected images that were more appealing, although they were explicitly asked to select the image with better image quality for diagnostic purposes. Therefore, our future work will be to study the relationship between sharpness and diagnostic accuracy.
CONCLUSION
Edge enhancement has a major impact on sharpness, image noise, and the resulting perceived image quality. This feature is readily available. We conclude that ENT professionals benefit from this video processing and should verify if their equipment is optimally configured.
ACKNOWLEDGEMENTS
We thank EIZO Europe GmbH for loaning the diagnostic monitor and remote support for calibration. We also thank Prof. Eric Boersma for discussions on the statistical analysis of pairwise comparisons. Further support was solely from institutional and/or departmental sources. There are no sources of funding to be acknowledged.


