In Vivo Visualization and Quantification of Rat Laryngeal Blood Supply After Hydration Challenge
These data were presented as a poster at the 2023 COSM Meeting (American Laryngologic Association; 23-0013).
The authors have no other funding, financial relationships, or conflicts of interest to disclose.
Abstract
Objectives
Systemic dehydration decreases total body blood volume; however, hemodynamic alterations at the level of local organs, such as the larynx, remain unclear. Here we sought to quantify superior thyroid artery (STA) blood flow after dehydration and rehydration using in vivo magnetic resonance angiography (MRA) and ultrasound imaging in a rat model.
Methods
Male Sprague–Dawley rats (N = 17) were included in this prospective, repeated measures design. Rats first underwent MRA to determine baseline STA cross-sectional area, followed by high-frequency in vivo ultrasound imaging to measure STA blood velocity at baseline. Next, rats were systemically dehydrated (water withholding), followed by rehydration (water ad-lib). Ultrasound imaging was repeated immediately after dehydration and following rehydration. The STA blood velocity and STA cross-sectional area were used to compute STA blood flow. Three rats served as temporal controls for ultrasound imaging. To determine if the challenges to hydration status affected the STA cross-sectional area, four rats underwent only MRA at baseline, dehydration, and rehydration.
Results
Systemic dehydration resulted in 10.5% average body weight loss. Rehydration resulted in average body weight gain of 10.9%. Statistically significant reductions were observed in STA mean blood flow rate after dehydration. Rehydration reversed these changes to pre-dehydration levels. No significant differences were observed in STA cross-sectional area with dehydration or rehydration.
Conclusion
Systemic dehydration decreased blood flow in the superior thyroid artery. Rehydration restored blood flow in the STA. Change in hydration status did not alter the STA cross-sectional area. These preliminary findings demonstrate the feasibility of using ultrasound and MRA to quantify hemodynamic changes and visualize laryngeal blood vessels.
Level of Evidence
NA Laryngoscope, 134:779–785, 2024
INTRODUCTION
Systemic dehydration has negative effects on human health.1 Systemic dehydration may also exacerbate voice conditions. It has been suggested that sufficient blood flow to the vocal folds is important for phonation.2 Dehydration decreases blood volume.3 Previous studies have investigated dehydration effects on skeletal muscle blood flow, cerebral blood flow, and cardiovascular function.4, 5 However, it is noteworthy that profound implications of systemic dehydration are not necessarily identical across the body,6, 7 and the existing literature has not established a sensitive and accurate method to specifically assess blood flow to the larynx under dehydration. Therefore, in this study, we chose to measure the blood velocity and cross-sectional area of the superior thyroid artery (STA). Previous studies have illustrated that the STA, arising from the external carotid artery, serves as the principal artery for supplying blood to the vocal fold region in the larynx.8, 9 STA blood flow rate can be calculated from the STA blood velocity multiplied by the STA cross-sectional area.10
Current methodologies for visualization of blood vessel and quantification of blood flow include the application of magnetic resonance angiography (MRA)11 and ultrasound imaging.12 These methodologies have been used to quantify the strain and motion of vessel wall in mouse and pig models in vivo.13-15 Time-of-flight (TOF) sequences in MRA do not require contrast agents and are commonly used to visualize both arteries and veins with high spatial resolution.16 However, TOF-MRA has not been applied to the detection of laryngeal vascular structures. Determining blood flow rate is also critical for increasing our mechanistic understanding. Pulsed-wave Doppler ultrasound uses frequency shifts to measure the velocity of blood within a sample with high temporal resolution.17 This velocity measurement can then be used to measure blood flow. Dehydration caused by prolonged exercise decreased carotid blood flow measured via pulsed-wave Doppler ultrasound,18 suggesting this approach could be used to determine blood flow in the larynx during hydration challenge.
In this study, we combined MRA (cross-sectional area) and ultrasound imaging (blood velocity) to investigate STA blood flow under different hydration status conditions. These techniques allow for baseline, dehydration, and rehydration in vivo quantification within the same animal. Systemic dehydration was induced via published methodology19, 20 of withholding water for 72 h, resulting in an average 10% body weight loss. A 10% body weight loss is substantive, and although unlikely in routine clinical situations, was intentionally selected to provide evidence that hydration status can change laryngeal blood flow. Our findings suggest that MRA and ultrasound can be used to assess blood flow changes in the STA during hydration challenge.
METHODS
Experimental Animals
The animal experiments were conducted according to the protocols approved by the Purdue Animal Care and Use Committee (Purdue IACUC 1703001551). Seventeen Male Sprague–Dawley (SD) rats (4 months), weighing 390–479 g (Envigo Inc, Indianapolis, IN) were acclimated to the housing conditions for 1 week before experiments were conducted. Ten rats underwent baseline MRA and ultrasound at baseline, dehydration, and rehydration. Four additional rats underwent just MRA at baseline, dehydration, and rehydration. These four animals are referred to as geometric controls. Three additional rats served as temporal controls for ultrasound. These animals had ad-lib access to water for the duration of study, but were imaged at three time points.
Experimental Timeline
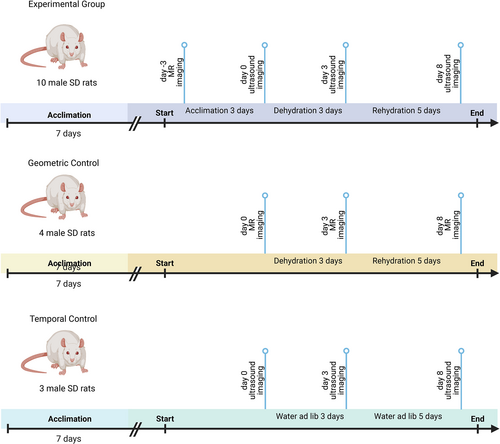
After acclimation, animals in the experiment underwent MRA to establish the baseline STA cross-sectional area and then were returned to their housing environment. The number of animals in the experimental group was determined by power analysis using previous pilot data in the lab by setting confidence level at 80%. After 3 days, animals were weighed to obtain baseline body weight, and ultrasound imaging was conducted (day 0). Next systemic dehydration was induced by water withholding for 3 days. After dehydration, animals were weighed (dehydration body weight), and ultrasound imaging was repeated (day 3). Finally, rehydration was induced by providing free access to water for 5 days. Animals were weighed after rehydration (rehydration body weight), and ultrasound imaging was repeated (day 8). To strengthen the experimental design, four additional rats underwent an identical dehydration and rehydration protocol and only MRA was conducted at days 0, 3, and 8. This group is hereafter referred to as the geometric control and was included to ensure that the STA cross-sectional area did not change over the duration of the study and with hydration challenge. Finally, three rats served as temporal control. These temporal control animals were given free access to water ad libitum throughout the experiment. Ultrasound imaging was conducted at at days 0, 3, and 8. Figure 1 shows a schematic of the experimental design (created via BioRender).
Body Weight
Percent body weight loss was calculated by subtracting the dehydration weight from the baseline weight and normalizing to the baseline weight. Percent body weight gain was calculated by subtracting the rehydration weight from the dehydration weight and normalizing to the dehydration weight.
MRA
For MRA, the animals were anesthetized using 4% isoflurane (500 mL/min, 5 min), and anesthetization was maintained throughout magnetic resonance scanning using 2% isoflurane (500 mL/min). A customized animal head holder was used in combination with a body holder to support rat positioning. Respiratory rate was monitored using a magnetic resonance-compatible small animal monitoring and gating system (Model 1030; SA Instruments, Inc.). The temperature was controlled using an air heating system which aimed to keep the animal's core temperature near 37°C.
Rats were placed in the supine position, and magnetic resonance imaging was performed on a 7 Tesla system (BioSpec 70/30, Bruker Instruments). 3D TOF sequence was used to acquire the image of the arteries (repetition time/echo time 15/3 ms, field of view [FOV] [4 cm]3, flip angle [α] 20°, matrix 1283 zero-filled to 2563, slab thickness 20 mm, number of excitations [NEX] 2). A 12-mm saturation band was placed above the excitation slab to reduce the effect of signal from venous flow. The imaging time per animal was approximately 20 min. The same experimental procedure was used for all imaging sessions and conditions: day −3, 0, 3, and 8.
Ultrasound Imaging
For ultrasound, the animals were initially anesthetized using 4% isoflurane, and anesthetization was maintained throughout ultrasound imaging using 2% isoflurane. Neck and thoracic fur were shaved, and ultrasound gel was applied to the skin to create an acoustic bridge, minimizing reflections between the transducer and the skin. Heart rate and respiration rate were monitored using a stage with built-in paw sensors. Body temperature was controlled by restraining rats on a heated platform and was monitored through diode laser detection of the rat's temperature at the tail.
Animals were placed in the supine position, and ultrasound imaging was performed with a Vevo 3100 high-frequency ultrasound imaging system (FUJIFILM VisualSonics, Toronto, ON, Canada) using an MX550D transducer (center transmit 40 MHz, axial resolution 40 μm). Imaging focal zones, brightness, and contrast were kept constant throughout the experiments. The transducer was placed to locate external carotid artery in B mode in the transverse plane, and then color-mode Doppler was employed to assist with visualization of small caliber blood vessels as shown in Figure 2A. The transducer was then moved rostrally to locate the superior thyroid artery and spectral pulsed-wave Doppler mode was employed to collect blood velocity information in the longitudinal plane (Figure 2B, C), with an insonation angle consistently below 60°. The same experimental procedure was used for all imaging sessions and conditions: days 0, 3, and 8.

MRA Analysis
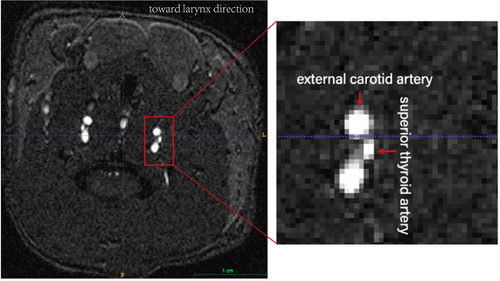
MRA data were masked manually using ITK-SNAP (version 3.6.0) for common carotid artery, external carotid artery, and superior thyroid artery. The boundaries of the arteries were manually segmented using the smooth curve of polygon mode in the ITK-SNAP toolbox. Areas generated via the software were then averaged to produce a representative cross-sectional area (Figure 3). The same analysis procedure was used for all animals and at all timepoints.
Ultrasound Imaging Analysis
Ultrasound imaging data were first processed in Vevo LAB (FUJIFILM VisualSonics) to create a velocity trace, followed by conversion to DICOM files. Velocity traces were then analyzed through a customized script (R2021b; MATLAB (MathWorks, Natick, MA) to generate averaged mean blood velocity waveforms. The custom MATLAB script computes velocity for each cardiac cycle, allows for removal of cycles affected by respiration artifact, and computes an average velocity curve with standard deviations over one cardiac cycle. For this analysis, all cardiac cycles affected by respiration movement were removed before calculating mean blood velocity averages for all cardiac cycles. The same analysis procedure was used for all animals at all timepoints. Flow rate was calculated using the following equation: blood flow rate (mm3/sec) = blood velocity (cm/sec) × vascular cross-sectional area (mm2) × 10.
Statistical Analysis
All statistical analyses were completed with GraphPad Prism software (version 8.4.0). Data were assessed for normality by Shapiro–Wilk's test. All the data were normally distributed. Repeated measures (RM) ANOVA followed by Tukey's multiple comparison test was used for comparison of body weight at different timepoints. For the experimental group, average blood flow rate was compared using two-way RM ANOVA followed by Tukey's multiple comparison test. Likewise, for the geometric control group, artery cross-sectional area was compared using two-way RM ANOVA followed by Tukey's multiple comparisons test. For the temporal control group, mean blood velocity was compared using two-way RM ANOVA followed by Tukey's multiple comparison test. Every animal in each group served as control for itself throughout the experimental design. Therefore, the statistical comparison was conducted only within group. Significance was set to p ≤ 0.05 for all statistical analyses.
Results
Body Weight
The average baseline body weight for the rats was 427.2 ± 11.2 g (mean ± SEM). The average dehydration body weight for the rats was 382.7 ± 11.0 g. The average rehydration body weight for the rats was 424.1 ± 34.3 g. Compared with the baseline body weights, water withholding resulted in an average percent body weight loss of 10.5 ± 0.3% across all rats (p < 0.0001). Compared with the dehydration body weights, rehydration resulted in an average percent body weight gain of 11.0 ± 0.6% across all rats (p < 0.0001). There were no significant differences (p = 0.102) observed between baseline and rehydration body weight.
Average STA Blood Flow
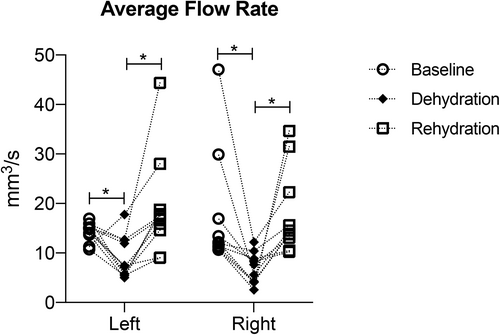
There were significant differences in average blood flow rate for both left and right superior thyroid arteries, between baseline, and dehydration (p < 0.0001), also between dehydration and rehydration (p < 0.0001). There were no significant differences (p > 0.5) between baseline and rehydration. Blood flow rate decreased after dehydration and increased after rehydration for both left and right superior thyroid arteries. Figure 4 and Table I summarize blood flow rate of left and right superior thyroid arteries at the three timepoints.
| Animal ID | 1 | 2 | 3 | 4 | 5 | 6 | 7 | 8 | 9 | 10 | Avg | SD |
|---|---|---|---|---|---|---|---|---|---|---|---|---|
| Baseline flow rate (mm3/sec) | ||||||||||||
| Left | 15.0 | 11.3 | 14.0 | 13.7 | 10.7 | 16.9 | 14.9 | 15.9 | 15.1 | 15.2 | 14.3 | 1.9 |
| Right | 29.9 | 10.7 | 47.1 | 10.7 | 12.2 | 11.4 | 12.0 | 16.9 | 13.4 | 11.2 | 17.5 | 11.9 |
| Dehydration flow rate (mm3/sec) | ||||||||||||
| Left | 5.7 | 17.8 | 7.5 | 5.0 | 5.4 | 5.8 | 7.2 | 12.6 | 12.0 | 12.7 | 9.2 | 4.3 |
| Right | 5.6 | 2.6 | 12.2 | 4.1 | 4.1 | 8.9 | 10.4 | 7.6 | 8.3 | 4.3 | 6.8 | 3.2 |
| Rehydration flow rate (mm3/sec) | ||||||||||||
| Left | 14.6 | 28.0 | 9.1 | 18.7 | 9.0 | 17.8 | 15.9 | 44.3 | 17.0 | 17.4 | 19.2 | 10.3 |
| Right | 14.5 | 34.6 | 22.3 | 31.5 | 13.8 | 10.5 | 15.6 | 13.1 | 10.2 | 13.8 | 18.0 | 8.6 |
Temporal Control
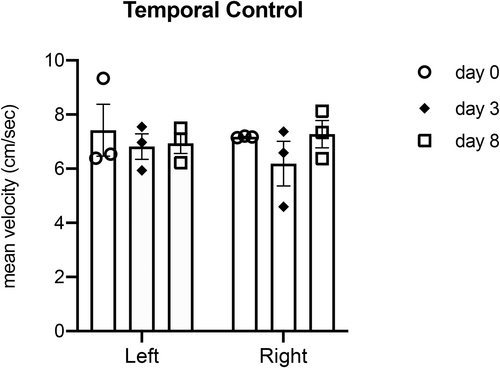
There were no significant differences observed between baseline and dehydration (p = 0.76 for left artery, p = 0.97 for right artery), or between dehydration and rehydration (p = 0.86 for left artery, p = 0.96 for right artery), or between baseline and rehydration (p = 0.99) for mean blood velocity. Figure 5 summarizes mean blood velocity of left and right superior thyroid arteries at the three timepoints (N = 3).
Geometric Control
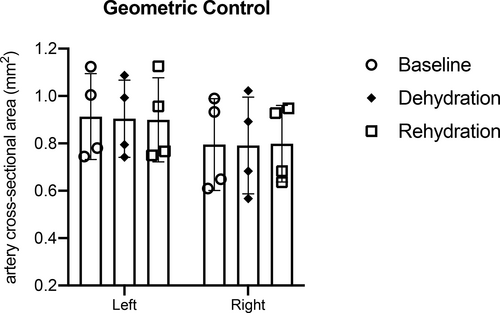
There were no significant differences in the STA cross-sectional area between left and right superior thyroid arteries at days 0, 3, and 8. There were no significant differences observed between baseline and dehydration (p = 0.99), or between dehydration and rehydration timepoints (p = 0.99), or between baseline and rehydration timepoints (p = 0.99). Figure 6 summarizes left and right superior thyroid arteries the cross-sectional area at all timepoints (N = 4).
DISCUSSION
This work combines MRA and ultrasound imaging methods to assess the blood flow rates of the superior thyroid artery (STA) before systemic dehydration, after dehydration, and following rehydration. This study demonstrated that in vivo noninvasive imaging can be repeated in the same animal at multiple timepoints. The imaging procedures used provide high-resolution anatomical definition of the STA which supplies blood to the vocal fold region. We used ultrasound imaging and a customized MATLAB script to obtain average blood velocity. As previously mentioned, a 10% body weight loss from withholding water led to a statistically significant decrease in STA blood flow rate, while a 5-day water rehydration period restored STA blood flow rate. This preliminary finding provides evidence for the feasibility and sensitivity of using TOF-MRA and spectral pulsed-wave Doppler ultrasound to quantify changes in blood flow rate after systemic challenges. To the best of our knowledge, this is the first study utilizing MRA and ultrasound imaging to characterize the STA and uncover hemodynamic alterations in the rat larynx in vivo during challenges to the hydration state.
Not surprisingly, we confirmed that water withholding induced systemic dehydration. The average body weight loss after three days of dehydration was 10.5% ± 1%. Body weight loss is considered the gold standard to assess systemic dehydration.21 The result is consistent with our previous work showing an average 10% body weight loss after water withholding.19, 22 After five days of free access to water, the rats gained 10.9% ± 2% body weight when compared with dehydration weight. We acknowledge that a 10.5% body weight is a significant amount. However, 10% body weight loss has been reported during challenging athletic events.6 One purpose of this study was to show the sensitivity of MRA and ultrasound imaging to detect changes in the hemodynamics of larynx. Therefore, future work is needed that will employ more realistic dehydration protocols.23-25
In the experimental group, our results showed that the STA blood flow rate decreased during dehydration and then increased after rehydration, suggesting that rehydration through water intake helped restore blood flow to the larynx. The observed changes in STA blood flow rate were reproducible across all animals. In our study, the average mean blood velocity of the carotid artery at baseline is 54.5 ± 1.3 cm/s (data not shown) which is comparable with published findings of (47 ± 6 cm/s),26 suggesting that the imaging protocol we used is consistent and repeatable. The reasons for our slightly higher values could be related to biological sex of the animal, and starting body weight.27, 28 Interestingly, restored blood flow after water intake does not necessarily represent a complete functional recovery of vocal fold tissue. Our previous work suggests biological changes of vocal fold following dehydration are not restored to pre-dehydration states.20, 29 Therefore, future work is needed to include a longer recovery time period and compare water versus oral rehydration treatments in supporting rehydration.
In the geometric control group, there were no significant differences observed in STA cross-sectional area after dehydration and rehydration. This could be due to either limited imaging sensitivity to small changes in vessel diameter, or the natural response to maintain hemodynamic stability with vasodilation compensating for any drop in intraluminal pressure. Previous studies have used MRA as a noninvasive method to assess arteries across the body, including the carotid artery,30 the cerebral artery,31 and the renal artery.32 In this study, the TOF-MRA provides a high-resolution anatomical definition of the rodent STA, and the reconstructed 3D laryngeal blood vessels function as guidance for locating the STA during ultrasound imaging. The 3D reconstructed artery geometry is consistent with illustrations from published work.33 Our study is the first to employ TOF-MRA to investigate vascular cross-sectional area noninvasively in larynx in vivo, providing a new high-resolution approach to quantify laryngeal vascular structure.
In the temporal control group, there were no significant differences observed in mean blood velocity of the STA across the timepoints. The results suggest that our ultrasound imaging protocol was stable and consistent in locating the STA across different animals. Previous studies have successfully employed pulsed-wave Doppler ultrasound to measure the carotid artery, internal carotid artery, and subclavian artery blood velocity in rats and human subjects.12, 34-37 These arteries are relatively easy to locate with ultrasound due to their size. However, no studies have reported measuring the STA via ultrasound imaging in vivo before, potentially due to the small size of the vessel. In this study, we were able to detect the STA stably across the whole experimental design by targeting the first branch of external carotid artery. The method can be easily translated to the investigation of other small size blood vessels across different tissues, opening up further avenues to determine blood flow in laryngeal microvasculature for investigation of the effects of dehydration on critical muscle of vocal fold phonation, airway protection, and tissue perfusion.
CONCLUSION
This novel study quantified blood flow in the superior thyroid artery in an in vivo animal model. The combination of ultrasound imaging and MRA is ideal as these modalities can be used to identify the anatomy, geometry, and hemodynamic alterations to laryngeal blood flow. Our results provide evidence that 3-day water withholding impairs blood flow to the larynx in a rat model. These data lay the foundation for further study on of laryngeal vasculature to inform prophylactic recommendations for vocal care.
ACKNOWLEDGEMENTS
We greatly acknowledge the assistance of Greg Tamer, Ph.D. (Purdue University Engineering and Small Animal MRI Facilities), for his guidance on TOF sequence optimization and MRI operation.
FUNDING INFORMATION
The study was funded by National Institutes of Health/National Institute on Deafness and other Communication Disorders (R01DC020179). Jennifer L. Anderson acknowledges the National Science Foundation for support under the Graduate Research Fellowship Program (GRFP) under grant number DGE-1842166. Craig J. Goergen is a paid consultant of FUJIFILM VisualSonics.


