Design of Fexofenadine Prodrugs Based on Tissue-Specific Esterase Activity and Their Dissimilar Recognition by P-Glycoprotein
Abstract
The aim of this study was to develop a suitable prodrug for fexofenadine (FXD), a model parent drug, that is resistant to intestinal esterase but converted to FXD by hepatic esterase. Carboxylesterases (CESs), human carboxylesterase 1 (hCE1) and human carboxylesterase 2 (hCE2), are the major esterases in human liver and intestine, respectively. These two CESs show quite different substrate specificities, and especially, hCE2 poorly hydrolyzes prodrugs with large acyl groups. FXD contains a carboxyl group and is poorly absorbed because of low membrane permeability and efflux by P-glycoprotein (P-gp). Therefore, two potential FXD prodrugs, ethyl-FXD and 2-hydroxyethyl-FXD, were synthesized by substitution of the carboxyl group in FXD. Both derivatives were resistant to intestinal hydrolysis, indicating their absorption as intact prodrugs. Ethyl-FXD was hydrolyzed by hepatic hCE1, but 2-hydroxyethyl-FXD was not. Both derivatives showed high membrane permeability in human P-gp-negative LLC-PK1 cells. In LLC-GA5-COL300 cells overexpressing human P-gp, ethyl-FXD was transported by P-gp, but its efflux was easily saturated. Whereas 2-hydroxyethyl-FXD showed more efficient P-gp-mediated transport than FXD. Although the structure of 2-hydroxyethyl-FXD only differs from ethyl-FXD by substitution of a hydroxyl group, 2-hydroxyethyl-FXD is unsuitable as a prodrug. However, ethyl-FXD is a good candidate prodrug because of good intestinal absorption and hepatic conversion by hCE1. © 2015 Wiley Periodicals, Inc. and the American Pharmacists Association J Pharm Sci 104:3076–3083, 2015
Abbreviations used
-
- AP
-
- apical
-
- BL
-
- basolateral
-
- BNPP
-
- bis-p-nitrophenyl phosphate
-
- CES
-
- carboxylesterase
-
- FXD
-
- fexofenadine
-
- hCE1
-
- human carboxylesterase 1
-
- hCE2
-
- human carboxylesterase 2
-
- HEPES
-
- 4-(2-hydroxyethyl)-1-piperazineethanesulfonic acid
-
- HPLC
-
- high-performance liquid chromatography
-
- P-gp
-
- P-glycoprotein
-
- TFD
-
- terfenadine
INTRODUCTION
Prodrug formation is a useful approach for improving the oral bioavailability of a parent drug with poor intestinal absorption, and in general, a functional group of parent drug is esterified to increase the membrane permeability. In order to obtain a therapeutic effect after oral administration of the prodrug, a high plasma concentration of parent drug is required. Prodrugs are therefore designed to be completely converted to the parent drugs. Such complete conversion is generally obtained by first-pass metabolism before entering into the systemic circulation. However, a parent drug formed by intestinal metabolism is transported into the lumen as well as the mesenteric vein. In addition, the transport rate through the luminal membrane is threefold to fourfold faster than through the basolateral membrane, resulting in low absorption of prodrug.1-3 Therefore, it is desired that the prodrug is resistant to intestinal metabolism, but can be easily converted into the parent drug by a hydrolytic enzyme abundantly expressed in the liver.
Carboxylesterase (CES) is the most abundant esterase in the human body and is the major enzyme catalyzing the hydrolysis of most prodrugs.4, 5 Mammalian CESs are classified into five subfamilies. CES1 and CES2 families are involved in metabolism of prodrugs and xenobiotics. Human CES1 and CES2 isozymes are known as human carboxylesterase 1 (hCE1) and human carboxylesterase 2 (hCE2), respectively. Both hCE1 and hCE2 are present in human liver, but the major hepatic isozyme is hCE1.6, 7 Meanwhile, hCE2 is predominantly expressed in human small intestine. The substrate specificity of hCE2 is significantly different from hCE1.8, 9 hCE1 hydrolyzes most ester compounds, especially prodrugs in which the carboxyl group of the pharmacologically active drug has been modified with a small alcohol group. The majority of prodrugs such as temocapril,8 oseltamivir,10 and mycophenolate mofetil11 are included in this category and are resistant to human intestinal hydrolysis. In contrast, hCE2 hardly hydrolyzes prodrugs with a high affinity for hCE1 and shows limited substrate specificity, that is, hCE2 recognizes prodrugs in which an alcohol group of the pharmacologically active parent drug has been modified with a small acyl group, such as CPT-1112 and aspirin.13 This type of prodrug is also hydrolyzed by hCE1, but at a slower rate than hCE2. It is therefore possible to design a prodrug that is not hydrolyzed by intestinal CES and is converted to parent drug by a hepatic CES isozyme.
In this study, we used fexofenadine (FXD), a nonsedating antihistamine, as a model parent drug and designed an oral prodrug resistant to intestinal hydrolysis. FXD shows approximately 30% and 2% oral bioavailability in human and rat, respectively,14, 15 because of low membrane permeability based on its hydrophilicity and P-glycoprotein (P-gp)-mediated efflux.16, 17 On the contrary, the efflux transport of FXD via P-gp in brain capillaries leads to less severe adverse effects in the central nervous system, such as drowsiness, than other antihistamines. As shown in Figure 1, FXD possesses a carboxylic acid that is able to be esterified with a small alcohol group.
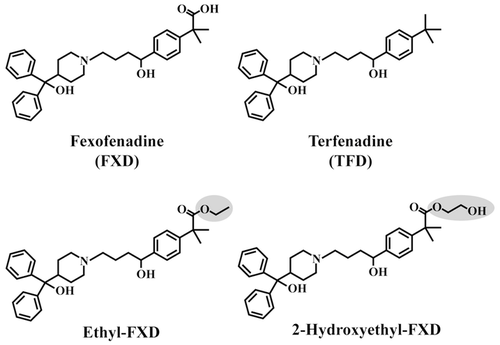
In designing a prodrug of FXD, we used the structure of terfenadine (TFD) as an example. TFD metabolized to FXD by CYP3A4 in the liver was clinically used until drug–drug interaction with macrolide antibiotics and azole antifungals were observed. These drug–drug interactions resulted in the inhibition of CYP3A4 followed by elevation of plasma levels of TFD and the induction of QT prolongation and serious arrhythmia.18, 19 Interestingly, TFD shows almost complete oral bioavailability.20 It has also been reported that TFD is not transported by P-gp in the in situ brain perfusion experiment of P-gp knock-out mice.21 The structures of FXD and TFD differ by one substituent group; FXD has a carboxyl group in place of a methyl group in TFD. It is expected that a FXD prodrug, constructed by modifying a carboxyl group of FXD with a small alcohol group, will show high intestinal absorption with a lack of P-gp-mediated efflux and hydrolysis by hCE2, as well as rapid hepatic conversion to FXD because of its high affinity for hCE1. In this study, we demonstrate the hydrolysis of FXD prodrugs in human small intestine and liver microsomes, and their P-gp-mediated transport using LLC-GA5-COL300 cells overexpressing human P-gp.
MATERIALS AND METHODS
Materials
TFD was obtained from Sigma–Aldrich Company LLC. (St. Louis, Missouri). FXD, 2-hydroxyethyl-FXD, and ethyl-FXD were synthesized according to the procedure reported previously.22 The identity and purity of these chemicals were confirmed by infrared spectroscopy, nuclear magnetic resonance spectroscopy, atomic analysis, and high-performance liquid chromatography (HPLC). Verapamil hydrochloride was purchased from Wako Pure Chemical Industries, Ltd. (Osaka, Japan). [3H]taxol (1.52 GBq/mol) was purchased from Moravek Biochemicals, Inc. (Brea, California). Human liver and small intestine microsomes without protease inhibitors were obtained from BD Gentest (Woburn, Massachusetts) to avoid the lowering of esterase activities. All other chemicals and reagents were of analytical grade.
Establishment of a HEK293 Cells Stably Expressing hCE1 and hCE2
The HEK293 cells were cultured in a humidified incubator at 37°C under 5% CO2 in air, in Dulbecco's modified Eagle's medium (Wako Pure Chemical Industries, Ltd.) consisting of 10% heat-inactivated fetal bovine serum, 100 U/mL penicillin, and 100 μg/mL streptomycin. The HEK293 cells were seeded at a density of 2 × 10⁴ cells/cm2 on a 6-well plate. hCE1 and hCE2 plasmids were a kind gift from Dr. M. Hosokawa (Chiba Institute of Science, Japan). After 24 h of seeding, 1 μg of plasmids (hCE1/pTARGET, hCE2/pTARGET, or pTARGET) were transfected into the cells using TransIT-293 Reagent (Takara Bio Inc., Shiga, Japan). Two days later, cells were plated into a 10-cm dish with medium containing 1 mg/mL of G418 to select the transfected cells. Medium was changed every 3 days for 2–3 weeks until the cell formed a colony. The individual colonies were first transferred to a 24-well plate, then to a 25-cm2 flask, and finally to 75-cm2 flask.
The expression of CESs in HEK293 cells was examined using the 9000g supernatant (S9) fraction of each G418-resistnat colonies. Cells were washed with ice-cold phosphate-buffered saline and then detached. The harvested cells were suspended in ice-cold buffer (292 mM sucrose, 1 mM ethylenediaminetetraacetic acid, and 50 mM Tris) and homogenized using a Polytron homogenizer (Polytron-Aggregate®; Kinematica, Littau, Switzerland) under ice-cold conditions. The homogenates were centrifuged at 9000g for 20 min at 4°C, and the supernatant of S9 fraction was collected. The S9 fraction was stored at −80°C until use. The protein contents of the S9 fraction were determined by the method described by Bradford using bovine serum albumin as standard. The expression of hCE1 and hCE2 was analyzed by Western blot analysis, staining for esterase activity after native polyacrylamide gel electrophoresis and hydrolase activities for p-nitrophenyl derivatives (Fig. S1, Supplementary Information).
Hydrolysis Experiments
The human small intestinal and liver microsomes, and S9 fraction of HEK293 cells expressing human CES isozymes were diluted with 50 mM 4-(2-hydroxyethyl)-1-piperazineethanesulfonic acid (HEPES) buffer (pH 7.4) to an appropriate protein concentrations. After preincubation for 5 min at 37°C, the reaction was started by adding FXD derivatives dissolved in dimethyl sulfoxide (DMSO). Ethyl-FXD (5–30 μM) and 2-hydroxyethyl-FXD (100 μM) were used, according to the solubility of 35 and 120 μM, respectively, in HEPES buffer. For inhibition experiment, the reaction solution with or without bis-p-nitrophenyl phosphate (BNPP) dissolved in DMSO was preincubated for 5 min before starting the reaction. The final concentration of DMSO was maintained at 1.0%, which had no effect on the hydrolase activity. The reaction was terminated by adding an equal volume of ice-cold acetonitrile–methanol, 3:1 (v/v). After centrifugation of the reaction mixture at 1600g for 10 min, the supernatant was analyzed by HPLC.
LLC-PK1 and LLC-GA5-COL300 Cells Culture
LLC-PK1 (porcine kidney epithelial cell line) and LLC-GA5-COL300 cells, a human MDR1-transfected LLC-PK1,23 were purchased from DS Pharma Biomedical Company, Ltd. (Osaka, Japan) and Riken Cell Bank (Ibaraki, Japan), respectively. Both cell lines were grown in a humidified incubator at 37°C under 5% CO2 in air, in medium 199 (Nissui Pharmaceutical Company, Ltd., Tokyo, Japan) consisting of 10% heat-inactivated fetal bovine serum. For the culture of LLC-GA5-COL300 cells, 300 ng/mL of colchicine was added to medium 199 to maintain the expression of P-gp. The culture medium was changed every 2–3 days, and cells were passed every 5–7 days.
Transport Study in LLC-PK1 and LLC-GA5-COL300 Cells
LLC-PK1 and LLC-GA5-COL300 cells were seeded on polycarbonate membranes (3-μm pore size, 24.5-mm diameter; Transwell, Corning Life Sciences, Tewksbury, Massachusetts) at a density of 4 × 10⁵ and 5 × 10⁵ cells/cm2, respectively. The cells were grown for 3 days, and the culture medium was replaced with fresh medium 199 without colchicine 3 and 6 h before the transport experiments.
Each compound dissolved in medium 199 was added to either apical (AP) or basolateral (BL) sides of LLC-PK1 and LLC-GA5-COL300 cell monolayers after preincubation in medium 199 for 20 min. The transporter inhibitors were present in both AP and BL sides for preincubation and throughout the experiment. Samples were sequentially taken from the donor and receiver compartment. The volume removed from the receiver side was always replaced with fresh medium 199, with or without inhibitor. All subsequent procedures were performed at 37°C. The final concentration of solvent DMSO was maintained at 0.5%. For measurement of the concentrations of TFD, FXD and FXD derivatives, samples were mixed with an equal volume of acetonitrile–methanol, 3:1 (v/v). After centrifugation at 1600g for 10 min, the supernatant was analyzed by HPLC. The lack of hydrolysis of ethyl-FXD and 2-hydroxyethyl-FXD in the transport experiment was confirmed by HPLC analysis that showed no FXD, a hydrolysate, in samples from either donor or receiver sides. For [3H]taxol, the radioactivity was counted in 2 mL of aqueous counting scintillant (ACSII) (GE Healthcare, Piscataway, New Jersey) by liquid scintillation counter (Beckman LS 6500; GMI, Albertville, Minnesota).
For measurement of cellular concentrations, cell monolayers were washed twice with medium 199 after the transport experiment, and the cells were harvested by adding 1 mL methanol to the cells, followed by sonication and vortexing. The cell mixture was centrifuged at 1600g for 10 min, and the supernatant was evaporated off. The residue was redissolved in the HPLC mobile phase and analyzed by HPLC.
The apparent permeability coefficients, Papp (cm/s), was calculated using the following equation: Papp = dQ/dt/A/C0, where dQ/dt is the rate of appearance of compound in the receiver compartment (steady-state flux), A is the surface area of the monolayer, and C0 is the initial compound concentration in the donor compartment.
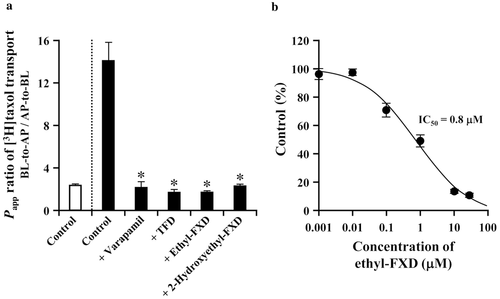
IC50 value for inhibition of P-gp-mediated transport of [3H]taxol was obtained by nonlinear regression analysis of the ethyl-FXD concentration—percentage control curve using the Hill equation with Kaleida Graph (Hulinks, Tokyo, Japan). Percentage control was calculated using the following equation: percentage control = ERI/ER0 × 100, where ERI and ER0 are the efflux ratio (Papp, BL-AP/Papp AP-BL) of [3H]taxol transport in LLC-GA5-COL300 cells in the presence and absence of ethyl-FXD, respectively.
HPLC Analysis
The HPLC system comprised: pump JASCO PU-980; autosampler JASCO AS-950; UV detector UV-2075 Plus; column oven JASCO CO-965 (Jasco International Company Ltd., Tokyo, Japan); and data application apparatus Shimadzu Chromatopac C-R7A plus (Shimadzu Company, Kyoto, Japan). Wakosil-II 5C8 HG column (5 μm, 4.6 × 150 mm2 i.d.; Wako Pure Chemical Industries, Ltd.) was used at a flow rate of 1 mL/min with mobile phase, and FXD, TFD, and FXD derivatives were detected at a wavelength of 218 nm. FXD and ethyl-FXD were eluted at 6 and 19 min, respectively, in acetonitrile–methanol–12 mM ammonium acetate (pH 4.0), 40:10:50 (v/v/v) as a mobile phase. For TFD, a mobile phase of acetonitrile–methanol–12 mM ammonium acetate (pH 4.0), 40:15:45 (v/v/v) was used, with a retention time of 9 min. For 2-hydroxyethyl-FXD, a mobile phase of acetonitrile–methanol–12 mM ammonium acetate (pH 4.0), 22:15:63 (v/v/v) was used, and FXD and 2-hydroxyethyl-FXD were detected at 23 and 27 min, respectively. The temperature of the column was maintained at 40°C. The detection limit for all compounds was 50 nM, and the coefficients of variation for determination of FXD, TFD, ethyl-FXD, and 2-hydroxyethyl-FXD were 1.2%, 1.6%, 1.5%, and 1.5%, respectively.
RESULTS
Design of FXD Prodrugs and Physicochemical Properties of FXD, TFD, and FXD Prodrugs
Table 1 shows the physicochemical characteristics of FXD, TFD, and FXD derivatives. The partition coefficient, log P, of FXD at pH 7.4 was 0.31, nearly identical to the value (log P = 0.49) reported by Lin et al.28 Meanwhile, the log P of TFD was 4.46, which indicates that TFD easily dissolves in the lipid bilayer of the cell membrane. Although the solubility of TFD in phosphate buffer at pH 7.4 is relatively low, TFD shows good bioavailability. In order to increase the hydrophobicity of FXD, esterification of the carboxylic acid of FXD was performed, as shown in Figure 1. Ethyl-FXD showed a log P value of 3.34, that is, relatively large but less than that of TFD (Table 1). The solubility of ethyl-FXD was 2.3-fold higher than that of TFD. We designed 2-hydroxyethyl-FXD to obtain lower hydrophobicity and higher solubility than ethyl-FXD. In fact, 2-hydroxyethyl-FXD showed a log P of 2.45 and solubility of 112 μM. The pKa of both derivatives was 9.0 because of the presence of the piperidino group. In contrast, the hydrogen bond donor, hydrogen bond acceptor, and polar surface area of both derivatives are similar to those of FXD, indicating that the polarities of the derivatives are higher than that of TFD.
| Compound | MW | pKa | log Pa | Solubilityb (μM) | Hydrogen Bond Donor | Hydrogen Bond Acceptor | Polar Surface Areac |
|---|---|---|---|---|---|---|---|
| FXD | 501.7 | 4.3, 9.5d | 0.31 | 294 | 3 | 4 | 85.0 |
| TFD | 471.7 | 10e | 4.46f | 2.9g | 3 | 2 | 44.9 |
| Ethyl-FXD | 529.7 | 9.0c | 3.34 | 6.78 | 3 | 3 | 71.2 |
| 2-Hydroxyethyl-FXD | 545.7 | 9.0c | 2.45 | 112 | 4 | 4 | 91.4 |
- a The partition coefficient (n-octanol/1/15 M phosphate buffer, pH 7.4) was measured by the shake-flask method.
- b The solubility was measured in 1/15 M phosphate buffer (pH 7.4).
- c pKa and polar surface area (pH 7.4) were calculated by ChemAxon Marvin Sketch 5.10.0.
- d Values from Yasui-Furukori et al.24
- e Value from Badwan et al.25
- f The experimental value of log P (n-octanol/PBS, pH 7.4) is cited from Timmerman.26
- g The solubility of TFD in 0.1 M phosphate buffer (pH 7.4) is from Alelyunas et al.27
Hydrolysis of FXD Derivatives in Human Small Intestine and Liver Microsomes, and S9 Fraction of HEK293 Cells Expressing Human CES Isozymes
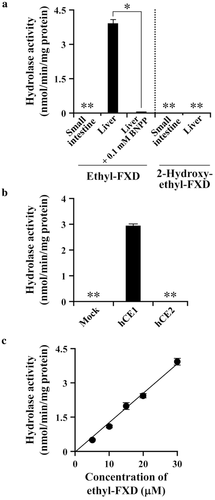
In order to evaluate the first-pass hydrolysis of FXD derivatives, their hydrolase activities were measured in human small intestine and liver microsomes. As shown in Figure 2a, 2-hydroxyethyl-FXD was hardly hydrolyzed in either small intestine or liver microsomes. Meanwhile, as expected, ethyl-FXD was resistant to enzymatic hydrolysis in the intestine and was hydrolyzed in the liver. The hepatic hydrolase activity for ethyl-FXD was almost completely inhibited by BNPP, a CES-specific inhibitor.29-31 In addition, ethyl-FXD was hydrolyzed in S9 fraction of HEK293 cells expressing hCE1 (Fig. 2b). These results suggest that hCE1 is primarily responsible for the hydrolysis of ethyl-FXD in the liver. Over the concentration range of ethyl-FXD (5–30 μM), nonsaturable hydrolase activities for ethyl-FXD were observed in the human liver and S9 fraction of HEK293 cells expressing hCE1 (Fig. 2c; Fig. S2, Supplementary Information). The hepatic intrinsic clearance (CLint) obtained as the slope of linear regression of hydrolase activity versus the concentration of ethyl-FXD was 135 ± 7.58 μL/min per mg protein.
Permeability of FXD, TFD, and FXD Prodrugs Across LLC-PK1 and LLC-GA5-COL 300 Cell Monolayers
The efflux transport of FXD, TFD, and FXD derivatives via human P-gp was evaluated using LLC-PK1 cells and LLC-GA5-COL300 cells overexpressing human P-gp. As shown in Figure S3 (Supplementary Information), the transport of ethyl-FXD and 2-hydroxyethyl-FXD was faster than that of FXD and TFD. The Papp values calculated from the liner flux of the transport and cellular accumulation are shown in Table 2 and Figure 3, respectively. Each tested compound showed almost the same Papp values in the AP-to-BL and BL-to-AP directions of transport across LLC-PK1 cell monolayers. The Papp values of TFD in LLC-PK1 cell were approximately 100 × 10−7 cm/s that was sixfold to 10-fold greater than those of FXD, indicating the higher membrane permeability of TFD than FXD. Interestingly, the Papp values of ethyl-FXD and 2-hydroxyethyl-FXD in LLC-PK1 cells were 15- to 27-fold greater than FXD and were twofold to threefold greater than TFD, although log P value of FXD derivatives was smaller than that of TFD. The cellular accumulation of FXD was quite low in LLC-PK1 cells compared with other three compounds, and the high cellular accumulation was observed in the order of TFD, ethyl-FXD, and 2-hydroxyethyl-FXD. The great cellular accumulation of TFD might be a reason for its slower permeability than FXD derivatives.
| Compound | LLC-PK1 | LLC-GA5-COL300 | ||||
|---|---|---|---|---|---|---|
| Papp (×10−7 cm/s) | Efflux | Papp (×10−7 cm/s) | Efflux | |||
| AP-to-BL | BL-to-AP | Ratio | AP-to-BL | BL-to-AP | Ratio | |
| FXD | 14.8 ± 1.8 | 9.51 ± 0.64 | 0.64 | 10.9 ± 1.4 | 53.1 ± 5.4* | 4.87 |
| TFD | 93.7 ± 0.8 | 99.5 ± 4.6 | 1.06 | 101 ± 6 | 103 ± 4 | 1.09 |
| Ethyl-FXD | 229 ± 11 | 261 ± 1 | 1.14 | 238 ± 3 | 368 ± 21* | 1.54 |
| 2-Hydroxyethyl-FXD | 283 ± 5 | 173 ± 6 | 0.61 | 58.5 ± 4.0 | 576 ± 9* | 9.85 |
- Each compound (30 μM) was applied on the donor side. Values are means ± SD (n = 3).
- *(p < 0.05) indicates statistically significant differences compared with AP-to-BL transport. The efflux ratio is the ratio of BL-to-AP permeability to AP-to-BL permeability.
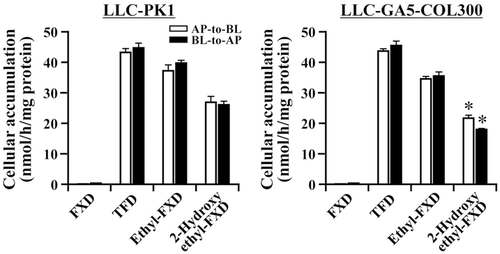
In LLC-GA5-COL300 cells, the Papp ratio of BL-to-AP transport to AP-to-BL transport for FXD was comparatively large (efflux ratio: 4.87, see Table 2), whereas that for TFD was almost the same as in LLC-PK1 cells, indicating that TFD is a poor substrate for human P-gp. Similar properties were predicted for ethyl-FXD as the efflux ratio of ethyl-FXD was 1.54 in LLC-GA5-COL300 cells. On the contrary, the efflux ratio of 2-hydroxyethyl-FXD in LLC-GA5-COL300 cells was markedly higher than that of FXD, and its cellular accumulation was decreased in LLC-GA5-COL300 cells compared with LLC-PK1 cells (Fig. 3).
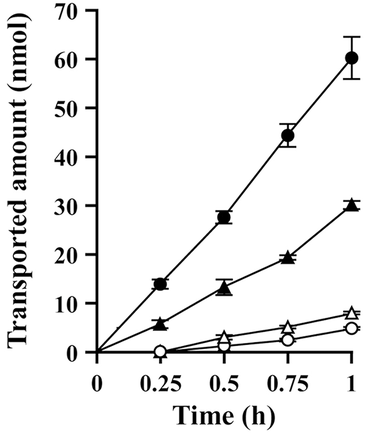
In order to confirm the P-gp-mediated transport of 2-hydroxyethyl-FXD in LLC-GA5-COL 300 cells, verapamil, a competitive inhibitor of P-gp,32 was added to the system. As shown in Figure 4, the permeability of 2-hydroxyethyl-FXD in the BL-to-AP transport was reduced in the presence of verapamil, whereas in the AP-to-BL direction transport was enhanced. These results indicate that 2-hydroxyethyl-FXD is superior to FXD as a substrate for P-gp.
Effect of Ethyl-FXD on the Transport of [3H]taxol by P-gp
Ethyl-FXD and TFD were poorly transported by P-gp, but they may interact with P-gp because the structures of both compounds are similar to 2-hydroxyethyl-FXD. In fact, it has been reported that TFD inhibits the P-gp activity.33-35 The transport of taxol, a good substrate for P-gp, across LLC-GA5-COL300 cell monolayers was therefore evaluated in the absence and presence of ethyl-FXD. Results are shown in Figure 5a. The efflux ratio of control in LLC-GA5-COL300 cells was approximately sixfold higher than that in LLC-PK1 cells. The efflux ratio in LLC-GA5-COL300 cells was decreased in the presence of verapamil, TFD, and 2-hydroxyethyl-FXD to a level comparable to control in LLC-PK1 cells. Treatment with 30 μM of ethyl-FXD also showed complete inhibition of the P-gp-mediated transport of taxol. As shown in Figure 5b, IC50 value of ethyl-FXD for taxol transport in LLC-GA5-COL300 cells was 0.8 μM, indicating ethyl-FXD is a potent inhibitor of P-gp. In order to examine the possibility of P-gp-mediated transport of ethyl-FXD, the permeability of ethyl-FXD in LLC-GA5-COL300 cells was evaluated at almost the same concentration as IC50 value. As shown in Table 3, in the transport of ethyl-FXD at 1 μM, the concentration of ethyl-FXD on the receiver compartment was fourfold higher in BL-to-AP direction than in AP-to-BL direction, suggesting that ethyl-FXD is a substrate for P-gp. However, the ratio of ethyl-FXD transport (BL-to-AP direction/AP-to-BL direction) at 1 μM was small in comparison with the efflux ratio of FXD and 2-hydroxyethyl-FXD at 30 μM (see Table 2). Furthermore, the P-gp-mediated transport of ethyl-FXD was dose-dependently saturated, and it disappeared under treatment of 30 μM. These data demonstrate that ethyl-FXD is the weakest P-gp substrate among FXD and its derivatives, and it works as a potent competitive inhibitor.
| Applied Concentration of Ethyl-FXD | |||
|---|---|---|---|
| 1 μM | 10 μM | 30 μM | |
| AP-to-BL | 0.0791 ± 0.0112 | 0.455 ± 0.019 | 2.30 ± 0.03 |
| BL-to-AP | 0.309 ± 0.006* | 1.43 ± 0.01* | 3.90 ± 0.67 |
| BL-to-AP/AP-to-BL ratio | 3.90 | 3.13 | 1.69 |
- After transport of ethyl-FXD (1–30 μM) across LLC-GA5-COL300 cell monolayers for 60 min, concentration of ethyl-FXD on the receiver side was measured. * indicates p < 0.05 in comparison with the concentration in the AP-to-BL transport. Values represent the mean ± SD (n = 3).
DISCUSSION
Differences in the tissue distribution and substrate recognition of CES isozymes allow the design of prodrugs with controlled first-pass metabolism. In this study, a prodrug converted to FXD by first-pass hydrolysis in liver but not in small intestine was designed based on the structure of TFD. In order to prevent hydrolysis by intestinal CES isozyme, the carboxyl group of FXD was substituted by ethanol and 2-hydroxyethanol (Fig. 1), resulting in the conversion of an amphoteric ion compound to a basic compound. On some occasions, a basic compound shows a high affinity for CES. For example, loperamide, a basic compound with a pKa value of 8.6, strongly inhibits hCE2 activity, although it does not contain an ester linkage.36 However, ethyl-FXD and 2-hydroxyethyl-FXD were hardly hydrolyzed by intestinal hCE2 (Fig. 2). In the liver, hCE1 hydrolyzed ethyl-FXD, but not 2-hydroxyethyl-FXD. The terminal hydroxyl group of 2-hydroxyethyl-FXD may affect substrate recognition by hCE1.
The hydrophobicity of ethyl-FXD and 2-hydroxyethyl-FXD approximated that of TFD. The log P values of ethyl-FXD (3.34) and 2-hydroxyethyl-FXD (2.45) were increased compared with FXD and within the range of log P values (1–4; Table 1), which has been recommended by Waring37 and Gleeson,38 when taking into account properties such as solubility, membrane permeability, distribution, and metabolism. However, the molecular weight (MW) of both derivatives is greater than 500, implying the possibility that their membrane permeability is low because of slow diffusion. Therefore, the membrane transport properties of the two derivatives were compared with FXD and TFD. In general, Caco-2 cells, a human colon adenocarcinoma cell line, are used for intestinal absorption assay of drugs. However, we have reported that Caco-2 cells mainly express hCE1 rather than hCE2, suggesting that the permeability of a hCE1 substrate in Caco-2 cells will hardly reflect human intestinal permeability.39 In this study, LLC-PK1 and LLC-GA5-COL300 cells transfecting human MDR1 cDNA were used, as ethyl-FXD and 2-hydroxyethyl-FXD are not hydrolyzed in either cell line. LLC-PK1 cells form polarized monolayers with apical microvilli and tight junctions, and the passive permeability of drugs in LLC-PK1 cell monolayers is associated with log P values, which is similar to Caco-2 cell monolayers.40 The membrane permeabilities of ethyl-FXD and 2-hydroxyethyl-FXD were greater than that of FXD in LLC-PK1 cell monolayers because of their hydrophobicity (Table 2). Interestingly, the Papp values of FXD derivatives were higher than TFD in spite of lower log P values and larger MWs, because of the strong retention of TFD in LLC-PK1 cells (Fig. 3).
In the transport across LLC-GA5-COL300 cell monolayers, FXD was efficiently effluxed by human P-gp, whereas TFD was not (Table 2). Our results for TFD are similar to those of a previous study using mdr1a/b knock-out mice.21 Therefore, it was expected that FXD derivatives would be poorly transported by P-gp. Ethyl-FXD was weakly transported by P-gp in LLC-GA5-COL300 cells. However, 2-hydroxyethyl-FXD was transported to a greater extent by P-gp than FXD. It has been reported that modulators of P-gp are mostly hydrophobic and positively charged molecules.41-43 These characteristics are more similar to the physicochemical properties of TFD and ethyl-FXD than FXD and 2-hydroxyethyl-FXD. Indeed, TFD is a potent inhibitor for P-gp,33-35 for example, it has shown IC50 value of 1.4 μM for calcein accumulation in L-MDR1 cells. Ethyl-FXD also worked as an inhibitor (IC50 value: 0.8 μM) rather than substrate for P-gp, whereas 2-hydroxyethyl-FXD was a strong P-gp substrate. These results propose that the terminal hydroxyl group of 2-hydroxyethyl-FXD is an important factor in determining substrate specificity for P-gp.
We therefore calculated the most stable conformations of FXD, TFD, and FXD derivatives. As shown in Figure S4 (Supplementary Information), only TFD showed a different structure from other three compounds. Although we have been unable to explain the exact inhibition mechanism for P-gp function by TFD, it may act partially as a noncompetitive inhibitor because TFD inhibits the ATPase activity of P-gp.44 On the contrary, the stable conformation of ethyl-FXD is basically similar to FXD. Thus, ethyl-FXD may be similarly recognized by P-gp to FXD, but the rapid uptake of ethyl-FXD into LLC-GA5-COL300 cells leads to its high cellular concentration, resulting in the saturation of P-gp-mediated transport and the strong competitive inhibitory effect. The structure of 2-hydroethyl-FXD also resembles that of ethyl-FXD. However, the terminal hydroxyl group of 2-hydroxyethyl-FXD is positioned outward because of the formation of hydrogen bond with oxygen atom of carbonyl group, which might alter the recognition by P-gp. Furthermore, this position of terminal hydroxyl group of 2-hydroxyethyl-FXD may affect the recognition by hCE1, that is, this conformation may interfere with the binding of Ser residue in the active site of hCE1 to carbonyl carbon of substrate.
Consequently, 2-hydroxyethyl-FXD is unsuitable as a prodrug because it is a good substrate for P-gp and does not undergo hepatic conversion to an active metabolite. On the contrary, because ethyl-FXD is almost passively permeated in the intestine because of its weak P-gp-mediated efflux, and is hydrolyzed in the liver, it may be a good candidate as a prodrug. The CLint of ethyl-FXD in human liver microsomes (135 ± 7.58 μL/min per mg protein; see Fig. 2) was faster than the hepatic CLint of TFD, which has been reported to be 20–50 μL/min per mg protein.45-47 In some studies, TFD was not detected in human plasma after oral administration of TFD,48-50 indicating that TFD was almost completely metabolized by the first-pass effect. In addition, we have measured the hepatic CLint for hydrolysis of temocapril and oseltamivir, that have been clinically used as a prodrug resistant to intestinal hydrolysis and converted by hepatic hCE1, using the same human liver microsomes; respective CLint was approximately 630 μL/min per mg protein39 and 60 μL/min per mg protein (preliminary data). Therefore, it is expected that ethyl-FXD is sufficiently converted to FXD in the liver, and high plasma level of FXD is obtained for a therapeutic effect. In a previous study, we orally administered ethyl-FXD to rats, but its bioavailability was increased only threefold because of the intestinal hydrolysis of ethyl-FXD followed by efflux of FXD into the intestinal lumen.15 However, because ethyl-FXD is not hydrolyzed in the human intestine, ethyl-FXD may succeed as a prodrug in man.
In the present study, it has been demonstrated that a prodrug, absorbed as an intact ester in the intestine and converted to a parent drug in the liver, can be designed on the basis of the specific activity and tissue distribution of CES isozymes. These findings will be helpful in the optimization of prodrug design.
ACKNOWLEDGMENT
We thank Dr. M. Hosokawa (Chiba Institute of Science, Japan) for his kind gift of CES plasmids and anti-CES antibodies.


