In Situ Perfusion Model in Rat Colon for Drug Absorption Studies: Comparison with Small Intestine and Caco-2 Cell Model
Abstract
Our aim is to develop and to validate the in situ closed loop perfusion method in rat colon and to compare with small intestine and Caco-2 cell models. Correlations with human oral fraction absorbed (Fa) and human colon fraction absorbed (Fa_colon) were developed to check the applicability of the rat colon model for controlled release (CR) drug screening. Sixteen model drugs were selected and their permeabilities assessed in rat small intestine and colon, and in Caco-2 monolayers. Correlations between colon/intestine/Caco-2 permeabilities versus human Fa and human Fa_colon have been explored to check model predictability and to apply a BCS approach in order to propose a cut off value for CR screening. Rat intestine perfusion with Doluisio's method and single-pass technique provided a similar range of permeabilities demonstrating the possibility of combining data from different laboratories. Rat colon permeability was well correlated with Caco-2 cell-4 days model reflecting a higher paracellular permeability. Rat colon permeabilities were also higher than human colon ones. In spite of the magnitude differences, a good sigmoidal relationship has been shown between rat colon permeabilities and human colon fractions absorbed, indicating that rat colon perfusion can be used for compound classification and screening of CR candidates. © 2015 Wiley Periodicals, Inc. and the American Pharmacists Association J Pharm Sci 104:3136–3145, 2015
INTRODUCTION
The small intestine is the main site of absorption, because of its anatomical, physiological, physicochemical environment, and biopharmaceutical features.1 Traditionally, the colon has been considered less important than the small intestine for drug absorption. Anatomically, colon is shorter and wider than small intestine; colonic lumen has no extra surface area provided by villi; moreover, epithelial cell layer junctions are tighter in colon than in small intestine. So, the available surface for drug absorption in colon is smaller and morphologically less well equipped than that of the small intestine.1-4 Differences also affect the expression of efflux and uptake transporters. Intestinal drug transporters are predominant in the jejunum and ileum5, 6 and, according to Drozdzik et al.7 the transporter protein abundance was similar in the jejunum and ileum but markedly different in the colon. In fact the major transporter protein in the small intestine (around 50%) was the uptake carrier PEPT1, and in the colon, the major transporter was the basolateral efflux carrier ABCC3.8 In addition, the gastrointestinal tract is populated with a large number of bacteria and most of them reside in the large intestine; the stability of a drug to the microbiota is clinically relevant; the metabolism can transform a drug in pharmacologically active, inactive, or toxic. Many drugs are substrates for colonic bacteria, which could result in degradation and influence their bioavailability.9, 10 These arguments also support that the permeability and the absorptive capacity for drugs of the colonic membrane are considered lower than the small intestine. However, this is not always so simple. Distal regions of intestine, including the colon, can significantly contribute to the overall absorption as well. Several studies have demonstrated that some drugs show fairly high permeability in colon.11-14
Colon has one main advantage for absorption: the transit time of drugs. The colonic transit time is longer than 24 h, whereas the small intestinal transit time is shorter about 2–5 h.15, 16 Thus, colonic absorption can be beneficial to ensure the performance of oral controlled release (CR) products. As CR formulations are designed to release the drug during 12–24 h, it is obvious that drug absorption in colon is a prerequisite for oral CR development.3, 13 Despite the fact that there are various in vitro and in situ models to predict the absorption and permeability in small intestine, there is less knowledge regarding the large intestine.1, 17 There is a need for exploratory in vivo studies to clarify regional drug absorption along the intestine, and especially from the colon in order to validate animal or in vitro biopharmaceutical colon models as these models would have a clear impact for the study of oral CR formulations.4
It is well known that oral drug absorption is defined mainly by two parameters: solubility and permeability. These parameters are the basis for the Biopharmaceutics Classification System (BCS) for immediate-release (IR) products developed by Amidon et al.18 The premise of BCS is that the rate and extent of drug absorption depends on the solubility and permeability of the drug. The applicability of BCS for CR formulations and colonic absorption has been discussed.19-21 Some authors have remarked that to extend the BCS model to the CR formulations with a simple measure of permeability is not adequate,21 but on the contrary, Tannergren et al.1 demonstrated that compounds with high permeability had good absorption in colon, whereas low permeability drugs presented unfavorable colon absorption, that is, permeability data could be used for early assessment of the colonic absorption potential during CR development.
The first purpose of this work is to develop and to validate the technique of in situ perfusion in rat colon based on Doluisio's method and to correlate the colon permeability values with permeability data obtained in small intestine to characterize the segmental differences in the rat model. Moreover, in order to obtain a simpler model for screening drug absorbability in colon, the second objective is to compare the animal model with an in vitro model based on Caco-2 monolayers. For those purposes, 16 model drugs with different permeability characteristics have been selected and the permeability has been assessed in both segments of the rat gastrointestinal tract: small intestine and colon, and in Caco-2 monolayers. Small intestine/colon and in situ/in vitro correlations and the comparison with literature in vivo data will be used to apply a BCS approach to colon absorption in order to propose a cut off value for screening during CR product development.
MATERIALS AND METHODS
Antipyrine, caffeine, carbamazepine, metoprolol, naproxen, theophylline, verapamil, amoxicillin, atenolol, cimetidine, codeine, colchicine, furosemide, ranitidine, terbutaline, and valsartan were purchased from Sigma–Aldrich. Methanol, acetonitrile, and water were HPLC grade. All other chemicals were of analytical reagent grade.
Table 1 summarizes the contribution of transporters that can affect the permeability of the test compounds and some physicochemical properties.1, 6, 22-42 In this work, a high concentration of drugs (500 μM) was used to ensure saturating conditions in order to get the diffusional component of the transport and a negligible contribution of the transporters.
| Efflux Transporters | Uptake Transporters | Physicochemical Properties | ||||||||
|---|---|---|---|---|---|---|---|---|---|---|
| DRUG | CYP 3A4 | P-gp | MRP | BCRP | OATP | PEPT1 | OCT | MW | log P | pKa |
| Antipyrine22 | X | 188.2 | 0.38 | 1.50a | ||||||
| Caffeine23, 24 | x | 212.2 | −0.07 | 10.4b | ||||||
| Carbamazepine25, 26 | 236.3 | 2.45 | 13.9b | |||||||
| Metoprolol27 | 267.4 | 1.88 | 9.70b | |||||||
| Naproxen28 | x | 230.3 | 3.18 | 4.15a | ||||||
| Theophylline1 | 180.2 | −0.02 | 8.81b | |||||||
| Verapamil6, 28-30 | X | x | x | x | x | x | x | 491.1 | 3.79 | 8.92b |
| Amoxicillin1, 6 | x | x | 365.4 | 0.87 | 2.40a | |||||
| Atenolol1, 6, 31 | x | x | 266.3 | 0.16 | 9.60b | |||||
| Cimetidine1, 32-34 | x | x | x | 252.3 | 0.40 | 6.80b | ||||
| Codeine35, 36 | X | x | 299.4 | 1.19 | 8.21b | |||||
| Colchicine6, 37 | X | x | x | 399.4 | 1.30 | 1.85a | ||||
| Furosemide6, 38, 39 | x | x | x | 330.7 | 2.03 | 3.80a | ||||
| Ranitidine1, 6 | x | x | 314.4 | 0.27 | 8.20b | |||||
| Terbutaline40 | x | 274.3 | 0.90 | 8.80b | ||||||
| Valsartan18, 41, 42 | x | x | 435.5 | 3.65 | 4.90a | |||||
- a Acid drugs.
- b Basic drugs.
- CYP 3A4, cytochrome P450; P-gp, P-glycoprotein; MRP, multidrug-resistance-associated protein; BCRP, breast cancer-resistance protein; OATP, organic anion transporting polypeptide; PEPT1, peptide transporter protein; OCT, organic cation transporter; MW, molecular weight (g/mol).
Absorption Studies
Male Wistar rats were used in accordance with 2010/63/EU directive of September 22, 2010 regarding the protection of animals used for scientific experimentation. The Ethics Committee for Animal Experimentation of the University of Valencia approved the experimental protocols (Spain, code A1330354541263).
The absorption rate coefficient and the permeability value in the whole small intestine of each compound were evaluated by in situ “close loop” perfusion method based on Doluisio's Technique.43 Male Wistar rats (body weight, 250–300 g) fasted 4 h and with free access to water were used for these studies. Rats were anesthetized using a mixture of pentobarbital (40 mg/kg) and butorphanol (0.5 mg/kg). A midline abdominal incision was made. The intestinal segment was manipulated in order to minimize any intestinal blood supply disturbances. The bile duct was always tied up in order to avoid drug enterohepatic circulation and the presence of bile salts in lumen. The perfusion technique consists of creating an isolated compartment in the intestinal segment of interest, with the aid of two syringes and two three-way stopcock valves. Two incisions were performed in the intestine, the first one at the beginning of the duodenal portion and the second one at the end of the ileum portion just before the cecum sac. Surgical ligature to a catheter was placed at the duodenal incision. In order to remove all intestinal contents, the small intestine was copiously flushed with a physiologic solution: isotonic saline (pH 6.9) with 1% Sörensen phosphate buffer (v/v), 37°C. After that, the end of the segment was tied up and connected to a second catheter. Both catheters were connected to a glass syringe using a stopcock three-way valve. The intestinal segment was carefully placed back into the peritoneal cavity and the abdomen was covered with a cotton wool pad avoiding peritoneal liquid evaporation and heat losses. Once this system is set up, the intestinal segment is an isolated compartment where the drug solution (10 mL) can be introduced and sampled with the aid of the syringes and stopcock valves. The samples were collected every 5 min up to a period of 30 min.
The absorption rate coefficient and the permeability value in the colon were evaluated with a similar technique to that used for the whole small intestine.3 The colon was flushed with a physiologic solution: isotonic saline (pH 7.5) with 1% Sörensen phosphate buffer (v/v), 37°C. The drug solution (5 mL) was introduced in the isolated compartment and it was sampled at fixed times.
Drug solutions for experiments in colon and intestine were prepared in isotonic saline buffered with Sörensen phosphate buffer (pH 7.0). For furosemide and valsartan, 1% DMSO (dimethyl sulfoxide) was used to achieve complete dissolution of these compounds.
At the end of the experiments, the animals were euthanized. In order to separate solid components (mucus, intestinal contents) from the samples, they were centrifuged for 5 min at 2991 g. All samples were analyzed by HPLC.
The absorption rate coefficient (Ka) and permeability values (Papp) for 16 drugs were determined in two segments of gastrointestinal tract: entire small intestine and colon (n = 5–7). The perfusion solution of each drug was prepared at 500 μM. After dissolving the drugs, the pH of the solution was readjusted to 7.0.
 (1)
(1) (2)
(2) (3)
(3) (4)
(4)Estimation was carried out using a 10-mL perfusion volume and an intestinal length of 100 cm for the whole small intestine, and a 5-mL perfusion volume and a length of 10 cm for the colon. The effective radius of the intestinal segment was fixed at a value of 0.1784 cm for small intestine and 0.3989 cm for colon.
The relationship between absorption rate coefficient and permeability value has been described in detail in Supporting Information.
Cell Culture and Transport Studies
Caco-2 cells were grown in Dubelcco's modified Eagle's media containing l-glutamine, fetal bovine serum, and penicillin–streptomycin. Cell monolayers were prepared by seeding 250,000 cells/cm2 on the polycarbonate membrane whose surface of the insert placed in each well. They were maintained at 37°C temperature, 90% humidity, and 5% CO2 for 4 days until confluence. Afterwards, the integrity of the each cell monolayer was evaluated by measuring the transepithelial electrical resistance (TEER). Hank's balanced salt solution supplemented with HEPES was used to fill the receiver chamber and to prepare the drug solution that was placed in the donor chamber.
Transport studies were conducted in an orbital environmental shaker at constant temperature (37°C) and agitation rate (50 rpm). Four samples were taken from the receiver side at prefixed sample times 15, 30, 45, and 90 min. Samples of the donor side were taken at the beginning and at the end of the experiment. The amount of compound in cell membranes and inside the cells was determined at the end of experiments in order to check the mass balance and the percentage of compound retained in the cell compartment as always less than 5%.
Drug transport studies were performed from apical-to-basal (A-to-B) direction using the same concentration that in the in situ assays (500 μM). The TEER values were measured before and after the transport experiments and were always between 800 and 1100 ohmios/cm2, which ensure the integrity of the cell monolayer at assayed concentrations (500 μM).
 (5)
(5)The nonlinear regression to fit the equation to data was performed in Excel® using Solver tool for minimization of the Sum of Squared Residuals.
HPLC Analysis
All the samples were analyzed using a Perkin-Elmer HPLC with an UV detector or with a fluorescence detector depending on the characteristics of each drug. The standard calibration curves were prepared by dilution from the drug solution assayed. Sample concentrations were within the linear range of quantitation for all the assays. Analytical methods were validated for each compound in terms of specificity, selectivity, linearity, precision, and accuracy. All the compounds were analyzed with a flow rate of 1 mL/min and at room temperature. μBondapak 150 × 4.6 mm2 C-18 column (5 μm particle size) was used for antipyrine, caffeine, carbamazepine, naproxen, verapamil, amoxicillin, furosemide, ranitidine, and terbutaline; and a μBondapak 250 × 4.6 mm2 C-18 column (5 μm particle size) was required for metoprolol, colchicine, valsartan, atenolol, theophylline, codeine, and cimetidine. An injection volume of 10 μL was used for the compounds analyzed with fluorescence detection, and 20 μL for the drugs analyzed with UV detection. Analytical details are presented in Table S1 of Supporting Information file.46
Data Analysis
Permeabilities determined in each intestinal region were compared using Student's t-test to detect the existence of significant differences at the 0.05 probability level. The statistical comparison was made using the statistical package SPSS, V.20.
 (6)
(6) (7)
(7)Additionally, a simultaneous fit of both equation to data from Caco-2 cells (21 days model) and rat colon and intestine permeability was performed, keeping a shared T parameter and including a surface factor correction factor, S, in the exponent of Eq. 7, to account for the surface difference between the monolayer model and the intestine and colon (because of villi and folds).
RESULTS
Table 2 summarizes the apparent first-order absorption rate coefficients (Ka, h−1) and apparent permeability values (Papp, 10−4 cm/s) of the 16 drugs in whole small intestine and colon.
| Small Intestine | Colon | |||||||
|---|---|---|---|---|---|---|---|---|
| Drugs | Ka | SD | Papp | SD | Ka | SD | Papp | SD |
| Naproxen | 7.434 | 0.492 | 1.841 | 0.116 | 3.016 | 0.227 | 1.673 | 0.123 |
| Carbamazepine | 5.164 | 0.510 | 1.279 | 0.120 | 2.575 | 0.425 | 1.424 | 0.230 |
| Verapamil | 4.304 | 0.470 | 1.056 | 0.101 | 2.221 | 0.556 | 1.230 | 0.308 |
| Caffeine | 4.221 | 0.790 | 1.046 | 0.186 | 1.565 | 0.363 | 0.870 | 0.196 |
| Antipyrine | 4.094 | 0.435 | 1.014 | 0.108 | 1.527 | 0.155 | 0.848 | 0.086 |
| Theophylline | 3.983 | 0.254 | 0.986 | 0.067 | 1.907 | 0.150 | 1.058 | 0.081 |
| Metoprolol | 2.518 | 0.239 | 0.624 | 0.273 | 1.505 | 0.344 | 0.814 | 0.187 |
| Codeine | 2.200 | 0.090 | 0.545 | 0.023 | 1.053 | 0.165 | 0.583 | 0.091 |
| Furosemide | 1.265 | 0.242 | 0.313 | 0.057 | 0.401 | 0.127 | 0.222 | 0.069 |
| Cimetidine | 1.211 | 0.229 | 0.299 | 0.057 | 0.639 | 0.146 | 0.346 | 0.078 |
| Valsartan | 1.050 | 0.087 | 0.262 | 0.022 | 0.606 | 0.115 | 0.328 | 0.062 |
| Colchicine | 1.010 | 0.158 | 0.250 | 0.039 | 0.591 | 0.157 | 0.320 | 0.085 |
| Amoxicillin | 0.708 | 0.172 | 0.167 | 0.041 | 0.553 | 0.095 | 0.299 | 0.051 |
| Terbutaline | 0.672 | 0.114 | 0.159 | 0.027 | 0.650 | 0.132 | 0.352 | 0.071 |
| Ranitidine | 0.573 | 0.136 | 0.135 | 0.032 | 0.546 | 0.135 | 0.295 | 0.073 |
| Atenolol | 0.430 | 0.096 | 0.107 | 0.024 | 0.390 | 0.079 | 0.211 | 0.043 |
- Values represent mean ± SD of five to seven rats for each drug and region.
Figure 1 shows a comparative graphic of Papp values in small intestine and colon of each assayed drug. A good linear correlation was established between rat colon and intestinal permeability with R2 = 0.94 (see Fig. S1 in Supporting Information).
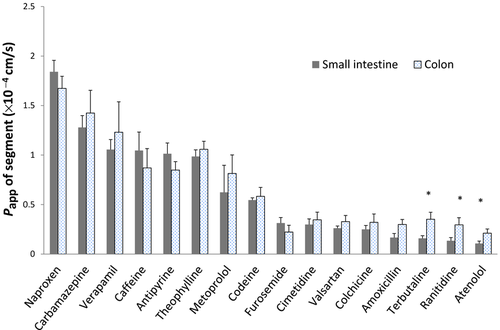
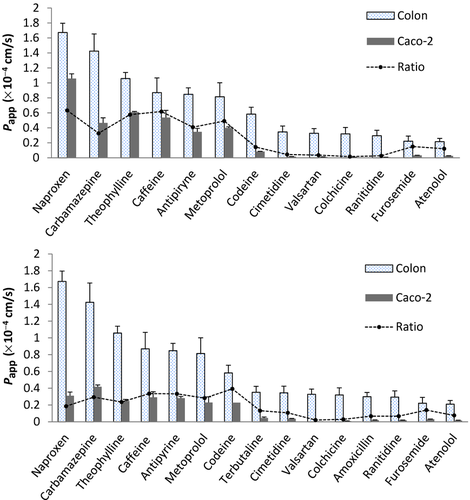
Figure 2 shows a comparative graphic of Papp values in colon and Caco-2 cells; 4 days (top panel) and 21 days (bottom panel), respectively, of each assayed drug. Papp Caco-2 data of theophylline, metoprolol, furosemide, and atenolol (4 days) and codeine and valsartan (21 days) were obtained from literature.32, 47 Data are summarized in Table 3.
| Papp Caco-2 (×10−4 cm/s) | ||||||||
|---|---|---|---|---|---|---|---|---|
| 4 Days Model | 21 Days Model | |||||||
| Drug | Papp Colon (×10−4 cm/s) | SD | Papp | SD | Ratio | Papp | SD | Ratio |
| Naproxen | 1.673 | 0.123 | 1.058 | 0.063 | 0.632 | 0.311 | 0.043 | 0.186 |
| Carbamazepine | 1.424 | 0.230 | 0.466 | 0.067 | 0.328 | 0.418 | 0.021 | 0.294 |
| Theophylline | 1.058 | 0.081 | 0.610 | 0.009 | 0.576 | 0.249 | 0.018 | 0.236 |
| Caffeine | 0.870 | 0.196 | 0.537 | 0.096 | 0.618 | 0.292 | 0.066 | 0.336 |
| Antipiryne | 0.848 | 0.086 | 0.347 | 0.047 | 0.409 | 0.282 | 0.019 | 0.333 |
| Metoprolol | 0.814 | 0.187 | 0.400 | 0.014 | 0.491 | 0.230 | 0.067 | 0.283 |
| Codeine | 0.583 | 0.091 | 0.084 | 0.003 | 0.143 | 0.229 | 0.393 | |
| Terbutaline | 0.352 | 0.071 | 0.047 | 0.010 | 0.132 | |||
| Cimetidine | 0.346 | 0.078 | 0.015 | 0.002 | 0.045 | 0.037 | 0.003 | 0.107 |
| Valsartan | 0.328 | 0.062 | 0.012 | 0.002 | 0.036 | 0.007 | 0.021 | |
| Colchicine | 0.320 | 0.085 | 0.005 | 0.001 | 0.016 | 0.009 | 0.002 | 0.029 |
| Amoxicillin | 0.299 | 0.051 | 0.020 | 0.003 | 0.067 | |||
| Ranitidine | 0.295 | 0.073 | 0.008 | 0.001 | 0.027 | 0.020 | 0.001 | 0.067 |
| Furosemide | 0.222 | 0.069 | 0.033 | 0.001 | 0.150 | 0.031 | 0.002 | 0.140 |
| Atenolol | 0.216 | 0.043 | 0.026 | 0.002 | 0.121 | 0.016 | 0.003 | 0.076 |
Figure 3 shows in the top panel the correlation obtained between in situ (colon of the rat) and in vitro (Caco-2) models, whereas the bottom panel displays the correlation among the permebility values of antipyrine, metoprolol, atenolol, and ranitidine obtained in rat colon and permeabiliy values obatined in human colonic tissue with Ussing chamber.48, 49
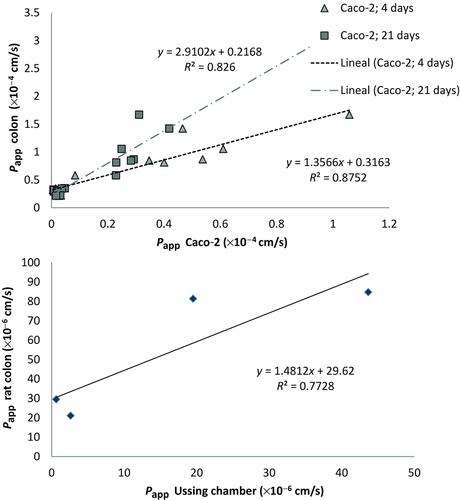
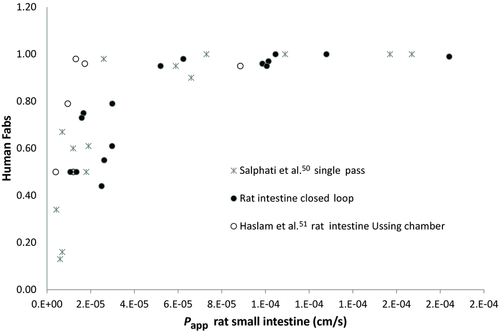
Figure 4 displays the rat intestinal permeability obtained with our closed loop method versus human oral fraction absorbed. Data obtained in rat small intestine with single-pass perfusion method by Salphati et al.50 and in rat intestine with Ussing chambers51 are represented in Figure 4 to explore the similarity of data from different laboratories and experimental techniques. The human fractions absorbed were obtained from literature.32, 52-54
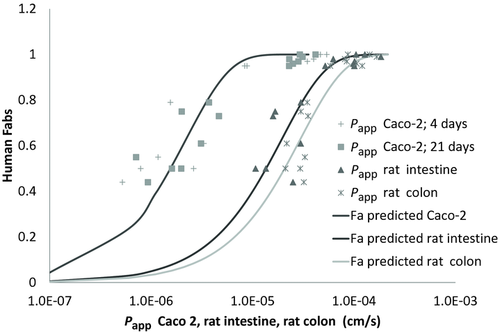
In Figure 5, a simultaneous fit of fraction absorbed versus permeability in Caco-2 model (21 days and 4 days) rat small intestine and colon is represented to show the shift of the curves because of the differences in surface area for transport in cell system versus the in situ models.
Fraction absorbed in human colon48 were included in Figure 6 to explore the predictability of rat colon permeability to classify compounds in high/low colon absorbability. A previous correlation of Human colon Papp and human colon Fa is overlapped for comparison.47
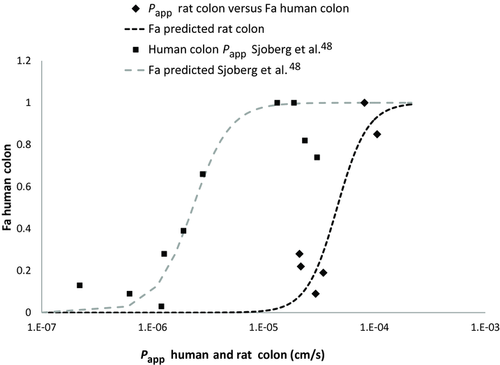
Table S2 of Supporting Information shows the permeability class of the different compounds assayed according to the BCS classification (literature data by comparison with metoprolol)32, 52, 54, 55 and the permeability class according to the results of this research in small intestine and colon (in situ method) and Caco-2 monolayers (in vitro method) obtained by comparison with metoprolol as high permeability model drug. A BCS-based classification derived from Figure 6 and considering a cut-off value of fraction absorbed in colon of 50% is also shown.
DISCUSSION
The main purpose of this study is to validate the technique of in situ perfusion in colon and intestine of Wistar rat based on Doluisio's method and to compare the permeability values in both segments with permeability values in two Caco-2 cells-based models. A second objective is to explore whether the BCS system could be applicable for colonic absorption, at least for permeability classification and screening for CRS development. To reach these objectives, several drugs with different physicochemical characteristics (acids, bases, and lipophilicity) and transport mechanism have been chosen (see Table 1). Compounds have been assayed at a high concentration (500 μM) to ensure saturating conditions in the case that the tested compound is absorbed through a specialized, carrier-mediated mechanism. In these conditions (high concentration), the contribution of the transporters in both intestinal segments (small intestine and colon) would be negligible and absorption process could be described as a passive diffusion mechanism.
Our research shows that the correlation obtained between the permeability values in small intestine and colon is excellent (R2 > 0.9). There are not statically significant differences in the permeability of both segments assayed for most of the drugs but for three low permeability compounds: terbutaline, ranitidine, and atenolol. Interestingly, for these basic drugs, colonic permeability was higher in our rat model. These results are not because of differences in ionization degree in intestine versus colon as the perfusion solution were prepared and buffered at the same pH (7.00) for both segments.
Other authors have shown that polar drugs are less permeable in colon than in small intestine, whereas high permeability drugs present similar or higher permeability in colon in a rat model and in human tissue in Ussing chambers48, 56; thus, our results present a different trend. On the contrary, Rozehnal et al.49 did not found significant differences between human small intestine and human colon in Ussing chambers. From our results in rat colon and the comparison with the two models of Caco-2 cells monolayers, it seems that paracellular pathway in rat colon is less restrictive than in human intestine or at least there are less regional differences in the rat. Rat colon showed better correlation with Caco-2, 4 days model in which the paracellular pathway is less tight. On the contrary, the correlation between human colon permeability obtained in Ussing chambers and rat colon permeability is good (see Fig. 3), but demonstrated higher permeability values in rat colon compared with human tissue (slope close to 1.5). This linear correlation also reflects the difference in surface area for transport that is higher in human tissue (represented by the intersection with Y axis ∼30). The higher permeability values in rat colon versus human tissue in spite of the higher surface area available in the human tissue could reflect higher paracellular permeability in the rat model.
As it can be seen in Figure 4, the relationship between permeability values obtained in rat small intestine with Doluisio's technique and human fraction absorbed can be combined with permeability data obtained in rat small intestine with single-pass perfusion method as well as with rat tissue in Ussing chambers.50, 51 In accordance with these results, recently a good correlation between permeability values obtained in rat small intestine using these two experimental techniques (single-pass and Doluisio's method) in different laboratories has been demonstrated.57 This indicates the robustness of the rat model for predicting human Fa and the possibility of using this curve of combined data to predict oral fraction absorbed without the need of developing a full correlation with 20 model compounds but instead, running one or two model drugs of low, intermediate, and high permeability and checking whether the data fall in the same line. A similar approach has been proposed for the human permeability versus human Fa correlation.48
Figure 5 shows that a good sigmoidal relationship can be obtained with all the experimental systems used in this work between permeability values and human fractions absorbed but with a shift to higher permeability values in the in situ models (rat intestine or colon). This difference in the permeability ranges in cell culture versus whole tissue models reflects the difference in surface area available for transport as in the cell model only microvilli are present, whereas in the tissue or in the animal model, villi and folds contribute to a higher area availability.
Figure 5 also makes evident the higher permeability values obtained in rat colon versus small intestine in particular for low permeability drugs. Even if the differences in permeability between intestine and rat colon were statistically different only for three compounds, the fitted curve permits to point out the difference between both regions. These results could be further explored by performing experiments with markers of paracellular permeability with a wider range of molecular weights.
Finally, to validate the rat colon perfusion method to predict human colon absorption, it was necessary to have data availability from permeability values in human colon and/or human fraction absorbed in this region. Only recently, these data have been published,48, 49 making this comparison possible. In Figure 3, a good correlation between human colon tissue and rat is shown. In Figure 6, a sigmoidal correlation between rat colon permeability and human fraction absorbed in colon is shown. In the same figure, the correlation between human colon tissue and human colon Fa have been represented to show the shift to higher permeability values in rat colon, which nevertheless show a similar relationship.
Eventually, that means that rat colon permeability values can be used for classification purposes in high–low colon permeability compounds. In that case, the boundary value for classification has to be selected by considering the objective of the classification, that is, if the objective is to explore CR developability, a permeability value ensuring Fa > 50% could be reasonable (in our rat model that corresponds to a permeability value of 4.6×10⁻⁵ cm/s). Table S2 in Supporting Material shows the permeability class assigned to the different drugs assayed in this work based on the different experimental models and considering metoprolol as high permeability model, and the classification for CR developability based in our rat colon permeability values and the correlation with human colon Fa values (from Fig. 6).
CONCLUSION
In situ rat perfusion technique in colon and the same technique in small intestine are both equally useful to predict human oral fraction absorbed. Rat perfusion with Doluisio's method and single-pass provided a similar range of values demonstrating the robustness of the animal model and the possibility of combining data from different laboratories.
Rat colon permeability is well correlated with Caco-2 cell 4 days model reflecting higher paracellular permeability. Rat colon permeability values are also higher than human colon permeability values. In spite of the magnitude differences between rat colon and human colon, a good sigmoidal relationship has been shown between rat colon values and human fraction absorbed in colon indicating that rat colon perfusion can be used for compound classification and screening of candidates for CR development.
ACKNOWLEDGMENTS
The authors acknowledge partial financial support to the project: Red Biofarma.DCI ALA/19.09.01/10/21526/245–297/ALFA 111(2010)29, funded by European commission. Isabel Lozoya-Agullo received a grant from the Ministry of Education and Science of Spain (FPU 2012-00280).


