Orientation anisotropy of quantitative MRI parameters in degenerated human articular cartilage
Abstract
Quantitative magnetic resonance (MR) relaxation parameters demonstrate varying sensitivity to the orientation of the ordered tissues in the magnetic field. In this study, the orientation dependence of multiple relaxation parameters was assessed in cadaveric human cartilage with varying degree of natural degeneration, and compared with biomechanical testing, histological scoring, and quantitative histology. Twelve patellar cartilage samples were imaged at 9.4 T MRI with multiple relaxation parameters, including T1, T2, CW − T1ρ, and adiabatic T1ρ, at three different orientations with respect to the main magnetic field. Anisotropy of the relaxation parameters was quantified, and the results were compared with the reference measurements and between samples of different histological Osteoarthritis Research Society International (OARSI) grades. T2 and CW − T1ρ at 400 Hz spin-lock demonstrated the clearest anisotropy patterns. Radial zone anisotropy for T2 was significantly higher for samples with OARSI grade 2 than for grade 4. The proteoglycan content (measured as optical density) correlated with the radial zone MRI orientation anisotropy for T2 (r = 0.818) and CW − T1ρ with 400 Hz spin-lock (r = 0.650). Orientation anisotropy of MRI parameters altered with progressing cartilage degeneration. This is associated with differences in the integrity of the collagen fiber network, but it also seems to be related to the proteoglycan content of the cartilage. Samples with advanced OA had great variation in all biomechanical and histological properties and exhibited more variation in MRI orientation anisotropy than the less degenerated samples. Understanding the background of relaxation anisotropy on a molecular level would help to develop new MRI contrasts and improve the application of previously established quantitative relaxation contrasts.
1 INTRODUCTION
Osteoarthritis (OA) is a common disease and a leading cause of pain and disability, also causing major costs for society and health care system.1 The probability for getting OA and symptoms of it increases with age and most people over 65 years of age already have some signs of its existence.2 OA is featured by inflammation and degenerative changes of articular cartilage and other joint tissues and is most commonly prevalent in the weight-bearing joints such as the knee and hips.2-4 Degenerating hyaline cartilage undergoes irreversible changes both in structure and function.5 Besides being irreversible, there are no curative treatments for OA at the moment6.
X-ray imaging has traditionally been used for diagnosing OA, but magnetic resonance imaging (MRI) has been established as a good alternative to detect structural changes related to the disease.7 MRI provides not only visual images but also quantitative parameters which could be used to describe macromolecules and their interactions.8
Healthy cartilage consists of collagen matrix in which collagen fibers are oriented in a strict organization.9 Earliest signs of OA are associated with disruptions of the collagen network and include tissue softening and surface fibrillation.3, 5, 10 Based on the orientation of the collagen fibers, noncalcified cartilage is generally divided into three structural zones: superficial (SZ), transitional (TZ) and radial zone (RZ).11-13 In the radial zone, the orientation of the fibers is perpendicular to the surface and the organization is the highest, causing the highest anisotropic properties.9, 14, 15 With MRI it is possible to acquire high-resolution images from joints and distinguish between the cartilage layers. A layer-wise16 or voxel-based analysis17 is proposed to provide better analysis of cartilage quality than full thickness values.
Multiple quantitative MRI relaxation parameters have been shown to be sensitive to tissue orientation in the main magnetic field B0, and this directional dependence is called relaxation anisotropy.18, 19 The term “magic angle effect” has been used to describe the specific angle, that is, 54.7°, at which the residual dipolar interaction vanishes and the orientation dependent relaxation times reach their maximum value.20 Generally, T1 is not affected by the tissue orientation,21 while T2 has the strongest orientation dependence.14, 19, 22-24 T2 orientation dependence is generally explained to result from the dipolar interaction of water molecules, the arrangement and movement of which is restricted by the oriented collagen fibers.20, 25 Similarly, continuous wave (CW−)T1ρ26 and adiabatic T1ρ, which have been studied as potential markers for cartilage properties or degeneration27-29, both demonstrate varying degree of orientation sensitivity.19, 24
In articular cartilage, the water molecules are either tightly bound to the proteoglycans and collagen macromolecules, or loosely bound, that is, exist as free water.30 Degeneration of cartilage initiates with fibrillation of the superficial tissue and the loss of proteoglycans,31 and thus the amount of free water increases, which can be generally observed as a prolongation of the relaxation times.32, 33 OA is a vastly heterogeneous disease, and structural degradation might be different in different etiological processes causing it, thus it is also to be expected that the measured MRI features can be different depending on the degenerative status of the tissue and on the disease etiology.34
The magic angle effect may be seen as an artifact which can complicate the diagnosis of OA.35, 36 However, parameters sensitive to the orientation also seem to be sensitive to degenerative changes in cartilage.19 The purpose of this study was to investigate how the orientation anisotropy of different quantitative MRI parameters depends on the degeneration of articular cartilage using cadaveric human tissue samples.
2 METHODS
2.1 Sample preparation and biomechanical testing
Cylindrical osteochondral plugs (n = 12, d = 8 mm) from human cadaveric patellae were extracted and fresh frozen to −20°C for storing. The Research Ethics Committee of the Northern Savo Hospital District (Ethical permission: Kuopio University Hospital, Kuopio, Finland 134/2015) approved the sample collection. Indentation testing on a custom material testing setup was performed to compute the biomechanical parameters.37 First, a three-step stress-relaxation protocol by applying 5% of compression and 15 minutes relaxation with initial 12.5 kPa prestress and preconditioning (2% of thickness, five times) was conducted38 (indenter diameter 667 or 728 µm). Instantaneous modulus was determined at ramp phase of the third step, and equilibrium modulus was computed between the second and third step. Moduli were computed using the Hayes model37 assuming Poisson ratio of ν = 0.15 for equilibrium modulus39 and ν = 0.5 for instantaneous modulus.40
2.2 MRI measurements
For MRI measurements, the samples were trimmed to fit the 6 mm sample holder by drilling the outer edges of the samples off. The 6 mm samples were then immersed in perfluoropolyether (Galden HS 240, Solvay Solexis, Bollate, Italy) in a custom-built holder, which allowed (manual) rotation of the specimens, that is, rotation of cartilage surface normal axis with respect to the main magnetic field (B0) from outside the scanner. MRI was performed at 9.4 T using a 19 mm quadrature radio frequency volume transceiver (Rapid, Biomedical GmbH, Rimpar, Germany) and VnmrJ3.1 Varian/Agilent DirectDrive console. The samples were imaged at room temperature at three different orientations, nominally at 0°, 55°, and 90° with respect to B0. The orientation was confirmed from scout images and adjusted if necessary, prior to shimming, pulse calibration and measurements. Relaxation time measurements were realized using a global preparation block coupled to a single slice fast spin echo readout (repetition time = 5 s (7 s for T1), echo spacing = 4.35 ms, echo train length = 8 with centric echo ordering, matrix = 256 × 80, field-of-view = 16 × 16mm, and 1 mm slice, yielding a resolution of 62.5 µm along cartilage depth). A single imaging slice was positioned at the center of the specimen, perpendicular to the axis of specimen rotation and was rotated with the specimen. The measurements included T1 relaxation time with inversion recovery (inversion time (TI) = 0.2, 0.5, 0.8, 1.1, 1.4, and 3 s); T2 with spin echo preparation (echo time = 0, 8, 16, 32, 64, and 128 ms); CW − T1ρ with nine spin-lock amplitudes (γB1/2π = 10, 20, 50, 100, 200, 400, 800, 1500, and 2500 Hz)8; adiabatic T1ρ with pulses from the hyperbolic secant HSn family (HS1 and HS4 pulses, τp = 4.5 ms, and γB1,max/2π = 2.5, and 1.2 kHz, respectively, to match the RMS power between the pulse shapes [equal to ~906 Hz CW-pulse]).41 CW − T1ρ was measured with spin-lock durations of 0, 8, 16, 32, 64, and 128 ms, and adiabatic T1ρ was measured with pulse trains of 0, 4, 8, 12, 24, and 36 pulses using MLEV4 phase cycling. Shimming, calibrations and all measurements were repeated for every orientation. After the MRI studies, the samples were fixed in 10% neutral buffered formalin for 48 hours and then decalcified in EDTA for histology processing.
2.3 Optical density and quantitative polarized light microscopy
After decalcification, the samples were cut along the same plane that was used in MR imaging. Subsequently, the samples were dehydrated, embedded in paraffin, and cut into 3 µm thick sections. After the cutting, the paraffin was removed and the sections for optical density (OD) measurements were stained with Safranin-O for quantitation of proteoglycans. Rest of the histological sections were digested with hyaluronidase to remove proteoglycans and left unstained for quantitative polarized light microscopy (qPLM). OD was determined with digital densitometry42 and was conducted using a light microscope (Nikon Microphot-FXA, Nikon Co, Japan) equipped with a monochromatic light source and a 12-bit CCD camera (ORCA-ER, Hamamatsu Photonics KK, Japan. Pixel size 3.09 × 3.09 µm). The system was calibrated prior to the actual measurements with a set of neutral density filters (Schott, Germany) with an OD range of 0-2.3.
The unstained sections were digested with hyaluronidase enzyme for 18 hours to remove proteoglycans before the qPLM measurements (pixel size 2.53 × 2.53 µm). The optical retardation and collagen fibril orientation in the sections were measured according to Rieppo et al15 using quantitative Abrio PLM imaging system. Abrio PLM system (CRi, Inc, Woburn, MA) was mounted on a conventional light microscope (Nikon Diaphot TMD, Nikon, Inc, Shinagawa, Tokyo, Japan) and consisted of a green bandpass filter (492 nm), a circular polarizer, a computer-controlled analyzer composed of two liquid crystal polarizers and a CCD camera.
2.4 Scoring
Histological scoring was used to evaluate the severity of OA in the samples and was conducted with the Osteoarthritis Research Society International (OARSI) grading system.43 OARSI grading is based on evaluating the OA related changes in cartilage matrix and cells, and the grade value defines the severity of the depth-wise progression of OA into cartilage. Three Safranin-O stained sections per sample were scored and all the sections of all the samples were blind-coded and scored in random order. The score for each section was calculated as the average of four independent assessors, and the final score for each sample was calculated as the average of the three sections.
2.5 Data Analysis
MRI relaxation time constants were fitted in a pixel-wise manner using two-parameter monoexponentials with noise floor subtraction before fitting. Fits were calculated using in-house developed Matlab (Matlab R2017b, Mathworks, Natick, MA) plugin functions for Aedes (http://aedes.uef.fi). Depth-wise profiles of 1.4 mm width from the cartilage surface to the bone interface were calculated pixel-by-pixel at the centers of the specimens.

To quantitatively analyze orientation anisotropy of the MRI parameters in the different layers of cartilage, and as a bulk property, 1.4 mm wide layer region of interests (ROIs; superficial zone [SZ], transitional zone [TZ], and radial zone [RZ]) were manually defined for each sample from T2 maps to match the histology-based zones (Figure 1). Average anisotropy values were calculated separately for each ROI. Bulk anisotropy was calculated by first combining the three layer ROIs and then applying Michelson contrast equation to the bulk average values. This better reflects a lower resolution setting, where the depth-wise information is limited.
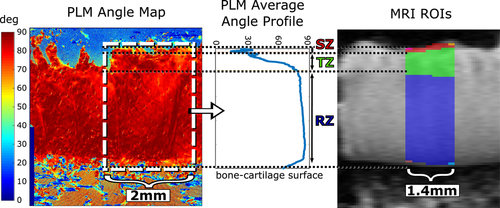
From qPLM data, anisotropy of the collagen fibers was calculated by applying an entropy filter of size 5 × 5 pixels (entropyfilt, Matlab) to the orientation angle images obtained from the qPLM. The anisotropy was represented by the inverse of the entropy+1 to constrain the values to the range [0,1]. The orientation, retardation, and anisotropy profiles were calculated separately for each section along cartilage depth and averaged over 2 mm width for mean depth-wise profile. The calculated profiles were further depth-normalized and final profile for each parameter was acquired as an average of three histological sections. OD profile was calculated in similar manner. The cartilage zones were determined based on the asymmetric bell-shaped curve45 of the reciprocal of the PLM anisotropy profile (ie, a profile of similar shape as a T2 profile) confirming the boundaries from PLM angle profile (Figure 1).
2.6 Statistical analysis
Statistical analysis was performed using IBM SPSS Statistics 25.0. Normality was tested with Shapiro-Wilk test. The differences between the grade groups were tested with independent samples t test, or Mann-Whitney U test in the case of non-normal distribution. The effect of orientation was tested using repeated measures analysis of variance (rANOVA) with Bonferroni correction for pairwise comparisons. Spearman correlation was calculated between radial zone MR anisotropy and the reference parameters, including OARSI grade and biomechanical and histological parameters. Matlab was used for the correlation analyses.
3 RESULTS
Histological sections show OA related degeneration, such as surface fibrillation and ultimately fissures and delamination combined with depletion of proteoglycans (ie, reduction of Saf-O staining) (Figure 2). In the samples representing advanced degeneration (OARSI grade 4), variation in cartilage quality between the samples can be visually observed. Degeneration and variation in the properties of the tissue are clearly reflected in the OD and qPLM profiles (Figure 2).

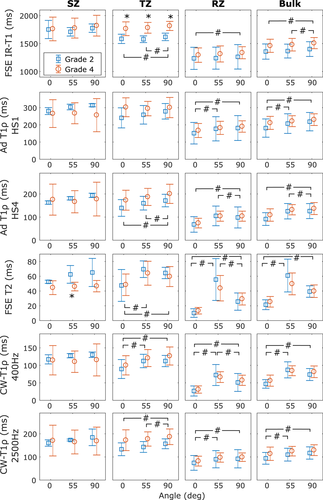
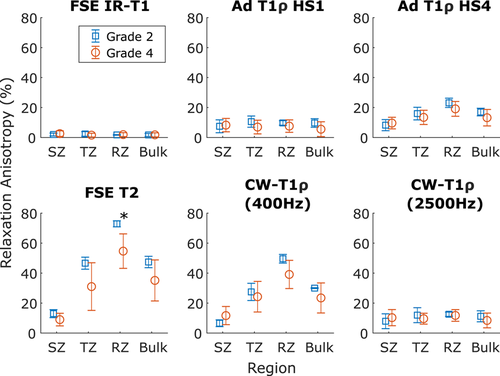
MRI relaxation parameters have different values in the different zones of cartilage (Figures 1 and 3). In general, relaxation is faster in the RZ than in the SZ. Orientation dependence was most prominent in the RZ for T2 and CW − T1ρ at 400 Hz spin-lock amplitude, but for all the parameters, statistically significant differences between grades were observed both in TZ and RZ and also for bulk value (repeated measures ANOVA with Bonferroni correction for post hoc, #P < .05, Figure 3). T1 distinguished the different OARSI grades in the TZ (*P < .05 independent samples t test), but otherwise no systematic significant differences were noted between the OARSI grades 2 and 4 (Figure 3).
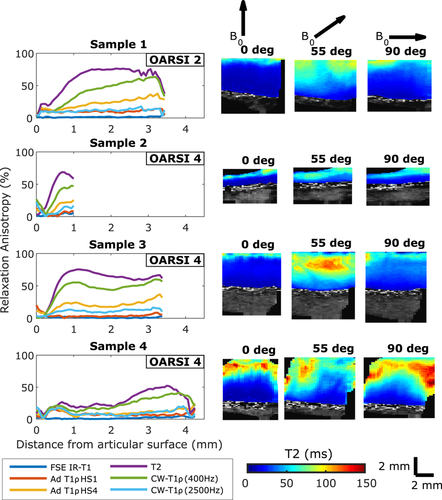
Relaxation anisotropy is highest in the RZ of cartilage, and this is true for both OARSI grade 2 and OARSI grade 4 samples (Figure 4). In general, relaxation anisotropy is relatively high in the SZ, decreases in the TZ and then rises quite quickly to its maximum level in the RZ. However, OARSI grade 4 samples showed very variable behavior: Sample 4 with OARSI grade 4 had lower anisotropy through the whole depth of the cartilage compared with the other samples. Sample 2 with an OARSI grade 4 and relatively thin cartilage showed similar anisotropy pattern as grade 2 samples, even though most of the cartilage had probably been eroded.
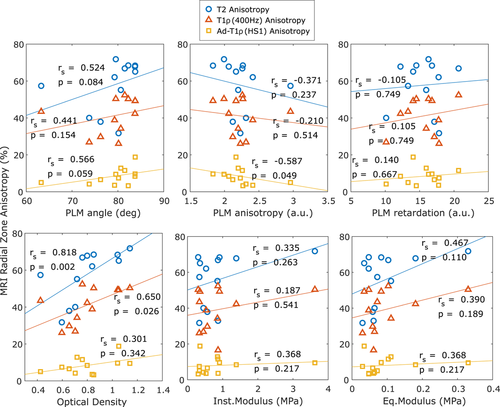
RZ anisotropy for T2 and CW − T1ρ (400 Hz) was lower for samples with higher OARSI grade value, and T2 anisotropy was statistically different for the two grade groups (Mann-Whitney U test, P < .05, Figure 5). Biomechanical properties had relatively large variation between the samples (Figure 6). The qPLM parameters also exhibited variation and the only statistically significant correlation was the negative correlation between PLM anisotropy and MRI anisotropy of adiabatic T1ρ in the RZ (Figure 6). Optical density, however, had a strong statistically significant correlation with MRI anisotropy of both T2 and CW − T1ρ (400 Hz) (T2: Spearman correlation rS = .82, P = .002; CW − T1ρ (400 Hz): rS = .65, P = .026).
T1 relaxation time and CW − T1ρ with 2500 Hz spin-lock correlated negatively with the optical density as a bulk value and in the RZ, T1 also in the TZ (Table S1). In the SZ, T2 had a positive correlation with the equilibrium modulus. All calculated correlations are presented in the supplementary material (Tables S1 and S2).
4 DISCUSSION
In this study, cadaveric human articular cartilage with variable spontaneous degeneration was investigated with multiple quantitative relaxation time measurements. Orientation anisotropy of the MRI parameters was studied by rotating the samples in the main magnetic field. Orientation anisotropy was quantified and the findings were compared with those of the previous study on intact bovine cartilage samples.19
Orientation anisotropy profiles of multiple MRI parameters were of similar shape as previously noted for bovine articular cartilage19: T2 has the clearest orientation dependence pattern followed by CW − T1ρ with low spin-lock amplitudes (eg, 400 Hz) (Figure 4). In this study, sample 1 with OARSI grade 2 showed a slower transition of relaxation anisotropy between the transitional and the radial zone as compared with the intact bovine samples in the previous study.19 For sample 3 with an OARSI grade 4, the shape of the relaxation anisotropy profile was very similar with those of the intact bovine samples in the previous study,19 with fast change from the transitional zone to the radial zone, even though according to histology the surface was already fissured. The degeneration of the superficial layer of OARSI 4 samples made it challenging to apply zonal analysis on the histological and MRI parameters. However, depth-wise variation was observed in all the parameters and thus zonal analysis was applied in addition to the bulk value analysis. The definition of the radial zone was considered the most reliable as it comprises most of the cartilage thickness, and thus the radial zone values and correlations were looked into at more detail (Figure 6).
While T1 is generally understood to be orientation independent, statistically significant differences were still observed between the different sample orientations. The differences were in the scale of 10 ms, which is relatively small compared with T1 values of 1000 ms, so their clinical relevance remains a question (Figure 3). However, for T2 and CW − T1ρ with a low spin-lock amplitude (400 Hz), changes were prominent for samples of both early and advanced degeneration. In addition to zonal averages, also bulk values over the whole depth of cartilage were calculated for relaxation parameters to reflect a lower resolution setting. In clinical MRI, the resolution is typically too low to distinguish between the different histological zones of cartilage,46 but the orientation anisotropy is observed also in the bulk value and thus the effect cannot be neglected.47
Orientation anisotropy of the relaxation parameters is the highest and relatively stable in the radial zone (Figure 4). This is true also for PLM anisotropy (Figure 2). Cartilage thickness does not appear to be a defining factor for the relaxation anisotropy, as a thick sample can have low radial zone anisotropy (sample 4, Figure 4) and a thin sample high radial zone anisotropy (sample 2, Figure 4). On the other hand, the thickness is known to vary with degeneration, starting with initial thickening (swelling) followed by eventual degeneration.48 Different samples seemed to be variably degenerated, possibly by different mechanisms. Surprisingly, the thinnest sample, which likely had lost its original surface layer and most of the other layers too, appeared to have MRI anisotropy similar to intact samples. Some OARSI 4 samples (eg, sample 3, Figure 2) demonstrated also PLM angle pattern almost similar to that of the nondegenerated samples. For several other samples, obvious signs of degeneration were also accompanied by greatly reduced orientation anisotropy. This high-lights the challenges in interpreting the results of the different measurement modalities for degenerated samples and also demonstrates the heterogeneity of such samples.
Overall, the anisotropy decreases as the quality of cartilage decreases and more degenerative signs appear, as described by the OARSI grading system (Figure 5). Samples with less degeneration have higher anisotropy, congruent with the idea of a higher degree of order in less degenerated tissue and also demonstrate less variation in anisotropy than samples with advanced degeneration. Intact bovine cartilage has been reported to have T2 orientation anisotropy of 80%, and CW − T1ρ with 250 Hz spin-lock 65% and with 500 Hz spin-lock 45%.19 Assuming that CW − T1ρ with 400 Hz falls between the latter two, both T2 and CW − T1ρ anisotropy values are higher for intact bovine cartilage samples compared with the degenerated human samples of the present study (Figure 5). The effect is the most prominent in the superficial zone (Figures 4 and 5).
Biomechanical properties seem to be able to clearly distinguish only one or two of the grade 2 samples (Figure 6). No correlation was found between the biomechanical parameters and MRI orientation anisotropy. Of remarkable curiosity is the finding that MRI relaxation anisotropy did not positively correlate with the PLM anisotropy either, and for adiabatic T1ρ there was even a statistically significant, though not strong, negative correlation. This is in contrary to the previously reported findings in intact bovine samples.19 It seems probable that in severely degenerated cartilage, the PLM anisotropy does not vary in a systematic and linear manner. In general, the MRI anisotropy, especially of T2, was much greater than the PLM anisotropy, possibly reflecting the limitations of the sub-optimal assessment of PLM anisotropy via the entropy method.15, 19 However, MRI anisotropy of T2 and CW − T1ρ with 400 Hz spin-lock correlated with the optical density, which is proportional to the amount of proteoglycans.42 PLM anisotropy reflects the properties of the collagen fiber network, not of the proteoglycans, especially given that the histological slices for PLM were carefully digested to remove the proteoglycans.
Generally, it is believed that the organization and alignment of collagen fibers create the orientation dependent properties of cartilage.18 Xia21 suggested in 1998 that proteoglycans might have an effect on orientation anisotropy, and later he phrases a possible explanation49 that “although the T2-anisotropic characteristic of cartilage is linked to the collagen fibril orientation in the tissue, the water-proteoglycan interaction influences the mobility of most water and “amplifies” the prevailing directional orientation of collagen fibers to make it measurable by NMR.” Trypsin digestion can be used to deplete proteoglycans from the samples, but in one study the trypsin treatment alone did not make the relaxation anisotropy disappear in the case of intact cartilage samples.50 In conclusion, anisotropic properties of cartilage seem to be a property of the collagen matrix and proteoglycan content together, as they both affect the movement of water molecules. In further studies, collagen content should be separately measured to better understand the roles of both macromolecules.
The most prominent limitation of this study is the small sample size, and that only patellar cartilage was analyzed. Also, to measure anisotropy more reliably, more than three sample orientations should be measured. Therefore, further research with samples of different levels of degeneration and measurements at multiple orientations is needed to obtain a clear understanding of the MRI relaxation anisotropy in degeneration of cartilage. According to our results, the anisotropy of the MRI parameters changes as the cartilage degenerates. The difference is observable at least for badly degenerated samples, but for understanding changes taking place early in the degeneration, samples with OARSI grades 0 to 1 should be included and analyzed. Intact samples or samples with minimal degeneration were unfortunately not available in the studied cadaveric sample set, high-lighting another limitation of the study: limited degenerative spread of the samples. To utilize and measure MRI anisotropy in a clinical setting, the most significant limitation is the relative difficulty of performing the scans at multiple orientations. However, also this has been demonstrated to be possible to some extent.47 Despite the limitations, anisotropy provides information about the physical processes behind the observed relaxation times and can open new opportunities for realizing quantitative MRI assessment of OA. In general, differences between different sample orientations can be observed in relaxation times (Figure 3) and in their correlations with the reference methods (Table S1). Taken together, the effect of orientation anisotropy should not be neglected when making quantitative MRI measurements of cartilage or other highly ordered tissue types.
In conclusion, orientation anisotropy of MRI parameters changes when cartilage degenerates. A great variation in the biomechanical and histological properties of the cartilage was observed in the samples with advanced OA (OARSI 4), and they also exhibit more variation in MRI orientation anisotropy than the less degenerated samples (OARSI 2). T2 anisotropy in the radial zone of cartilage is significantly higher in OARSI grade 2 samples than in grade 4 samples. The proteoglycan content of cartilage seems to correlate with MRI orientation anisotropy for T2 and CW − T1ρ with 400 Hz spin-lock in the present study material. Understanding the background of relaxation anisotropy on a molecular level would help in translation of the established quantitative MRI methods as well as in developing new MRI contrasts for future diagnostic applications.
ACKNOWLEDGMENTS
Financial support from the Academy of Finland (grants #285909, #293970, #297033, and #319440) and the Orion Research Foundation are gratefully acknowledged. Professor Juha Töyräs, Antti Joukainen (MD), Professor Heikki Kröger (MD), Markus Malo, (PhD), Mikko Finnilä (PhD), Tuomas Virén (PhD), Juuso T. J. Honkanen (PhD), and Katariina A. H. Myller (PhD) are acknowledged for assistance with sample collection. Jaakko Sarin (PhD) is acknowledged for the help with the histological analysis. Miitu Honkanen (MSc) and Rubina Shaikh (PhD) are acknowledged for providing additional assessment for histological scoring.
CONFLICT OF INTERESTS
The authors declare that there are no conflict of interests.
AUTHOR CONTRIBUTIONS
MJN, NEH, ON, MH, and MTN. conceived and designed the experiments. MP performed the biomechanical measurements. NEH performed histological measurements and analysis. NEH, ON, and MJN performed the MRI experiments and data collection. NEH and MJN analyzed the data, prepared figures, and the manuscript. All authors revised the manuscript and approved the final version of the manuscript.


