Agri-residual waste, wheat bran as a biosorbent for mitigation of dye pollution in industrial wastewaters
Abstract
In the current investigation, a comparison of mitigation of industrial-grade, Dispersive Dark Red (DDR) (93.55%), Disperse Orange (DO) (93.48%) and lab grade, Malachite Green (MG) (95.25%), and Congo Red (CR) (97.02%) dyes using biosorptive ability of wheat bran (WB) (efficient, economical, readily available and environment-friendly adsorbent) has been reported. WB obtained from wheat (a type of grass plant, a major human food crop), is a waste product generated from agricultural practices. The effect of different variables, namely, pH, adsorbate concentration, incubation time, adsorbent dosage, and temperature were investigated to determine the optimal parameters for dye sorption. The influence of the chemical modification of the sorbent on its adsorption capacity was also tested, which showed a positive effect of acid modification towards acidic dyes and vice versa towards the basic dyes. For all the dyes, in comparison to the Freundlich model, nonlinear Langmuir model of isotherm has given better conformity, with maximum adsorption capacity of 11.14 (MG), 15.17 (CR), 12.34 (DDR), and 15.98 (DO) mg/g at their respective optimal temperature following a pseudo-second-order kinetic model for adsorption, proving it to be dependent on adsorption capacity of WB. The findings clearly suggest WB to be an efficient dye remover from aqueous solutions and can, thus, be well explored for dye pollution reduction in industrial wastewaters.
Abbreviations
-
- ALMWB
-
- Alkali modified wheat bran
-
- AMWB
-
- Acid modified wheat bran
-
- CR
-
- Congo Red
-
- CV
-
- Crystal Violet
-
- DDR
-
- Dispersive Dark Red
-
- DO
-
- Disperse Orange
-
- MG
-
- Malachite Green
-
- UV/Vis
-
- Ultraviolet/Visble
-
- WB
-
- Wheat bran
1 INTRODUCTION
Water pollution by chemical-based dyes (along with other chemicals employed in different industrial processes), is a cause of concern in textile industry as these are often associated with toxicity, mutagenicity, carcinogenicity [1, 2], and genotoxicity [3]. The textile industry is a major chemical-based, water- [4] and energy-intensive industry, which uses dyes for coloring textile fabrics. Apart from other textile wet processing steps like, desizing and scouring, that use chemicals, fabric dyeing is one of the most problematic steps, with unbound dyes being released into the wastewater. The wastewater, rich in metal ions, acids, bases, salts, and chemical dyes (1%–10%), when released, leads to environmental and health hazards [5, 6]. Synthetic dyes, which show high stability in water in the presence of sunlight, heat, oxidizing agents, are recalcitrant to degradation and bioaccumulate in the environment [7] leading to adverse effects on aquatic life-forms [8]. Technologies for the abatement of chemical dyestuffs from the industrial effluents were a result of appropriate environmental acts and strict legislation by regulatory bodies. Numerous methods [9] have been evaluated for dye removal from wastewater. Adsorption, because of its efficiency, versatility, insensitivity to toxic chemicals and even, cost-effectiveness is a promising alternative for the same [10].
Lignocellulosics (wheat bran [WB], rice husk, sugarcane dust, rice bran, corncob meal, etc.) from wood, agriculture, and food-based industries [11], have drawn much interest as a biosorbent for the removal of toxic pollutants [10]. WB, obtained from wheat, consists of the pericarp, testa, and hyaline and aleurone layers formed mainly of cellulose, hemicellulose, and lignin, and with different functional groups, needing nil-to-minimal treatment for use as biosorbent, they efficiently bind to chemical dyes [12-14]. The utilization of waste of one industry (agriculture industry) for another (chemical-like textile industry) thus, brings together the principles of circular economy to efficient exploitation of natural resources. Such strategically designed robust systems also provide a potentially economical environment pollution remediation approach.
WB is an important biowaste which can be used for reducing dye pollution and we have endeavored to evaluate WB, both modified (chemical) and unmodified, as a biosorbent for different chemical-type as well as grade-type synthetic dyes. The study compares laboratory-grade basic (Malachite Green [MG]) and acidic (Congo Red [CR]) dyes for their adsorption on WB. The study has also targeted “azo” dyes (associated with serious health hazards) by using industrial-grade (Disperse Dark Red [DDR] and Disperse Orange [DO]) dyes for the study. Similar evaluations for another important industrial dye, crystal violet [CV], have already been reported by us [15] and will be used for specific comparisons in the current study.
2 MATERIALS AND METHODS
2.1 Materials
Chemicals and reagents like MG (C23H25ClN2) and CR (C32H22N6Na2O6S2), of analytical grade, were purchased from HiMedia and Genei. Industrial-grade dyes, DDR (C20H13NO4), and DO (C18H14N4O2) were received from a reputed textile industry (name of the textile industry withheld) of Ludhiana, Punjab, India. WB, the adsorbent, was procured from the local market.
2.2 Preparation of adsorbent and dye solutions
The adsorbent was washed, heat dried, and subsequently 0.6 mm size particles were stored in sterile Ziploc bags [14, 15]. Further, a portion from WB, as processed above, was divided into two equal portions. While one portion was treated with 0.4 mol/L citric acid [16, 17], the other one was treated with 5% NaOH [18] to obtain AMWB (acid-modified WB) and ALMWB (alkali-modified WB), respectively, to study the influence of WB modification on adsorption of the dyes [13] and has been discussed in detail in our previous report [15].
One thousand milligrams per liter of stock solutions of each test dye were prepared and standard curves were plotted using different dye concentrations (10–130 mg/L), at 616 nm (MG) [19], 497 nm (CR) [20], 520 nm (DDR) and 420 nm (DO) [21] wavelength, respectively [21].
2.3 Optimization of incubation parameters on percent dye decolorization under batch adsorption
 (1)
(1) (2)
(2)Similarly, the influence of adsorbate concentration (10, 20, 30, 40, 50, 60, 70, 80, 90, 100, 110, and 130 mg/L), adsorbate-adsorbent contact time (30, 60, 90, 120,150, 180, 210, and 240 min), adsorbent concentration (2, 4, 6, 8, 10, 12, and 14 g/L) and temperature (25, 30, 35, 40, 45, 50, 55, 60, 65, and 70°C) was evaluated for the determination of dye decolorization ability of WB for MG, CR, DDR, and DO and the process details are discussed previously [15].
2.4 Plotting of adsorption isotherms
The mechanism of the adsorption was studied by plotting the equilibrium adsorption capacities against solute concentration in the solution. The curves thus obtained, were fitted to Langmuir and Freundlich models via nonlinear regression. For kinetic analysis, the adsorption capacities were plotted against time. The kinetic data were fitted to pseudo-first-order (PFO) and pseudo-second-order (PSO) models. The methods and calculations employed were the same as those used for CV adsorption over WB [15].
3 RESULTS
All the experiments have been performed in triplicates. Standard deviation was calculated for the obtained mean values and reported as “±” from the mean.
3.1 Effect of pH on percent dye decolorization by test adsorbent
The maximum percent dye decolorization for MG, (94.98) was at pH 10. CR, DDR and DO, on the contrary, showed best decolorization under acidic pH, with 96.76% (pH 4), 91.15% (pH 5), and 92.34% (pH 5), respectively (Table 1).
| S. no. | pH | Industrial dye | |||
|---|---|---|---|---|---|
| MG | CR | DDR | DO | ||
| 1. | 2.0 | 66.69 ± 0.4 | 86.10 ± 0.3 | 43.65 ± 0.1 | 42.46 ± 0.2 |
| 2. | 3.0 | 58.52 ± 0.1 | 90.88 ± 0.3 | 75.96 ± 0.4 | 74.26 ± 0.1 |
| 3. | 4.0 | 56.69 ± 0.1 | 96.76 ± 0.1 | 77.88 ± 0.3 | 81.39 ± 0.2 |
| 4. | 5.0 | 74.48 ± 0.3 | 85.57 ± 0.2 | 91.15 ± 0.2 | 92.34 ± 0.1 |
| 5. | 6.0 | 81.91 ± 0.8 | 81.88 ± 0.6 | 89.23 ± 0.2 | 86.48 ± 0.3 |
| 6. | 7.0 | 89.48 ± 0.2 | 56.23 ± 0.7 | 84.81 ± 0.2 | 81.24 ± 0.2 |
| 7. | 8.0 | 90.07 ± 0.1 | 37.79 ± 0.1 | 75.58 ± 0.3 | 76.41 ± 0.2 |
| 8. | 9.0 | 91.32 ± 0.5 | 36.43 ± 0.2 | 58.08 ± 0.4 | 68.21 ± 0.2 |
| 9. | 10.0 | 94.98 ± 0.1 | 36.17 ± 0.1 | 55.96 ± 0.2 | 53.34 ± 0.1 |
| 10. | 11.0 | 93.35 ± 0.3 | 35.23 ± 0.2 | 35.96 ± 0.2 | 34.24 ± 0.4 |
| 11. | 12.0 | 91.12 ± 0.1 | 35.02 ± 0.2 | 33.96 ± 0.2 | 29.45 ± 0.4 |
- Note: Bold values used to highlight the best values received. Incubation conditions: adsorbate concentration (g/L): 10; incubation time (min): 180; adsorbent dose (mg/L): 100; temperature (°C): 30.
- Abbreviations: CR, Congo Red; DDR, Disperse Dark Red; DR, Disperse Orange; MG, Malachite Green.
3.2 Effect of adsorbate concentration and incubation time on percent dye decolorization
The effect of adsorbate concentration on dye decolorization with respect to variable incubation time (Table 2) was studied. For MG, it was 110 mg/L of initial adsorbate concentration with which maximum (95.05%) dye removal was achieved under optimized pH after 210 min. On the contrary, with 100 mg/L dye concentration, the maximum decolorization for CR (96.99%) was observed after 210 min and after 180 min for DDR (91.20%) and DO (92.42%). As observed in Table 2, for azo dyes (both industrial and lab grades), with an increase in the initial dye concentration under specific incubation time, there was a sharp decrease in the percent dye removal. For DDR after 180 min there was an abrupt decrease from 91.20% to 79.86% with 100 and 110 mg/L initial dye concentration, whereas the respective concentrations with an increase in incubation period had shown saturation in dye removal.
| S. no. | Dye | Adsorbate conc. (mg/L) | Time (min) | |||||||
|---|---|---|---|---|---|---|---|---|---|---|
| 30 | 60 | 90 | 120 | 150 | 180 | 210 | 240 | |||
| 1 | MGa | 60 | 60.07 ± 0.5 | 68.82 ± 0.6 | 82.20 ± 0.1 | 87.72 ± 0.2 | 94.55 ± 0.3 | 97.72 ± 0.4 | 98.16 ± 0.1 | 98.10 ± 0.3 |
| 70 | 57.50 ± 03 | 72.86 ± 0.2 | 81.02 ± 0.7 | 82.13 ± 0.8 | 91.10 ± 0.4 | 96.80 ± 0.2 | 97.98 ± 0.1 | 97.18 ± 0.3 | ||
| 80 | 56.42 ± 0.3 | 71.12 ± 0.2 | 80.66 ± 0.2 | 81.47 ± 0.2 | 88.21 ± 0.2 | 95.59 ± 0.2 | 96.82 ± 0.5 | 96.76 ± 0.4 | ||
| 90 | 48.67 ± 0.1 | 70.07 ± 0.2 | 79.77 ± 0.2 | 80.51 ± 0.2 | 88.11 ± 0.4 | 94.57 ± 0.2 | 95.69 ± 0.6 | 95.64 ± 0.6 | ||
| 100 | 47.60 ± 0.1 | 67.57 ± 0.1 | 76.44 ± 0.1 | 79.92 ± 0.1 | 87.98 ± 0.5 | 94.46 ± 0.4 | 95.51 ± 0.2 | 95.19 ± 0.2 | ||
| 110 | 37.27 ± 0.1 | 63.23 ± 0.1 | 72.27 ± 0.1 | 77.20 ± 0.1 | 85.20 ± 0.5 | 94.10 ± 0.1 | 95.05 ± 0.2 | 94.88 ± 0.2 | ||
| 120 | 24.23 ± 0.2 | 52.56 ± 0.2 | 57.23 ± 0.8 | 64.96 ± 0.1 | 75.21 ± 0.5 | 85.32 ± 0.1 | 87.21 ± 0.2 | 87.02 ± 0.1 | ||
| 2 | CRb | 60 | 76.68 ± 0.4 | 83.27 ± 0.2 | 84.78 ± 0.1 | 93.98 ± 0.5 | 95.28 ± 0.3 | 97.67 ± 0.3 | 98.23 ± 0.3 | 98.07 ± 0.1 |
| 70 | 73.01 ± 0.1 | 76.16 ± 0.6 | 83.78 ± 0.1 | 88.54 ± 0.2 | 92.67 ± 0.4 | 94.78 ± 0.3 | 97.12 ± 0.3 | 97.08 ± 0.1 | ||
| 80 | 71.08 ± 0.3 | 73.24 ± 0.5 | 78.57 ± 0.3 | 86.17 ± 0.2 | 85.37 ± 0.2 | 93.98 ± 0.8 | 96.87 ± 0.3 | 96.35 ± 0.7 | ||
| 90 | 71.93 ± 0.3 | 74.06 ± 0.2 | 76.94 ± 0.2 | 83.96 ± 0.1 | 89.84 ± 0.1 | 92.56 ± 0.1 | 96.36 ± 0.2 | 96.02 ± 0.1 | ||
| 100 | 58.31 ± 0.2 | 66.91 ± 0.2 | 68.83 ± 0.2 | 71.70 ± 0.1 | 79.25 ± 0.3 | 86.49 ± 0.1 | 96.99 ± 0.8 | 96.12 ± 0.1 | ||
| 110 | 36.51 ± 0.1 | 47.81 ± 0.1 | 54.27 ± 0.1 | 59.71 ± 0.1 | 67.44 ± 0.7 | 72.57 ± 0.2 | 72.12 ± 0.1 | 72.06 ± 0.2 | ||
| 120 | 23.26 ± 0.4 | 28.12 ± 0.3 | 35.54 ± 0.3 | 37.67 ± 0.5 | 40.23 ± 0.3 | 42.12 ± 0.1 | 42.45 ± 0.2 | 42.15 ± 0.2 | ||
| 3 | DDRc | 60 | 65.12 ± 0.5 | 71.08 ± 0.4 | 82.32 ± 0.3 | 84.78 ± 0.1 | 89.38 ± 0.3 | 94.58 ± 0.4 | 96.56 ± 0.1 | 96.50 ± 0.2 |
| 70 | 56.28 ± 0.2 | 65.74 ± 0.1 | 75.48 ± 0.1 | 78.91 ± 0.1 | 84.89 ± 0.2 | 94.45 ± 0.6 | 95.32 ± 0.5 | 95.18 ± 0.4 | ||
| 80 | 53.32 ± 0.1 | 61.35 ± 0.1 | 63.59 ± 0.3 | 77.69 ± 0.1 | 84.45 ± 0.2 | 92.78 ± 0.3 | 94.38 ± 0.4 | 94.01 ± 0.1 | ||
| 90 | 47.61 ± 0.2 | 55.36 ± 0.3 | 62.68 ± 0.4 | 75.93 ± 0.2 | 84.58 ± 0.1 | 91.20 ± 0.2 | 91.15 ± 0.3 | 91.05 ± 0.1 | ||
| 100 | 43.34 ± 0.1 | 53.82 ± 0.4 | 61.36 ± 0.2 | 74.21 ± 0.3 | 83.37 ± 0.1 | 91.20 ± 0.2 | 91.19 ± 0.4 | 91.17 ± 0.3 | ||
| 110 | 32.35 ± 0.3 | 48.45 ± 0.2 | 52.78 ± 0.1 | 65.18 ± 0.5 | 75.26 ± 0.6 | 79.86 ± 0.2 | 81.65 ± 0.3 | 81.98 ± 0.3 | ||
| 120 | 28.34 ± 0.2 | 46.65 ± 0.2 | 56.65 ± 0.4 | 64.87 ± 0.3 | 74.37 ± 0.1 | 76.38 ± 0.1 | 76.98 ± 0.1 | 78.28 ± 0.1 | ||
| 4 | DOd | 60 | 67.23 ± 0.3 | 73.15 ± 0.3 | 83.26 ± 0.3 | 86.47 ± 0.2 | 88.97 ± 0.5 | 94.76 ± 0.2 | 95.54 ± 0.2 | 95.69 ± 0.2 |
| 70 | 57.48 ± 0.2 | 66.26 ± 0.2 | 74.82 ± 0.5 | 78.65 ± 0.2 | 87.73 ± 0.1 | 94.52 ± 0.3 | 94.78 ± 0.1 | 94.70 ± 0.1 | ||
| 80 | 52.13 ± 0.1 | 67.34 ± 0.3 | 73.68 ± 0.2 | 77.53 ± 0.1 | 86.61 ± 0.2 | 93.63 ± 0.2 | 93.45 ± 0.1 | 93.22 ± 0.2 | ||
| 90 | 45.62 ± 0.1 | 54.53 ± 0.1 | 61.38 ± 0.2 | 76.45 ± 0.1 | 85.34 ± 0.2 | 92.99 ± 0.2 | 92.67 ± 0.2 | 92.57 ± 0.2 | ||
| 100 | 38.25 ± 0.3 | 48.74 ± 0.1 | 59.39 ± 0.1 | 73.42 ± 0.3 | 84.65 ± 0.1 | 92.42 ± 0.2 | 92.26 ± 0.3 | 92.33 ± 0.4 | ||
| 110 | 35.38 ± 0.3 | 47.41 ± 0.1 | 51.58 ± 0.4 | 63.49 ± 0.4 | 74.68 ± 0.1 | 78.56 ± 0.1 | 83.26 ± 0.4 | 83.11 ± 0.1 | ||
| 120 | 27.87 ± 0.3 | 45.81 ± 0.1 | 50.56 ± 0.1 | 58.84 ± 0.3 | 63.38 ± 0.2 | 72.03 ± 0.1 | 72.39 ± 0.1 | 72.46 ± 0.1 | ||
- Note: Bold values used to highlight the best values received.
- Abbreviations: CR, Congo Red; DDR, Disperse Dark Red; DR, Disperse Orange; MG, Malachite Green.
- Incubation conditions:
- a pH 10; adsorbent dose (g/L): 10; temperature (°C): 30.
- b pH 4; adsorbent dose (g/L): 10; temperature (°C): 30.
- c pH 5; adsorbent dose (g/L): 10; temperature (°C): 30.
- d pH 5; adsorbent dose (g/L): 10; temperature (°C): 30.
3.3 Effect of adsorbent dose on percent dye decolorization
When the effect of adsorbent dosage was studied (Table 3), the maximum adsorption was with 12 g/L of adsorbent dose, exhibiting 96.37% (MG), 97.08% (CR), 93.02% (DDR), and 93.16% (DO) dye decolorization, respectively. Beyond this, there was no significant decrease in dye removal. Interestingly, the best adsorption observed, with 12 g/L of adsorbent dose, was only marginally better than that seen with lesser adsorbent dose, with only 1.41% (MG), 0.3% (CR), 1.9% (DDR), and 0.74% (DO) higher adsorption at 12 mg/L, compared to that seen for 10 mg/L.
| S. no. | Dye | Adsorbent dose (g/L) | ||||||
|---|---|---|---|---|---|---|---|---|
| 2 | 4 | 6 | 8 | 10 | 12 | 14 | ||
| 1 | MGa | 80.84 ± 0.2 | 83.10 ± 0.4 | 84.37 ± 0.7 | 86.80 ± 0.1 | 95.01 ± 0.1 | 96.37 ± 0.1 | 96.43 ± 0.2 |
| 2 | CRb | 57.97 ± 0.2 | 64.53 ± 0.2 | 78.84 ± 0.1 | 88.12 ± 0.1 | 96.78 ± 0.3 | 97.08 ± 0.3 | 97.06 ± 0.2 |
| 3 | DDRc | 54.29 ± 0.1 | 63.27 ± 0.3 | 76.48 ± 0.1 | 89.65 ± 0.2 | 91.24 ± 0.1 | 93.02 ± 0.5 | 93.03 ± 0.3 |
| 4 | DOd | 57.21 ± 0.3 | 65.87 ± 0.2 | 77.49 ± 0.3 | 87.21 ± 0.3 | 92.47 ± 0.3 | 93.16 ± 0.2 | 93.09 ± 0.1 |
- Note: Bold values used to highlight the best values received.
- Abbreviations: CR, Congo Red; DDR, Disperse Dark Red; DR, Disperse Orange; MG, Malachite Green.
- Incubation conditions:
- a pH 10; adsorbate conc. (mg/L): 110; incubation time (min): 210; temperature (°C): 30.
- b pH 4; adsorbate conc. (mg/L): 110; incubation time (min): 210; temperature (°C): 30.
- c pH 5; adsorbate conc. (mg/L): 100; incubation time (min): 180; temperature (°C): 30.
- d pH 5; adsorbate conc. (mg/L): 100; incubation time (min): 180; temperature (°C): 30.
3.4 Effect of temperature on percent dye decolorization
Table 4 depicts that for MG, the optimum temperature was 30°C with 95.10% in dye removal best removed at 30°C, but with lesser efficiency (87.98%). This was followed by a gradual decrease in dye removal efficiency. All the other dyes were best removed at a higher optimum temperature than that for MG with 97.08% CR removal (35°C) and 93.45% (DDR) and 92.55% (DO) removal at 40°C.
| S. no. | Temp (°C) | Dye | |||
|---|---|---|---|---|---|
| MGa | CRb | DDRc | DOd | ||
| 1. | 25 | 78.05 ± 0.2 | 89.95 ± 0.5 | 85.83 ± 0.3 | 86.28 ± 0.4 |
| 2. | 30 | 95.10 ± 0.5 | 96.73 ± 0.2 | 91.22 ± 0.2 | 92.37 ± 0.3 |
| 3. | 35 | 89.45 ± 0.1 | 97.08 ± 0.1 | 91.89 ± 0.2 | 92.49 ± 0.1 |
| 4. | 40 | 88.98 ± 0.3 | 88.70 ± 0.1 | 93.45 ± 0.4 | 92.55 ± 0.1 |
| 5. | 45 | 85.08 ± 0.3 | 75.25 ± 0.4 | 91.12 ± 0.1 | 93.33 ± 0.2 |
| 6. | 50 | 79.33 ± 0.1 | 62.49 ± 0.5 | 81.23 ± 0.1 | 89.46 ± 0.1 |
| 7. | 55 | 68.57 ± 0.1 | 51.75 ± 0.2 | 76.41 ± 0.2 | 81.15 ± 0.1 |
| 8. | 60 | 65.78 ± 0.7 | 49.12 ± 0.2 | 60.23 ± 0.1 | 72.57 ± 0.3 |
| 9. | 65 | 55.55 ± 0.9 | 42.55 ± 0.9 | 50.27 ± 0.2 | 58.58 ± 0.2 |
| 10. | 70 | 35.55 ± 0.9 | 42.05 ± 0.9 | 41.23 ± 0.1 | 39.28 ± 0.2 |
- Note: Bold values used to highlight the best values received.
- Abbreviations: CR, Congo Red; DDR, Disperse Dark Red; DR, Disperse Orange; MG, Malachite Green.
- Incubation conditions:
- a pH 10; incubation time (min): 210; adsorbate dose (mg/L): 110; adsorbent dose (g/L): 10.
- b pH 4; incubation time (min): 210; adsorbate dose (mg/L): 100; adsorbent dose (g/L): 10.
- c pH 5; incubation time (min): 180; adsorbate dose (mg/L): 100; adsorbent dose (g/L): 10.
- d pH 5; incubation time (min): 180; adsorbate dose (mg/L): 100; adsorbent dose (g/L): 10.
3.5 Effect of chemical modification of WB on its dye adsorptive ability
For MG (Table 5), at a temperature of 30°C, initial pH of 10 for a period of 210 min, ALMBW yielded 98.39% dye removal. In the case of acidic dyes, namely, CR, DDR, and DO, AMWB showed better (98.58, 95.47, 96.41, respectively) dye removal in comparison to alkali-treated one (74.56, 72.36, 70.24 for CR, DDR, DO, respectively), under optimized conditions. Thus MG, in contrast to CR, DDR, and DO, was better adsorbed on ALMWB than on AMWB.
| S. no. | Dye | WB | Modified WB | |
|---|---|---|---|---|
| AMWB | ALMWB | |||
| 1 | MGa | 95.25 ± 0.1 | 89.87 ± 0.1 | 98.39 ± 0.4 |
| 2 | CRb | 97.02 ± 0.8 | 98.58 ± 0.3 | 74.56 ± 0.1 |
| 3 | DDRc | 93.55 ± 0.1 | 95.47 ± 0.4 | 72.36 ± 0.1 |
| 4 | DOd | 93.48 ± 0.2 | 96.41 ± 0.1 | 70.24 ± 0.2 |
- Note: Bold values used to highlight the best values received.
- Abbreviations: AMWB, acid-modified wheat bran; ALMWB, alkali-modified wheat bran; CR, Congo Red; DDR, Disperse Dark Red; DR, Disperse Orange; MG, Malachite Green.
- Incubation conditions:
- a pH 10; incubation time (min): 210; adsorbate dose (mg/L): 110; adsorbent dose (g/L): 10; temperature (°C): 30.
- b pH 4; incubation time (min): 210; adsorbate dose (mg/L): 100; adsorbent dose (g/L): 10; temperature (°C): 35.
- c pH 5; incubation time (min): 180; adsorbate dose (mg/L): 100; adsorbent dose (g/L): 10; temperature (°C): 40.
- d pH 5; incubation time (min): 180; adsorbate dose (mg/L): 100; adsorbent dose (g/L): 10; temperature (°C): 40.
3.6 Adsorption isotherm
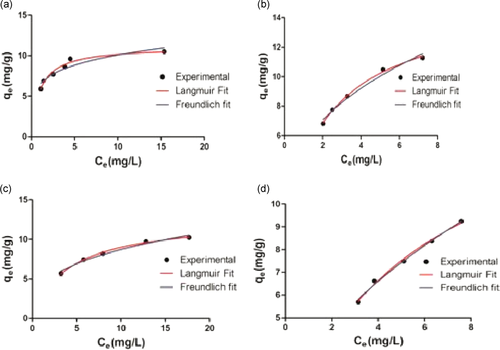
The adsorption of MG, CR, DDR, DO on WB was studied as a function of different concentrations (mg/L) of all the dyes individually, under incubation conditions optimized as above. Figure 1 depicts the relation between the adsorption capacity (qe) and the corresponding solution concentration of the dyes at equilibrium (Ce). Table 6 shows the corresponding values of the isotherm parameters and their correlation coefficients (R2). R2 value near to 1 indicates a better fit to the given model. Thus, Table 6 and Figure 1 depicts the highest correlation coefficient, deduced by fitting the experimental data into the nonlinear Langmuir isotherm model with R2 value more than 0.9992 (MG), 0.9986 (CR), 0.9977 (DDR), and 0.9932 (DO) with a maximum adsorption capacity (qm) of 11.142 (MG), 15.172 (CR), 12.347 (DDR), and 15.982 (DO), respectively.
| S. no. | Dye | Types of isotherm | Parameters | Values |
|---|---|---|---|---|
| 1. | MG | Nonlinear Langmuir | qm | 11.142 |
| KL | 1.021 | |||
| R2 | 0.9992 | |||
| Linear Freundlich | KF | 6.271 | ||
| N | 4.675 | |||
| R2 | 0.8978 | |||
| 2. | CR | Nonlinear Langmuir | qm | 15.172 |
| KL | 0.412 | |||
| R2 | 0.9986 | |||
| Linear Freundlich | KF | 1.173 | ||
| N | 2.519 | |||
| R2 | 0.9803 | |||
| 3. | DDR | Nonlinear Langmuir | qm | 12.347 |
| KL | 0.270 | |||
| R2 | 0.9977 | |||
| Linear Freundlich | KF | 4.410 | ||
| N | 3.337 | |||
| R2 | 0.9922 | |||
| 4. | DO | Nonlinear Langmuir | qm | 15.982 |
| KL | 0.1775 | |||
| R2 | 0.9932 | |||
| Linear Freundlich | KF | 3.884 | ||
| N | 2.850 | |||
| R2 | 0.9792 |
- Note: Bold values used to highlight the best values received.
- Abbreviations: CR, Congo Red; DDR, Disperse Dark Red; DR, Disperse Orange; KF, constant for energy or net enthalpy of adsorption; KL, constant for adsorption capacity; MG, Malachite Green; N, constant for measuring the intensity of adsorption; qm, maximum adsorption capacity (mg/g).
3.7 Batch kinetics
Table 7 reports the kinetic model parameter, and their parameter values were calculated by analysis of data at 30°C (MG), 35°C (CR), and 40°C (DDR and DO). The R2 values (0.9814, 0.9627, 0.9503, and 0.9611) with their corresponding qe values (13.46, 12.26, 11.88, and 13.28 mg/g) for MG, CR, DDR, and DO, respectively, depict that the adsorption process followed the PSO batch kinetic model for the dye adsorption on WB.
| S. no. | Dye | Model | Kinetic parameters | Concentration of dye (mg/L) |
|---|---|---|---|---|
| 1. | MGa | Pseudo-first-order | k1 | 0.01579 |
| qe (mg/g) | 10.66 | |||
| R² | 0.9757 | |||
| Pseudo-second-order | qe (mg/g) | 13.46 | ||
| k2 (/min) | 0.001185 | |||
| R² | 0.9814 | |||
| 2. | CRb | Pseudo-first-order | k1 | 0.014 |
| qecal (mg/g) | 9.666 | |||
| R² | 0.9302 | |||
| Pseudo-second-order | qecal(mg/g) | 12.26 | ||
| k2 (/min) | 0.001157 | |||
| R² | 0.9627 | |||
| 3. | DDRc | Pseudo-first-order | k1 | 0.01434 |
| qe (mg/g) | 9.418 | |||
| R² | 0.9260 | |||
| Pseudo-second-order | qe (mg/g) | 11.88 | ||
| k2 (/min) | 0.00124 | |||
| R² | 0.9503 | |||
| 4. | DOd | Pseudo-first-order | k1 | 0.01168 |
| qe (mg/g) | 10.01 | |||
| R² | 0.9557 | |||
| Pseudo-second-order | qe (mg/g) | 13.28 | ||
| k2 (/min) | 0.0007985 | |||
| R² | 0.9611 |
- Abbreviations: CR, Congo Red; DDR, Disperse Dark Red; DR, Disperse Orange; MG, Malachite Green.
- Incubation conditions:
- a pH 10; incubation time (min): 210; adsorbate dose (mg/L): 110; adsorbate dose (g/L): 10; temperature (°C): 30.
- b pH 4; incubation time (min): 210; adsorbate dose (mg/L): 100; adsorbate dose (g/L): 10; temperature (°C): 35.
- c pH 5; incubation time (min): 180; adsorbate dose (mg/L): 100; adsorbate dose (g/L): 10; temperature (°C): 40.
- d pH 5; incubation time (min): 180; adsorbate dose (mg/L): 100; adsorbate dose (g/L): 10; temperature (°C): 40.
3.8 Spectroscopic analysis of active functional groups
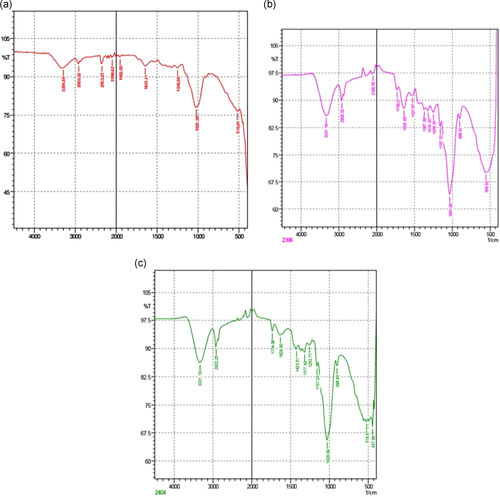
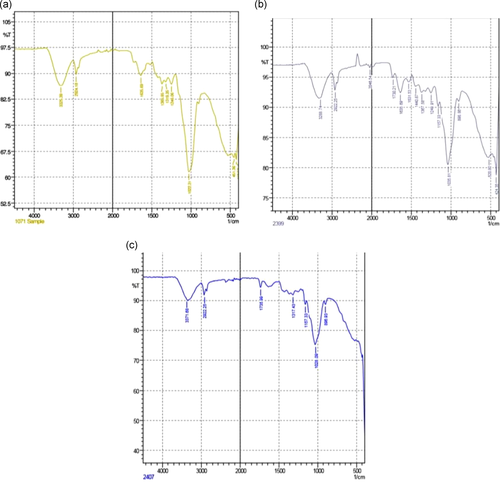
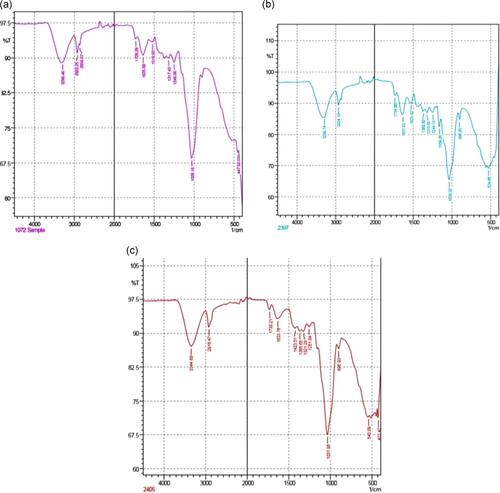
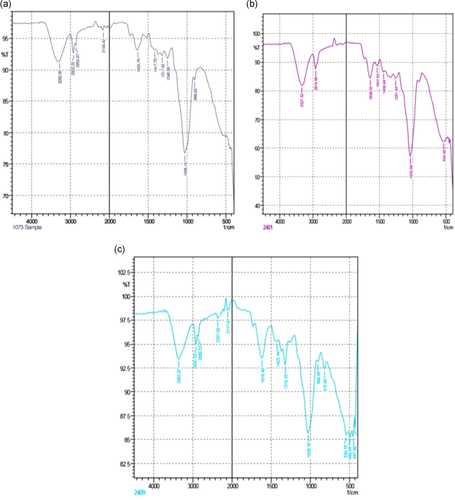
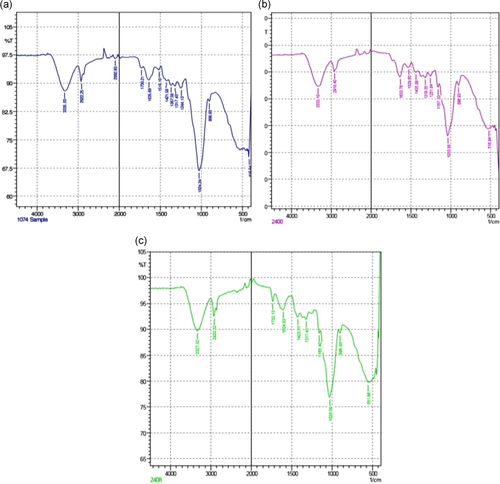
Fourier-transform infrared (FTIR) spectroscopy helps in the identification of essential functional groups on the surface of the adsorbents. The physical structures, chemical nature, the nature of the origin of the adsorbents along with their functional groups, have the potential to control the biosorption. Figure 2 shows the difference in the spectra of unmodified and AMWB and ALMWB. The peaks revealed the difference in the functional groups on adsorbent modification. The spectra of MG-adsorbed WB (Figure 3a), when compared with spectra of WB (Figure 2a–c), depicts a strong stretch of –C–O of vinyl ether at the range of 1031 cm−1 with medium stretch at 2924 cm−1, indicating the presence of alkane (–C–H) group. Figure 3c, also shows the presence of an intense –S═O-(sulfoxide stretch), indicating the presence of halo group at 1035 and 520 cm−1, respectively, indicating the influence of acid modification of WB before adsorption with MG. The FTIR spectrum of CR-adsorbed WB (Figure 4a) shows strong broadband at a peak range 1026 cm−1 indicating the presence of a stretch of –C–O of vinyl ether group, as that observed in MG on WB. The stretch at 3296 cm−1 indicates the presence of a strong bond of –OH stretching indicating the presence of the carboxylic group, along with a strong stretching of alkene group (–C═C). A peak at 3288 cm−1 indicates a strong bond of the carboxylic acid group with –OH stretching along with a strong stretch of –S═O, a sulfonamide group at 1369 cm−1 with a strong alkene (–C═C) group at 896 cm−1. Figure 5a, FTIR spectra of DDR on WB depicts the presence of common vinyl ether bond and MG at 1026 cm−1 was observed, with a sharp stretching at a peak of 3282 cm−1 showing the presence of an alkyne group depicting the reactivity of the substrate with strong –OH group depicting carboxylic group on the adsorbent. DDR on AMWB in Figure 5b, has shown a peak of C–Cl stretching at 538 cm−1, showing the attachment of –Cl group on the substrate. With a similar type of functional group present in the case of DO (Figure 6a–c) as that of CR, a similar result has been observed. The wavenumber of 3420 cm−1 indicates the possible presence of –OH, –NH groups on the adsorbent surface which can be depicted by comparison of modified and unmodified WB. The bands that are observed at 2930 and 1420 cm−1 stretches suggest the presence of the C–H group. The peak at 1645 cm−1 band is caused by the C═O stretching band of the carboxyl group. The absorption peak at 1540 cm−1 corresponding to the C–O bending vibration of the carboxylate ions is observed.
4 DISCUSSION
In the present work adsorption of two lab grade (MG and CR) and industrial-grade (DDR and DO) dyes on agriculture waste, WB, was investigated in batch adsorption studies showing the existence of differences in adsorption capacity of WB with respect to the chemical nature and grade of the dyes. pH affects the degree of dye ionization and the surface charges of the adsorbent and adsorbate which influences the dye sorption [24, 25]. The point of zero charge (pH pzc) also determines the ability of the surface to adsorb [26]. A similar type of result was also seen for CV adsorption (best decolorized, 87.71% under pH 8) on WB [15]. This indicated that alkaline pH is preferable for adherence of basic dye molecules on the adsorbent surface. A previous study with MG has also shown that at low pH, the number of positively charged sites increase at the cost of negatively charged sites on the adsorbent surface, and thus, under the same condition (i.e., low pH), the carboxylic groups (pKa—103) of MG possess high positive charge density [27]. This increases the electrostatic repulsion between the positively charged surface and the positively charged dye, with decreasing solution pH, leading to a decrease in the adsorption MG. The competition of the H+ ion with the cationic dye molecule may also contribute to the same phenomenon [26, 27]. On the contrary, the hydroxyl and carbonyl functional groups, on the adsorbent, can also act as biosorbing agents, as the sites with negative charges, which under higher pH, favor adsorption of positively charged dye cations [15, 28, 29]. Another study also reported maximum MG adsorption (~90%) on WB under alkaline pH (7–9). In another study, adsorption of CR on different adsorbents (palm, pine, and olive), using the Taguchi method, showed acidic pH (6.2, 6.7, and 6.7, respectively) to be optimum, with best adsorption observed on olive (95%) [30]. Again, for the removal of reactive dyes-RB19 (Reactive Blue), RR195 (Reactive Red), RY145 (Reactive Yellow) by WB an optimum pH 1.0 was reported, with a decrease in adsorption with an increase in pH [31].
The effect of adsorbate concentration on dye decolorization with respect to the different incubation periods of individual dyes, if compared, a decrease in the percent dye removal, with an increase in dye concentration (60–120 mg/L) can be observed which remains constant with increasing incubation period (30–240 min). Table 2 depicts for azo dyes (both industrial and lab grades), with an increase in the initial dye concentration under specific incubation time, there was a sharp decrease in the percent dye removal. For DDR after 180 min there was an abrupt decrease from 91.20% to 79.86% with 100 and 110 mg/L initial dye concentrations, whereas the respective concentrations with an increase in incubation period had shown saturation in dye removal. When the initial dye concentration increase, the dye adsorption per unit mass of the adsorbent also increases, demonstrating that an increase or decrease of dye adsorption depends upon initial dye concentration [32-34]. This might be due to the accumulation of dye ions with an increase in incubation time, which decreases the total surface area of the adsorbent particles available for adsorption of dyes leading to saturation [33, 34]. The adsorption and desorption occur simultaneously for which, the equilibrium reaches after an appropriate time (might be attributed to the composition of WB [35]. As also seen for Reactive Blue19, Reactive Blue195, and Reactive Yellow145 [29], where equilibrium was established after 300 min, duration for reaching equilibrium was seen to be independent of initial dye concentration and of the dye species [36]. As contact time is an incredibly significant factor for wastewater treatment by adsorption, a longer contact time for the attainment of equilibrium is required for strong chemical bonding of adsorbate with adsorbent.
The effect of adsorbent dosage on percent decolorization has shown that a higher quantity of adsorbent was efficient for dye removal. Interestingly, though the best adsorption observed was with 12 g/L of adsorbent dose, it was only marginally better than that seen with lesser adsorbent dose, with only 1.41% (MG), 0.3% (CR), 1.9% (DDR), and 0.74% (DO) higher adsorption at 12 mg/L, compared to that seen for 10 mg/L. This might be a consequence of overlapping of the dye-binding sites, while the initial rapid increase in the dye removal, with an increase in the adsorbent dose, might be due to the availability of surface area with a higher concentration of the adsorbent [32]. As only marginal improvements were seen in adsorption, on increase in adsorbent dose from 10 to 12 g/L, which would mean higher cost of operation with minimal process benefits, 10 g/L (and not 12 g/L) of the adsorbent dose was used for further experimentation. Higher adsorption yield on WB for reactive dyes (RB19, RR195, and RY145) was also seen with increasing adsorbent dosage (0.5–3 g) [31]. At higher WB–solute concentration ratios, a very fast superficial sorption onto the adsorbent surface occurs that produces a lower concentration of solute in the solution than during the lower concentration of adsorbent to the solute. An increase in adsorption yield at a high dosage of adsorbent is due to the availability of more adsorption sites that allows improved adsorbent–adsorbate binding [33, 37].
The effect of temperature on adsorption when was reviewed, a study has shown that with an increase in the temperature from 20 to 50°C an increase in adsorption was observed for reactive dyes (RB 19, RR 195, and RY145) indicating the occurrence of an endothermic process [31]. In general, with an increase in temperature, the diffusivity of dye ions increases, resulting in increased adsorption rate, if diffusion is the rate-controlling step [38]. The increase in the surface energy of biosorbent energy is usually interpreted as a positive temperature effect on biosorption [39]. The negative effect of temperature on the same process (biosorption) is though not well interpreted but, a decrease in biosorption with increase in temperature, owing to “acclimatization” of the biosorbent [40], has been reported. In our study, the four dyes (MG, CR, DDR, and DO) did not show the same optimum temperature, which can be due to the influence of both physical adsorption and chemisorption [41].
Again, the result of dye decolorization properties of WB on adsorbent modification if compared with CV, as reported previously from the same study with the basic dye (MG) had shown similar results with a higher percent decolorization on ALMBW (92.45%) in comparison to the AMBW (82.65%) [15]. The assessment of adsorption isotherm has shown the corresponding type of equilibrium study models explaining the distribution of dye species among liquid and the substrate based on the group of assumptions related to uniformity and multiformity of adsorbents. The figure also shows the fitting of the scattered data to Langmuir and Freundlich isotherm models for the dyes with all showing best fit for nonlinear Langmuir model of isotherm with R2 value near to 1 indicating a better fit to the given model. CV [15] had also shown the nonlinear Langmuir model, with R2 (0.9713) value showing a satisfactory fit to the experimental data, in comparison to the Freundlich model with qm, 19.79 mg/g. Another study accurately reflects that the adsorption of MG on WB had followed the Freundlich isotherm model, showing that the adsorption capacity decreases as pH lowers [19]. The adsorption process is controlled by “rate of diffusion” and “mass transfer co-efficient,” which can be best assessed by kinetic analysis of adsorption data [42, 43]. The equations of adsorption kinetics can be of PFO or PSO models and many others. By the application of these models, the rate of solute/dye molecule uptake and the time of persistence of the adsorbate molecule at the solution–adsorbent interface can be determined [44]. On the contrary, in the case of CV [15], the PSO batch kinetic model was found to be appropriate (depicting it to be a monolayer adsorption system). A monolayer adsorption capacity of WB has also been shown, with maximum adsorption capacities of 117.6, 119.1, and 196.1 mg/gm at 60°C for RB 19, RB195, and RB 145 dyes, respectively, with regression coefficient (R2) higher than that of 0.99 depicting it to follow the PSO kinetic model of batch kinetics [31].
The spectroscopic analysis performed in this study could be readily compared with adsorption of CV on pearl millet, in which an intense absorption at a peak of 3423 cm−1 had shown as the peak having O–H bond stretching. On the contrary, the two CH2 stretching bands at 2924 and 2856 cm−1 were observed depicting asymmetric and symmetric stretching of CH2 groups showing the same wavenumbers before and after the adsorption, indicating that these groups did not participate in the adsorption process. Sharp intense peaks were observed at 1645 cm−1, before and after absorption assigned to the aromatic C–C ring stretching. The wavenumbers of these bands were not different before and after the adsorption of CV. Bands ranging from 1116 to 1022 and 1122 to 1024 cm−1 before and after adsorption, respectively, are assigned to C–O stretching vibrations [21]. In studies where FTIR analysis of natural and modified biosorbent (pinecone and oak cup pulps) for sorption capability of modified and unmodified wood, for removal of methylene blue were checked, not much difference was observed in the spectrum [45]. Thus, variation in the functional groups on the adsorbent surface helps in the dye adsorption, revealing that the dyes belonging to similar chemical groups though different chemical formulae and molecular structures, tend to show similar adsorption capacity. The findings of the study clearly suggest that WB is an effective biosorbent for different dyes/dye groups even though its modification has shown slightly higher decolorization, being an effective and economical dye adsorbent.
ACKNOWLEDGMENT
The authors are thankful to Lovely Professional University for providing facilities for conducting the study.
CONFLICT OF INTERESTS
The authors declare that there are no conflict of interests.
Open Research
DATA AVAILABILITY STATEMENT
The data that support the findings of this study are available from the corresponding author upon reasonable request.


