Interstitial amino acid concentrations in rodent brain tissue during chemical ischemia
Abstract
The significance of electrophysiological phenomena is well validated in brain ischemia research. A close link with interstitial amino acid levels has not been proved convincingly but is generally assumed. This has given widespread rise to the clinical method of amino acid, especially glutamate, microdialysis. We combined microdialytic and electrophysiological techniques in an in vitro ischemia model to test for such a correlation. Rodent hippocampal brain slices were subjected to various patterns of ischemic simulation by depletion of glucose and oxygen and to K+ superfusion, which is often used as an alternative stressor. Our data do not strengthen the significance of clinically standardized glutamate measurements, insofar as ischemia-induced damage was demonstrated by electrophysiology and histology before being clearly mirrored by interstitial glutamate levels. Taurine would be a more promising candidate. K+ is not an adequate substitute for ischemic simulation, because biochemical and electrophysiological reactions of the tissue are clearly different. In vitro microdialysis during ischemic simulation is feasible and might provide a tool to inquire into glial functions during ischemic stress. It is probably not able to elucidate processes within the synaptic cleft. © 2014 Wiley Periodicals, Inc.
Electrophysiological phenomena, especially anoxic depolarization (AD), and the loss of evoked neuronal activity provide early and pertinent information concerning the functional state and the exhaustion of energy resources in states of critically reduced brain perfusion (Rothstein, 2000; Somjen, 2001). A close correlation with the release of amino acids into the interstitial space under such conditions is generally accepted (Satoh et al., 1999; Phillis and O'Regan, 2003; Gorji et al., 2005); however, the exact time pattern of these events has not been established. Furthermore, apart from the notion that excitotoxic amino acid (EAA) transmitters play a decisive role in this situation (Hazell, 2007), actual kinetics and the question of whether there is an imperative connection between AD and interstitial EAA release remain to be addressed. In addition to basic scientific interest, this is also of practical relevance, because the detection of interstitial glutamate by microdialysis has become a method of neuromonitoring (Sarrafzadeh et al., 2003) in intensive care settings, where good electrophysiological measurements are difficult to obtain. Although they have been advocated for some time as useful for predicting values under such conditions, interstitial EAA levels are now increasingly questioned for their relevance. This also warrants further inquiry concerning their coherence with the probably more basic bioelectric phenomena during brain ischemia.
In vitro environments exclude systemic influences and provide control over parameters that are not easily accessible in vivo. Electrophysiological measurements during simulated ischemia are well established and may also be performed in human tissue (Wölfer et al., 2006). The first combination of electrophysiology with microdialytic measuring of serotonin in midbrain slices was reported by Sprouse et al. (1989), and Robert et al. (1997) demonstrated the feasibility of in vitro microdialysis of interstitial amino acids using organotypic slice cultures with K+-pulses as a stressor. The aim of our experiments was to transfer the modality of in vitro microdialysis into an ischemia model, to combine it with simultaneous electrophysiological registration, and to correlate interstitial amino acid measurements with well-known electrophysiological phenomena.
MATERIALS AND METHODS
Hippocampal Tissue
Care of animals and all experiments followed the guidelines of the German Animal Protection Law (last issued in 2006), were approved by the district government of Münster, and conformed to the National Institutes of Health guidelines on the ethical use of animals. Native adult Wistar rats (250–300 g) underwent decapitation under ether anesthesia, which results in a short period (∼2 min) of near-absolute normothermic ischemia, during which the skull was opened and the brain tissue was removed and cooled. This procedure mirrors the standard methodology used in most slice experiments.
The excised hippocampi were immediately cooled at 4°C in artificial cerebrospinal fluid (aCSF) containing (mmol/liter): NaCl 124, KCl 4, NaHCO3 26, CaCl2 2, MgSO4 1.3, NaH2PO4 1.24, and glucose 10. Tissue blocks were cut into 0.5-mm slices on a portable Vibratome. Slices were transferred into a portable submerged-type chamber (Köhling et al., 1996) in which aCSF was equilibrated with carbogen (95% O2 + 5% CO2) to pH 7.4 at 28°C.
Recording Chamber and Ischemic Simulation
Experiments were made in a specially designed interface chamber, keeping the slices between continuous flows of aCSF (2 ml/min) and humidified carbogen (O2 95%, CO2 5%; Wölfer et al., 2010). The chamber is characterized by temperature regulation via Peltier elements and by the possibility to change between normal status and ischemia simulation by remote control without manipulation of the experimental setup. The temperature was adjusted to 34°C (measured by a microprobe next to the slices), and pH was equilibrated to 7.4. Probes for microdialytic and electrophysiological measurements (see below) were immediately positioned after slice transfer into this chamber, after which the tissue was left to acclimate for 30+ min. Ischemia was simulated by simultaneous exchange of O2 against N2 in both phases and reduction of aCSF glucose content from 10 to 2 mmol/liter.
Microdialysis
A CMA 100 microdialysis pump (CMA Microdialysis, Solna, Sweden) delivered low-glucose aCSF (composition as described above, with glucose lowered to 2 mmol/liter) at a flow rate of 1 μl/min to a CMA 11 cuprophane probe (length 3 mm, diameter 0.24 mm, cutoff 6 kD).The lower glucose concentration was used to keep the probe from sustaining parts of the tissue during substrate reduction, thus changing “ischemia simulation” to “hypoxia.” The much higher fluid flow within the chamber and surrounding the lower tissue face may be expected to supply enough glucose to replace the glucose drain into the probe sufficiently under standard conditions.
The interface chamber was covered by an acrylic glass lid with an opening for the electrodes. With the slice placed near the outflow, it was possible to insert the microdialysis probe into the short side of the tissue sample with the help of a micromanipulator before the electrodes were positioned. Our Supporting Information includes a sketch of the experimental setup as well as an original picture of a measurement. The dialysate was collected in a refrigerated microsampler (CMA 170) over 5 min per sample. The vials had been prepared with 5 μl of a 500 nmol/liter homocysteine (HCY) solution as an internal standard (see below) so that the stored samples contained the dialysate at a 1:2 dilution. Samples were sealed and frozen at −80°C.
Quantitative amino acid recovery within the dialysates depends on temperature, pH, flow rate, length or area of the dialysis membrane, and the compound to be detected. From the manufacturer's data (Eliasson, 1991), amino acid recovery rate can be extrapolated to range around 20% with the chosen parameters. We tested this in a separate series of experiments and found our rates to be in good accordance with this estimate (see below).
Electrophysiology
Electrical signals from the stratum pyramidale in the CA1 region were recorded with glass micropipettes (NaCl 150 mmol, 0.5–1.5 MΩ), which were placed into the slice after insertion of the microdialysis probe. Direct current (DC) potentials were registered simultaneously with evoked sum potentials (EP), the latter being elicited by bipolar electrical stimulation (platinum electrodes, 0.5–2 mA, 0.2 msec, 0.1 Hz) of the Schaffer collaterals. If EP did not reach stable amplitudes of at least 2 mV, the tissue was discarded. The time span between induction of ischemia simulation and actual AD occurrence is termed AD latency. For the experiments reported herein, ischemic simulation was either continued until the end of the experiment or reversed at 2 min after DC potential measurement had shown anoxic depolarization (AD). This time span had been identified as appropriate to reach partial EP suppression after ischemic simulation in another series of experiments (data not shown). EP amplitudes after each ischemic simulation were related to those at the beginning of an experiment.
High-Pressure Liquid Chromatography
In reversed phase gradient high-pressure liquid chromatography (HPLC), the column (Hypersil 125 RP 18-5) was kept at 34°C in a heater (SunChrom, Friedrichsdorf, Germany). The gradient (for composition of polar and apolar phase see Supp. Info.; all chemicals from Sigma Aldrich, Seelze, Germany) was generated by two Shimadzu (Kyoto, Japan) LC10-AS single-piston pumps at a constant flow rate of 0.5 ml/min. In a refrigerated CMA 200 autosampler, the thawed microdialysis samples were mixed with an orthophthaldialdehyde reagent (see Supp. Info.) at 4°C for precolumn derivatization. After injection and separation, the fluorescent derivatives were detected by a Shimadzu RF 10-AXL (excitation 330 nm, detection 405 nm). Integration of fluorescence curves over time was performed with a Shimadzu C-R8A.
Samples were compared with a standard containing aspartate (ASP), HCY, glutamate (GLU), glutamine (GLN), arginine (ARG), alanine (ALA), taurine (TAU), and γ-aminobutyric acid (GABA) at 500 nmol/liter each. As a compromise between throughput (a single HPLC run with subsequent rinsing requiring about 30 min) and precision, our HPLC did not use norvaline as the internal sample standard (as usually described for such measurements), because this would have lengthened evaluation by 70–100%. HCY is known to be released by glia after electrical stimulation of 50–100 Hz (Klancnik et al., 1992), but not under hypoxic stress (Andiné et al., 1991). These findings seem to apply to our model as well. We subjected 10 slices to ischemic simulation and compared HCY concentrations in two control samples and two ischemic samples (collected between 10 and 20 min after substrate withdrawal, the time of largest amino acid release; see below) for each of these slices. The concentration ratio was 1.00 ± 0.08, indicating no relevant intrinsic HCY release in our experiments. Compared with the standard amino acid solution, in the analyzed samples, the HCY concentration ratio was 1.08 ± 0.12, meaning less than 10% average volume loss from sample freezing and thawing. This loss was accounted for by an individual correction for each sample. Additionally, the raw values of peak areas were corrected by the blank curve of distilled water, which was mixed with the reagent and injected instead of a sample for each fifth run. With these two corrections, repeated measurements of pooled samples differed by less than 10%. We deemed this level of accuracy to be adequate for our experiments. To exclude amino acid contamination, native aCSF was also derivatized and injected; measurements were subtracted from each microdialysis sample. This method allowed for reproducible measurements of all amino acids contained in the standard with the exception of ARG, which tended to be obscured by at least two further peaks in the dialysates (compared with similar HPLC setups, very likely threonine). Serine, glycine, and tyrosine were clearly identifiable in the dialysates but not routinely calculated.
We determined quantitative recovery for each amino acid in a separate series of experiments. Recoveries were 22% ± 3% for ASP, 26% ± 7% for HCY, 22% ± 3% for GLU, 30% ± 7% for SER, 19% ± 2% for GLN, 36% ± 6% for GLY, 20% ± 1% for ARG, 30% ± 3% for ALA, 22% ± 3% for TAU, and 19% ± 3% for GABA (mean ± SEM). This was in the expected range when extrapolating from recovery data given by the manufacturer. However, we saw considerable differences in absolute amino acid concentrations among individual slice experiments, most likely arising from varying probe positions within individual slices. Therefore, in addition to absolute values, we used percentages related to steady-state conditions at the beginning of each experiment for statistical evaluation.
Histological Detection of Cell Death
Dark neuron count was used as a measure of cell death after delayed reversal of substrate withdrawal (see under Electrophysiology). The slices used for these experiments were not equipped with probes to provide an estimate of otherwise uninfluenced cellular damage under the conditions in question. Having undergone modulated ischemic simulation, they were fixed for 24 hr in a solution of 4% paraformaldehyde and 2.5% glutaraldehyde in 0.1 M phosphate-buffered saline (PBS; pH 7.4). Slices were treated for 1 hr with 1% osmic acid, followed by dehydrating in graded ethanol solutions and embedding in resin. Semithin 8-μm sagittal sections were cut and stained with hematoxylin and eosin (H&E) for examination by light microscopy. The hippocampal CA1 area was studied under a light microscope (BX51; Olympus, Tokyo, Japan) linked to a digital camera. Digital photographs were taken with a ×100 oil immersion objective lens (Olympus). The magnification was calculated using a lens micrometer. Somal shrinkage, cytoplasmic darkening, microvacuolation, and nuclear darkening/chromatin aggregation were taken as characteristics of dark neurons (Barenberg et al., 2001; Sadeghian et al., 2012). Measurements were taken of the number of dark cells per field of view (f.o.v.).
Statistical Analysis
Electrophysiological AD characteristics (latency and amplitude) and dark cell counts were found to be consistent with the assumption of normal distribution (Kolmogorov–Smirnov criterion) and therefore compared with two-sample t-tests. Measurements of neither amino acid concentrations nor postischemic EP recovery were normally distributed, so Mann-Whitney rank sum tests were used for data assessment. Calculations were made in SPSS SigmaStat (SPSS Inc., Chicago, IL). Statistical significance was assumed at P < 0.05.
RESULTS
In a first series of experiments (n = 6, Fig. 1), microdialytic sampling was started after 30 min of stable DC and EP detection. Electric stimulation was suspended for 45 min, and eight samples were taken. Three further samples were then collected with electric stimulation restarted. Oxygen and glucose supply remained unchanged. These experiments demonstrated the stability of electrophysiological (Fig. 1B) and microdialytic (Fig. 1A,C) measurements under resting conditions. GLN was the most abundant amino acid in the dialysates (3–5 μmol/liter) with GLU, TAU, ARG, and ALA all at about the range of 0.3–1.0 μmol/liter, with low ASP and GABA levels near background noise. Amino acid levels were not changed by low-frequency electric stimulation (Fig. 1D, rank sum test; PASP = 0.93, PGLU = 0.49, PGLN = 0.31, PARG = 0.07, PALA = 0.13, PTAU = 0.10, and PGABA = 0.13).
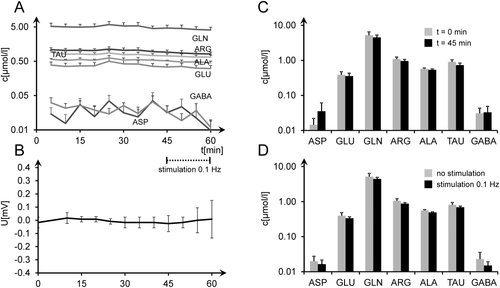
In a second series of experiments, electrophysiological AD characteristics were compared between slices with placement of a microdialysis probe and slices without placement of a microdialysis probe (n = 12/12). We found AD latencies (without probe 1.4 ± 0.9 min, with probe 1.8 ± 0.7 min; mean ± SD) and amplitudes (without probe 12.3 ± 3.2 mV, with probe 8.6 ± 4.4 mV; mean ± SD) to be statistically indistinguishable (P = 0.25/P = 0.07; two-sample t-tests; data not visualized), although there was a trend toward lower AD amplitudes. Together these two series demonstrated that 1) DC measurements and AD characteristics were left almost unchanged by the additional placement of a microdialytic probe; 2) low-frequency stimulation of Schaffer collaterals did not influence DC measurements; 3) microdialytic measurements did not significantly shift over the entire course of these experiments, and effects of probe insertion on amino acid release seemed to have abated after 30+ min; and 4) low-frequency electric stimulation had no significant effect on interstitial amino acid levels.
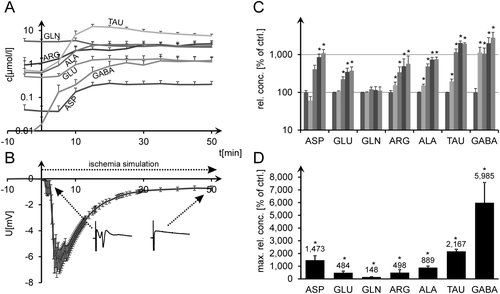
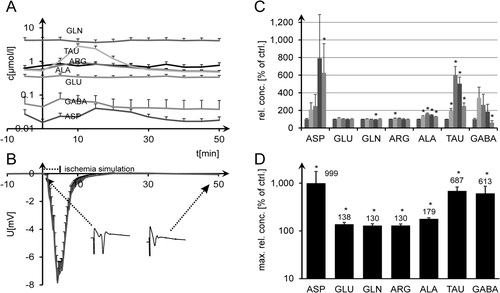
In the third series of experiments (n = 11), ischemic simulation was not reversed. After stable amino acid readings under normal conditions, TAU was the earliest and most pronounced ischemia marker, with interstitial levels rising to ∼20-fold normal levels at 15 min after substrate withdrawal, followed by ARG and ALA. GABA showed even higher relative increases (up to 60 times normal); however, absolute interstitial concentrations were much lower. GLU and GLN showed somewhat lesser concentration increases, with GLU not yet significant at 5 min and GLN increasing to only 1.5 times normal. However, all of these increases became statistically significant during the further course of the experiment. Figure 2A,B shows the time course of absolute amino acid concentrations vs. DC measurements. Figure 2C gives a statistical evaluation of normalized values at t = 0, 5, 10, 15, and 20 min. Figure 2D presents the evaluation of normalized maximum amino acid levels encountered at any time of each whole experiment until t = 50 min (Fig. 2C,D; rank sum tests, P < 0.05).
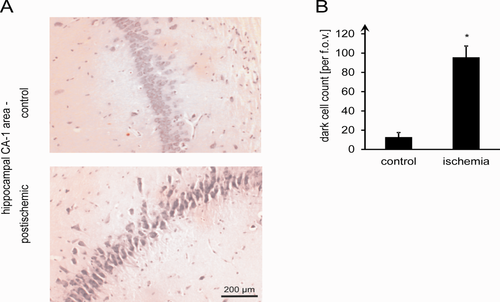
The fourth series of experiments was designed to impose stress on the tissue, which did not prevent it from regaining at least part of its electrophysiological activity immediately after ischemic simulation. It was, however, also meant to induce changes that should secondarily lead to cell death. For this, ischemic simulation was reversed exactly 2 min after AD. Under such conditions, EP measurements showed an almost dichotomous development. Among 24 experiments, nine yielded still complete EP recovery or even increased EP amplitudes, another nine showed seriously diminished EP amplitudes (<20%) after reconstitution of substrate supply, and the remaining six were scattered in between. Mean EP recovery was 72% ± 13% (mean ± SEM), which was not a significant reduction compared with starting conditions (rank sum test; P = 0.14). However, histological examination of the hippocampal CA1 area, having undergone this stress paradigm, consistently showed highly significant damage. The number of dark neurons identified by neuronal shrinkage, cytoplasmic eosinophilia, nuclear pyknosis, and surrounding spongiosis (Jafarian et al., 2010; Fig. 3A) increased significantly compared with the control slices (95.7 ± 11.7 per f.o.v.; n = 6) and in comparison with the handling controls (n = 4; 12.8 ± 4.7, mean ± SD; two-sample t-test, P = 0.001; Fig. 3B). Figure 4A,B shows absolute amino acid concentrations vs. DC recording, with Figure 4C,D presenting normalized amino acid measurements. Whereas ASP, TAU, GABA, and to a lesser extent ALA showed clear concentration increases, GLU and GLN were not significantly changed (Fig. 4C). Normalized maximum amino acid levels from each single experiment (irrespective of the time at which they occur) are computed in Figure 4D. It is only in this compilation of “worst cases” that statistical significance is reached for GLU (Fig. 4C,D; rank sum tests, P < 0.05), whereas absolute increases remain relatively small (<40%). Histological damage after ischemic simulation is not reliably predicted by changes of interstitial glutamate.
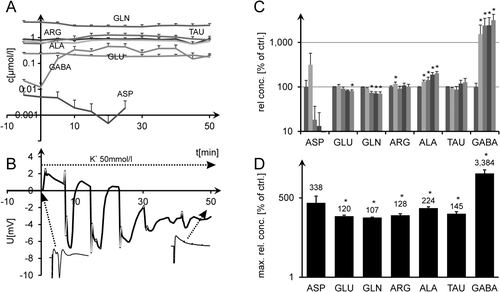
Finally, we subjected hippocampal tissue slices to various (10, 50, and 100 mmol) K+ concentrations. Neither electrophysiological registrations nor amino acid detections were significantly influenced by 10 mmol K+ (n = 5). 50 mmol K+ (n = 6) led to massive GABA release (about 30 times normal; Fig. 5C; rank sum tests, P < 0.001) and slightly elevated ALA (P < 0.001). ASP was elevated at t = 5 min (three times normal, with too high a variance to render this significant) but then was quickly suppressed below levels of measurability. The release of the other amino acids remained unchanged (TAU, ARG) or was even slightly suppressed over the course of the experiment (GLU, GLN). Again, it is only after all normalized maximum values are compiled that small significant increases can be seen for all analytes except ASP (rank sum tests, Fig. 5D). All slices subjected to this concentration showed spreading depression-like DC oscillations with phase durations of 4.8 ± 0.2 (SEM) min (representative example Fig. 5A,B) and steadily decreasing amplitudes. 100 mmol K+ released GABA and TAU, with DC potential returning to zero after short hyperpolarization and EP being quickly suppressed (data not shown).
DISCUSSION
Microdialysis is used to monitor changes in the composition of the extracellular fluid in living tissue, measuring the concentrations of small molecules such as neurotransmitters, hormones, ions, or peptides. It has developed rapidly into a tool for monitoring physiological and pathophysiological changes in neuronal tissues (Gorji et al., 2006). The first microdialytic amino acid transmitter measurements in organotypic hippocampal slices were reported by Robert and coworkers (1997). They were able to register GLU release after K+-induced depolarization and after high-frequency electrical stimulation by a microdialytic technique. With a highly specialized online determination technique, their time resolution reached down to 30 sec. Gören et al. (2001) found comparable GLU release after K+ pulses in human hippocampal tissue; additionally, they were able to demonstrate significant GABA release. There seems to have been no further application of their techniques in clinically relevant hypoxia or ischemia models. Additionally, there is increasing evidence that glial elements of the central nervous system have an active part in dealing with physiologic as well as pathophysiologic circumstances. TAU is mainly harbored within astrocytes (Pow et al., 2002) and released under a number of neurotoxic circumstances, which is considered to have neuroprotective effects (Saransaari and Oja, 2000). The mechanisms probably involve not only a role as an osmolyte but also active and possibly specific modulation of glutamate-induced excitotoxicity (Huxtable, 1992; Wu and Prentice, 2010).
To include this and further amino acids in the analytic range of the model, the fast but highly selective techniques used for the aforementioned experimental series required a replacement. Conventional reversed-phase gradient HPLC with precolumn derivatization proved sufficient for time resolution down to 5 min (we have actually reached 2.5 min in other experiments) and was able to include a series of further amino acids.
There are several limitations to the method of microdialysis, which can be dealt with only partially by statistics. Main determinants of the microdialytic setup are length, diameter, and cutoff of the probe as well as composition and perfusion rate of the dialysate. Although the latter can be controlled by proper preparation, even a series of industrially manufactured standard probes like the ones used for our experiments may show considerable variance of compound recovery (e.g., Rambeck et al., 2006; recovery of antiepileptic drugs from brain interstice). Next, compound concentrations and sample volumes tend to be minute, and any effort to increase one will diminish the other. Most experiments have used concentric probes placed on the tissue. Though conserving tissue integrity, this will lead to further dilution of the dialysate. In our experiments, the tissue showed normal electrophysiological behavior even though we put a 0.24-mm probe right into the tissue and thus subjected it to a certain amount of shearing. As has been shown in other settings (Bingmann et al., 2000), moderate tissue shearing does not seem to have adverse short-term effects on ensuing electrophysiological measurements, and amino acid levels stabilize quickly after tissue probe placement in vivo (Timmerman et al., 1999; Gorji et al., 2005).
We have found no specific data concerning the sampling diameter of the CMA 11 probe under the given conditions within CNS tissue. Theoretical notions (Bungay et al., 1990; Chefer et al., 2009) concerning the “penetration distance” of concentric microdialytic probes involve the extracellular tissue volume fraction (estimated 20% in the CNS), deviations from ideal diffusibility (also termed “tortuosity”) of an analyte resulting from tissue structure (e.g., fiber tracts), and changing rates of analyte release and clearance. These variables remain at least partially imponderable in most microdialysis setups even under steady-state conditions. Ischemia simulation most likely will add changes during the course of the experiments reported herein. Restriction to analysis of relative changes in extracellular neurotransmitter levels (such as by normalization of Figures 2C,D, 4C,D, and 5C,D) appears to be an accepted way to evade these problems partially (cf. Chefer et al., 2009), although it remains difficult to account for manipulation-induced parameter changes. Even without exact values for any of these variables, it may be estimated from other data (Diczfalusy et al., 2013) that the potential sampling distance will surpass the thickness of the tissue layers above and below the probe, so the aCSF flow within the interface chamber harboring the slices will dilute the dialysates. On the other hand, one may expect the area affected by transmitter drain into the microdialysis probe to overlap with the region in which DC and EP are recorded. This overlap, however, obviously does not significantly interfere with either measurement (Fig. 1).
Probe localization within different histological areas may be another issue, because we used a probe with large dimensions compared with the slice (membrane diameter 0.24 mm, length 3 mm). The dialysates in our experiments were therefore collected from several regions of the slice, including neuronal as well as glial zones. Smaller, custom-made probes, which would measure in more closely defined regions, are available, but this would again render the samples even more susceptible to contamination or unwanted losses and include the need to refine detection techniques further. Therefore, some compromises have to be found when measuring with this technique. Normalization and greater numbers of experiments will partially compensate for the effects of varying probe recovery and placement, but normalization does not help if amino acid levels are not detectable under reference conditions. Nevertheless, our measurements are in good qualitative accordance with similar findings from in vivo settings; therefore, we deem our choice of parameters adequate, at least for orienting measurements in an in vitro setup.
We used acute ex vivo hippocampal slices for reasons of comparability with earlier experiments; apart from this, examination of human tissue will regularly involve fresh tissue (Gorji et al., 2006). Any type of tissue-forming culture would, however, be expected to be amenable to this technique as well.
In good accordance with a series of other experiments, this study did not show any significant changes of interstitial amino acids during or after low-frequency electrical stimulation that led to orthodromically evoked, easily measurable sum potentials in the pyramid layer. There are several related explanations for this. Under physiologic circumstances, the transmitter (i.e., GLU in this region) is released in low concentrations and quickly cleared from the synaptic cleft, which in addition is well isolated from the interstitial space by glial processes. Only high-frequency stimulation well outside physiologic limits seems to be able to provoke measurable GLU increases within the interstice (Timmerman and Westerink, 1997; Timmerman et al., 1999; Obrenovitch et al., 2000). It is important to note that GLU concentrations in the dialysates are easily measurable but do not seem to be closely connected to physiological bioelectric activity.
Unreversed substrate withdrawal leads to marked amino acid release to the hippocampal interstice. One of the first and foremost ischemia markers is TAU, pointing toward the glia being involved in trying to attenuate osmotic changes after breakdown of the resting membrane potential. TAU release was also recorded after transient ischemic simulation. Experiments with native slices (i.e., unaffected by possible, however unlikely, effects of probe placement; cf. first and second experimental series) showed that reversed chemical ischemia was able to induce significant histological damage. This, however, was predicted neither by additional electrophysiological recording nor by interstitial GLU concentration measurements alone. The lack of an increase in GLU concentration probably is due to the same mechanisms that are responsible for clearing GLU released by physiologic activity and that are obviously not overloaded by the chosen regime of quickly reversible substrate depletion. Clinically, microdialysis has become a routine method of intensive care monitoring after brain trauma or bleeding, even though the significance of the measurements had been only partially elucidated when the method was introduced. Standard setups include 30-min measurements of lactate, pyruvate, glucose, and glutamate. Although the lactate–pyruvate ratio seems to be generally accepted as a weak predictor, the therapeutic relevance of interstitial glutamate levels has remained unclear (Tisdall and Smith, 2006). From our results, low-frequency measurements of interstitial GLU would seem pointless in clinical settings when trying to counteract cerebral ischemic events by timely intensive care measures, because GLU rises only after at least part of the damage has already been done.
To compare our model with existing models, we also used elevated K+ as a pathophysiologic stressor. Electrophysiological as well as biochemical measurements showed qualitative and quantitative differences in comparison with actual ischemic simulation. GABA is released into the interstitial space after K+ stress in much higher amounts than after ischemia, whereas other amino acid levels are much less influenced by K+.
It seems to be of some importance that interstitial microdialysis measurements take place in a compartment distinct from the synaptic cleft and thus are only loosely connected to physiologic electrical activity. This is why our measurements do not interfere with excitotoxic theories of neuronal death during or after ischemic stress. More likely, they represent a possibility to inquire into glial functions during such states. Early, rapid, and high-amplitude changes of extracellular TAU, which can be easily measured with the technique, rather point in this direction.
In conclusion, simultaneous electrophysiological and microdialytic measurements are possible in vitro and can be reproducibly performed during ischemic simulation. Our measurements do not point toward a decisive diagnostic role of interstitial GLU measurements in standardized clinical settings, because ischemia-induced damage can be histologically demonstrated in brain tissue without this being mirrored in GLU measurements. K+ pulses do not seem to be an adequate substitute for ischemic simulation, because biochemical (and electrophysiological) reactions of the tissue are different, at least in an interface setup (which is generally deemed to be more of an accurate setting for such experiments).
ACKNOWLEDGMENTS
The authors thank Prof. Dieter Kuhlmann, Münster, whose advice concerning HPLC techniques has been invaluable to us. The authors have no conflicts of interests.


