Integrated serum proteomic and N-glycoproteomic characterization of dengue patients
Abstract
Dengue fever is a mosquito-borne viral disease caused by the dengue virus (DENV). It poses a public health threat globally and, while most people with dengue have mild symptoms or are asymptomatic, approximately 5% of affected individuals develop severe disease and need hospital care. However, knowledge of the molecular mechanisms underlying dengue infection and the interaction between the virus and its host remains limited. In the present study, we performed a quantitative proteomic and N-glycoproteomic analysis of serum from 19 patients with dengue and 11 healthy people. The results revealed distinct proteomic and N-glycoproteomic landscapes between the two groups. Notably, we report for the first time the changes in the serum N glycosylation pattern following dengue infection and provide abundant information on glycoproteins, glycosylation sites, and intact N-glycopeptides using recently developed site-specific glycoproteomic approaches. Furthermore, a series of key functional pathways in proteomic and N-glycoproteomic were identified. Collectively, our findings significantly improve understanding of host and DENV interactions and the general pathogenesis and pathology of DENV, laying a foundation for functional studies of glycosylation and glycan structures in dengue infection.
1 INTRODUCTION
Dengue virus (DENV) belongs to the genus Flavivirus within the family Flaviviridae and is classified into four distinct but closely related serotypes (DENV-1, DENV-2, DENV-3, and DENV-4).1 DENV has a single-stranded, positive-sense RNA genome of approximately 11 kb that harbors a single open reading frame (ORF) encoding a large polymeric protein.2 This polyprotein can be cleaved by host or viral proteases to produce structural (C, prM/M, and E) and nonstructural (NS1-NS2A-NS2B-NS3-NS4A-NS4B-NS5) proteins.3 Nearly half of the world's population is considered at risk of dengue, with an estimated 100–400 million infections occurring each year.4 Although most patients with dengue have asymptomatic or mild disease, some can develop severe disease, such as hemorrhagic fever and shock syndrome.5 Several factors, including virus serotype, epidemiology, host immune response, and genetic factors, can influence the clinical presentation and severity of the disease. To date, there is no specific antiviral treatment for dengue, and the available vaccines have their limitations.3, 6 The molecular mechanisms underlying DENV pathogenicity remain poorly understood and thus require further exploration.
Proteomics is used to detect differential expression of proteins and their interactions in cells or tissues. Several studies have utilized proteomics to investigate the cellular responses to infection by pathogens such as SARS-CoV-2, ZIKV, influenza virus, and DENV.7-11 These studies have contributed to the understanding of the mechanisms underlying pathogenesis and the identification of novel biomarkers for disease diagnosis, in addition to providing novel therapeutic targets. To date, several studies have performed proteomic profiling of DENV-infected mammalian cells (Huh7, A549, and K562),12-14 insect cells, and blood samples of dengue patients11, 15; these have provided valuable large-scale protein-related information for elucidating the functions of host cell proteins upon DENV infection. However, proteins usually undergo posttranslational modifications (PTMs) such as glycosylation, phosphorylation, ubiquitination, and methylation, which underlie their functional specificity.16 Thus, the analysis of PTMs may lead to the discovery of additional relevant functions of host proteins in disease.
Among the numerous PTMs, glycosylation is the most important and widely distributed. This modification plays an important role in the maintenance of normal organismal physiological function, and nearly half of all proteins can be glycosylated in vivo.17, 18 Glycosylation can be divided into N-glycosylation and O-glycosylation. N-glycosylation usually occurs on the side chain amino group of asparagine (N), normally at N-X-S/T motifs, and rarely also at N-X-C/V sites (X represents a random amino acid residue except for proline; S, T, C, and V represent serine, threonine, cysteine, and valine, respectively).19 Aberrant protein N-glycosylation has been tightly linked to many diseases, including cancer and infectious disease.20 Accordingly, N-glycoproteomics is currently a key area in protein modification omics research. Mapping the N-glycosylation landscape will open new avenues for exploring disease mechanisms and identifying novel therapeutic targets. For example, aberrant N-glycosylation has been implicated in the pathogenesis of Alzheimer's disease (AD), providing new molecular and system-level insights for understanding and treating AD.21 Besides, the glycosignatures in human serum can be used to distinguish different clinical stages of liver diseases such as hepatitis B, cirrhosis, and hepatocellular carcinoma, as well as to identify biomarkers specific to these diseases.22 Meanwhile, one study demonstrated that synaptic vesicles (SV) harbor a distinct population of oligomannose and highly fucosylated N-glycans, and that high levels of fucosylation are a feature of SV proteins and other molecules related to synaptic function and development.23 Notably, several studies have demonstrated that the N-glycosylation of DENV envelope protein or NS1 can affect viral transmission, replication, virulence, and pathogenesis.24-26 However, the changes in N-glycosylation that occur in the serum of patients with dengue following DENV infection have yet to be reported. Knowledge of these alterations has the potential to deepen our understanding of dengue infection and to lead to the identification of novel biomarkers and pharmaceutical targets for this disease. Nevertheless, given the complexity of glycan structure and the lack of appropriate research methods, N-glycoproteomics-based studies have remained challenging, especially those involving the analysis of site-specific glycosylation.27, 28
In this study, we systematically investigated the proteomic and N-glycosylation profile in serum samples of 19 dengue patients and 11 healthy controls. A library-free data-independent acquisition (DIA) quantitative proteomics strategy was used to uncover critical pathogen-induced changes in host protein expression. Moreover, a site-specific N-glycoproteomic approach combined with liquid chromatography-tandem mass spectrometry (LC-MS/MS) analysis was used for in-depth characterization of the glycan structures at each glycosylation site of glycoproteins. Finally, we undertook a functional analysis to clarify the functional categories of the identified differentially regulated proteins and glycoproteins. Together, the proteomics and N-glycoproteomics data generated in our study provide a valuable resource for better understanding the pathogenesis of DENV infection as well as DENV/host interactions.
2 MATERIALS AND METHODS
2.1 Sample collection and ethics statement
Blood for serum collection was obtained from 19 patients with dengue and 11 healthy donors at Shenzhen Third People's Hospital, Guangdong Province, China, in accordance with the World Health Organization 2010 recommendations. Initial dengue diagnoses were performed by real-time RT-PCR (MABSKY). Additionally, dengue serotyping was conducted, and results revealed that the DENV-2 serotype was more commonly observed, followed by DENV-4 (data not shown). This study was approved by the Ethics Committee of Shenzhen Third People's Hospital (2021-002) and performed in compliance with the principles of the Declaration of Helsinki. All patients provided signed informed consent. Basic information on the dengue patients and healthy donors is given in Table S1. Fresh blood samples were harvested by venipuncture and collected in vacutainer tubes containing separator gel (Genobio), followed by centrifugation at 1300 × g for 10 min to obtain serum. The isolated serum was stored and transported at −80°C.
2.2 Sample preparation for proteomic
For protein extraction, serum samples were centrifuged at 12 000 × g for 10 min at 4°C to remove cellular debris, and the supernatant was transferred to a new centrifuge tube. The protein concentration was determined with a BCA kit (Beyotime) according to the manufacturer's instructions. For trypsin digestion, 50-µL serum sample was added to prewashed magnetic beads (PTM-00F13303; Jingjie PTM BioLab (Hangzhou) Co. Inc.) and incubated on a constant temperature mixer at 1200 rpm for 1 h at 37°C. The beads were then washed three times with washing buffer. Next, 70 μL of enzymatic hydrolysis buffer was added to the magnetic beads, followed by mixing and heating at 95°C for 10 min. Subsequently, the samples were cooled to room temperature and incubated with trypsin (Promega; final concentration: 20 ng/µL) at 37°C overnight. The protein solution was reduced with 5-mM dithiothreitol (DTT) for 30 min at 56°C and alkylated with 11-mM iodoacetamide (IAM) for 15 min at room temperature in the dark. Finally, the peptides were desalted by C18 SPE column as specified by the manufacturer, dried under vacuum, and frozen until used for LC-MS/MS analysis.
2.3 Proteomic analysis by LC-MS/MS
The tryptic peptides were dissolved in solvent A (0.1% formic acid and 2% acetonitrile in water) and separated by EASY-nLC 1200 UPLC system (Thermo Fisher Scientific). The mobile phase consisted of solvent A and solvent B (0.1% formic acid and 90% acetonitrile in water). The peptides were separated using the following elution gradient: 0–16 min, 6%–20% B; 16–24 min, 20%–32% B; 24–27 min, 32%–80% B; 27–30 min, 80% B. The flow rate was kept constant at 500 nL/min. Mass spectrometry was conducted in an Orbitrap Exploris 480 mass spectrometer equipped with a nano-electrospray ionization source. The electrospray voltage applied was 2100 V. Precursors and fragments were analyzed using the Orbitrap detector. The full MS scan resolution was set to 30 000 for a scan range of 350–1050 m/z. The MS/MS scan was fixed first mass as 200 m/z at a resolution of 450 000. The data acquisition mode employs the DIA program. Following the initial scan, HCD fragmentation was performed at normalized collision energies of 25%, 30%, and 35%. Automatic gain control (AGC) target was set at 3E6 and the maximum injection time was set to Auto.
The DIA data were processed using DIA-NN search engine (v.1.8). Tandem mass spectra were searched against Homo_sapiens_9606_SP_20230103. fasta (20 389 entries) concatenated with a reverse decoy database. Trypsin/P was specified as cleavage enzyme allowing up to 1 missing cleavages. N-terminal Met excision and carbamidomethylation of Cys were specified as fixed modifications. The false discovery rate (FDR) was adjusted to <1%.
2.4 Sample preparation for N-glycoproteomics
Protein extraction was carried out as described above, and the volume was adjusted for consistency with the lysis buffer. The protein solution was reduced with DTT at a final concentration of 5 mM for 30 min at 56°C and alkylated with 11-mM IAM for 15 min at room temperature in the dark. The alkylated samples were transferred to ultrafiltration tubes for filter-aided sample preparation digestion. Once the sample had been concentrated by centrifugation at 12 000 × g at room temperature for 20 min, 8-M urea was added to the tubes, and this step was repeated three times. Then, the urea was replaced with 200-mM tetraethylammonium bromide, and this step was also repeated three times. Trypsin was subsequently added at 1:50 trypsin-to-protein mass ratio for digestion overnight. Peptides were recovered by centrifugation at 12 000 g for 10 min at room temperature, repeating twice with ddH2O.
The tryptic peptides were redissolved in 200 μL of enrichment buffer (80% ACN, 5% trifluoroacetic acid [TFA]) and then loaded onto the hydrophilic (HILIC, click maltose) microcolumn. After centrifugation at 4000 × g for 15 min, the HILIC microcolumn was washed three times with enrichment buffer. The glycopeptides were eluted twice with 0.1% TFA, 50-mM ammonium bicarbonate, and 50% ACN, desalted using C18 Zip Tips according to the manufacturer's instructions, and then dried for MS analysis.
2.5 N-glycoproteomics analysis by LC-MS/MS
The tryptic peptides were dissolved in solvent A (0.1% formic acid and 2% acetonitrile in water) and directly loaded onto a home-made reversed-phase analytical column (25 cm length, 100-μm i.d.). Separation was performed on an EASY-nLC 1200 UPLC system (ThermoFisher Scientific). The mobile phase consisted of solvent A and solvent B (0.1% formic acid, 90% acetonitrile in water). Peptides were separated using the following gradient: 0–7.5 min, 2%–7% B; 7.5–71.5 min, 7%–20% B; 71.50–84 min, 20%–30% B; 84–87 min, 30%–80% B; 87–90 min, 80% B, all at a constant flow rate of 500 nL/min. The peptides were submitted to NSI source and analyzed by tandem mass spectrometry (MS/MS) in an Orbitrap Exploris 480 mass spectrometer equipped with a nano-electrospray ionization source. The electrospray voltage applied was 2100 V. Precursors and fragments were analyzed in the Orbitrap detector. The full MS scan resolution was set to 120 000 for a scan range of 700–2000 m/z. The MS/MS resolution was 30 000 at 100 m/z and the TurboTMT was set to off. The data acquisition mode employs the data-dependent scanning program. Following the initial scan, up to 15 most abundant precursors were then selected for further MS/MS analyses with 15 s dynamic exclusion. HCD fragmentation was performed at NCEs of 20%, 30%, and 40%. AGC target was set at 200%, with an intensity threshold of 25 000 ions/s and a maximum injection time of 200 ms.
The MS data were processed using MSFragger (v.3.4) software. The search parameters were set as follows: the database was Homo_sapiens_9606_SP_20230103. fasta (20 389 sequences) and the false positive rate (FDR) due to random matching was calculated based on a reverse decoy database. Trypsin/P was used for enzyme digestion. Searches were performed allowing a maximum of two missed cleavages, a minimum peptide length of seven amino acid residues, and a maximum of three peptide modifications. The mass error tolerance of primary parent ion and secondary fragment ion was set at 20 ppm. Carbamidomethyl on Cys was set as a fixed modification, while protein N-terminal acetylation and oxidation of Met were specified as variable modifications. Mass offsets were set to a list of glycosylation modifications. The FDR for protein and PSM identification was adjusted to <1%.
2.6 Functional enrichment analysis
Gene ontology (GO, http://www.geneontology.org) analysis and Kyoto Encyclopedia of Genes and Genomes (KEGG, http://www.kegg.jp/kegg/pathway.html) pathway enrichment analysis were applied to the multiple differentially expressed protein sets using the R package clusterProfiler. To reduce redundancy, the enrichGO analysis was followed by the “simplify” function as suggested by the author.29 The GO categories include cellular component (CC), molecular function (MF), and biological process (BP). An adjusted p-value of <0.05 was defined as indicative of statistical significance. The WolF PSORT software was applied to predict subcellular localization to annotate the submitted proteins.
2.7 Motif analysis
The motif characteristics of N-glycosylation sites were analyzed using MoMo (motif-X algorithm) software. The peptide sequences consisting of 10 amino acids upstream and downstream of all identified modification sites were analyzed. All the protein sequences in the database were used as background database parameters. When the number of peptides containing a specific sequence was >20 and the p-value was <0.000001, the characteristic sequence of the modified peptide was considered to be a motif. The calculation method was as follows: (the number of peptides identified with a certain motif/the number of peptides identified as being N-glycosylated)/(the number of peptides identified with this motif in the database/the number of theoretical peptides in the database in which N-glycosylation occurs).
2.8 Data analysis
Fisher's exact test was used to analyze the significance of functional enrichment of differentially expressed proteins and intact N-glycopeptides (IGPs) (using the identified protein as the background). Principal component analysis (PCA) was conducted with the prcomp function (R) on the normalized data. Pearson correlation coefficient (PCC) was calculated by dividing the covariance of two variables by the product of their standard deviations. Relative standard deviation (RSD) was calculated based on the standard deviation and mean of the data. Functional terms with fold enrichment > 1.5 and a p-value < 0.05 were considered significant. The ggplot2 (v.3.3.6) and ggrepel (v.0.9.1) packages were used to generate volcano plots and the pheatmap (v.1.0.12) package was used to create heatmaps.
3 RESULTS
3.1 Qualitative and quantitative proteomics
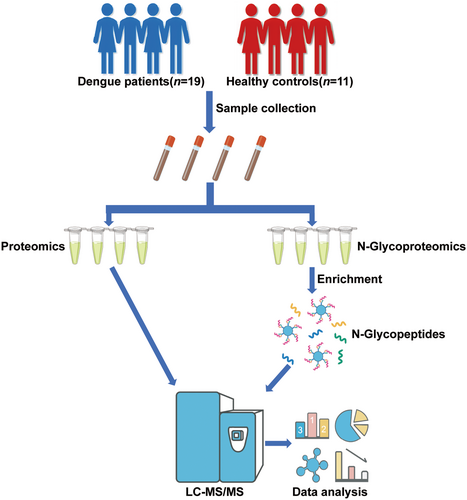
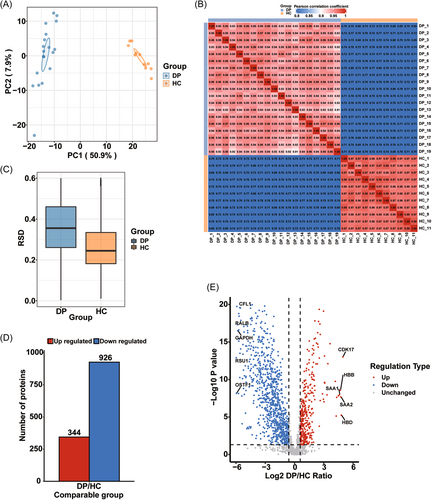
The proteins showing differential expression in the serum of dengue patients compared with that in healthy controls were identified by library-free DIA quantitative proteomics. A spectral library was built specifically for this study (Figure 1). PCA, PCC, and RSD score plots demonstrated that the proteomics profiles of the two groups could be well separated (Figure 2A–C, respectively). The lengths of most of the identified peptides were distributed in the 7–20 amino acid range and met the quality control criteria (Figure S1A). We identified a total of 2966 proteins in both groups, 2122 of which were quantified (Figure S1B). Detailed information on the identified proteins is shown in Table S2. A total of 1,270 proteins were significantly differentially expressed using a fold change value > 1.5 and a p-value < 0.05 as the selection criteria; of these, 344 were upregulated and 926 were downregulated (Figure 2D,E). The data are listed in detail in Table S3. Subcellular localization classification analysis of these differentially abundant proteins revealed that most were localized to the cytoplasm (390; 34 upregulated and 356 downregulated), extracellular region (373; 207 upregulated and 166 downregulated), and nucleus (267; 38 upregulated and 229 downregulated) (Figure S1C). Subsequent N-glycoproteomic site mapping data were normalized to the expression of the corresponding protein based on the proteomics data.
3.2 Functional analysis of the differentially expressed proteins identified in the proteomic analysis
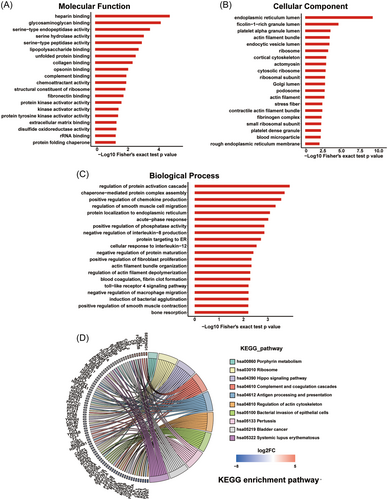
GO and KEGG functional enrichment analyses were carried out to clarify the function of the differentially expressed proteins identified in the proteomic analysis. The 20 most significant GO terms in the MF, CC, and BP categories are shown in the bar chart in Figure 3. The results showed that heparin binding, glycosaminoglycan binding, serine-type endopeptidase activity, and serine hydrolase activity were the top enriched terms in the MF category (Figure 3A). Endoplasmic reticulum lumen, ficolin-1-rich granule lumen, platelet alpha granule, and lumen actin filament bundle were identified as being significantly enriched in the CC category (Figure 3B). Meanwhile, the proteins showing significantly altered expression in the BP category were involved in regulation of protein activation cascade, chaperone-mediated protein complex assembly, positive regulation of chemokine production, and regulation of smooth muscle cell migration (Figure 3C). In the KEGG enrichment analysis, the overrepresented pathways included antigen processing and presentation, complement and coagulation cascades, systemic lupus erythematosus, regulation of actin cytoskeleton, and ribosome (Figure 3D). Meanwhile, the differentially expressed proteins were categorized into four groups (Q1–Q4) based on fold changes in expression (Figure S1D), and GO and KEGG functional enrichment analysis was performed to determine the functional similarities among the proteins in the four groups (Figure S2). The results indicated that many functional pathways enriched by upregulated proteins (Q3 and Q4) differed from those enriched by downregulated proteins (Q1 and Q2), with few pathways containing both upregulated and downregulated proteins. For example, the most significantly enriched BP by upregulated proteins was acute-phase response, whereas downregulated proteins were enriched in positive regulation of organelle organization. Additionally, functions enriched by proteins with different fold change also varied in the upregulated or downregulated protein groups.
3.3 Identification and quantification n-glycosylation sites
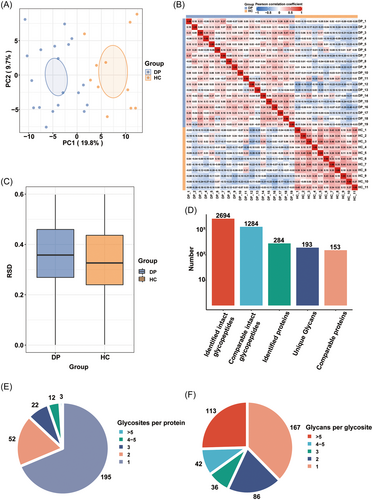
By using well-established N-glycoproteomics approaches for identifying site-specific N-glycosylation coupled with LC-MS/MS, we obtained a large amount of glycosylation-related information on glycosylation site, IGPs, and glycoproteins. PCA, PCC, and RSD score plots confirmed the reliability of the N-glycoproteomics data (Figure 4A–C, respectively) and that the data could be used for further analysis. Besides, most of the hydrolyzed peptides contained 2–3 charges, and the peptide length distribution ranged from 7 to 20 amino acids, which conforms to the general rule based on enzymatic hydrolysis and the MS fragmentation mode (Figure S3A). A total of 2694 intact IGPs from 284 glycoproteins were identified, 1284 of which (from 153 proteins) were quantified (Figure 4D). Further analysis showed that among the 284 identified glycoproteins, 195 contained only one glycosylation site, while 52 contained two glycosylation sites, indicating that the glycoproteins in the serum were heterogeneous (Figure 4E). Additionally, approximately 60% of the identified N-glycosylation sites were found to contain more than one N-glycan (Figure 4F). We also verified our N-glycoproteome data in the UniProt database and found that approximately 74% of the 444 N-glycosylation sites identified in this study are annotated in UniProt. Most of the 329 UniProt-annotated glycosylation sites have been previously reported in the literature (Figure S3B). In conclusion, the site-specific N-glycosylation analysis revealed the extent of heterogeneity in the glycoproteome. Detailed information is provided in Table S4.
3.4 Motif and glycan type analysis of the n‑glycoproteome
The ability to profile glycosylation sites with intact glycans allows the investigation of system-wide glycosylation patterns. To further explore the glycosylation characteristics of the identified proteins, we analyzed the sequences of the N-glycosylation sites as well as the surrounding 10 amino acids at each terminus and created relative frequency plots. Two conserved motifs, namely, N-X-T (58.3%) and N-X-S (39.1%), were found to be enriched in the analyzed sequences, with X representing any amino acid other than proline, and N, T, and S representing asparagine, threonine, and serine, respectively (Figure 5A). Moreover, we performed the motif analysis separated by glycan type, and the results showed that N-X-T was more prevalent than N-X-S across all five glycan types (Figure S3C). MoMo software was used to show the frequency of amino acid occurrence near the modification sites (Figure 5B). The motif scores, relative frequencies, and other motif-related information are provided in Table S5.
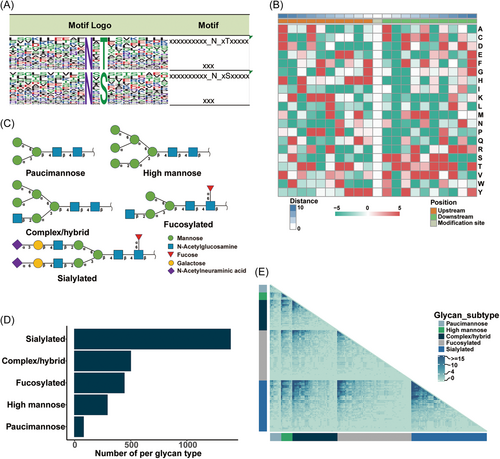
Because there are multiple copies of the same protein in vivo, different glycan types may exist at the same modification site of any given protein. Based on the characteristics of the sugar chains, the identified glycan types were divided into five subtypes,30 namely, paucimannose, high mannose, complex/hybrid, fucosylated, and sialylated (Figure 5C). The results from our N-glycoproteomic data set indicated that sialylation was the most observed glycosylation pattern in the serum, while high-mannose glycans were present in low proportions (Figure 5D). This finding is consistent with the previous study.22 As 277 of the identified glycoproteins possessed multiple glycosylation sites, we also constructed glycan co-occurrence networks to depict the frequency of co-occurrence between certain glycans across various glycosylation sites. In the glycan co-occurrence heat map (Figure 5E), darker colors represent higher incidences of co-occurrence. Sialylated glycans were observed to frequently co-occur together and also co-occur with several other groups of complex/hybrid and fucosylated glycans. Overall, the N-glycoproteomics data demonstrated that sialylation was the most prevalent glycosylation modification, and that serum glycoproteins exhibited significant heterogeneity.
3.5 Characteristics of intact N-glycopeptides and related glycoproteins
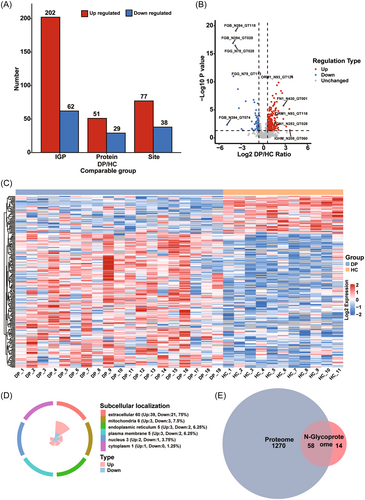
Next, we performed a differential analysis of glycopeptides, glycosylation sites, and glycoprotein abundance between the dengue patients and the healthy controls. To exclude the possibility that any observed changes could be due to altered protein expression, the N-glycoproteomics data were first normalized based on our quantitative proteomics data. A total of 115 differentially regulated N-glycosylation sites (with a fold change > 1.5 and a p-value < 0.05) in 72 proteins were identified in our N-glycoproteomics site mapping analysis (Figure 6A). Notably, some proteins, such as fibrinogen beta chain, clusterin, and immunoglobulin heavy constant mu, simultaneously contained both upregulated and downregulated N-glycosylation sites (Table S6). Moreover, specific glycosylation sites, such as N184 on haptoglobin and N176 on Immunoglobulin heavy constant gamma 2, were found to be either upregulated or downregulated depending on the composition of the detected glycan. Overall, 77 N-glycosylation sites in 51 glycoproteins were found to be significantly upregulated, while 38 N-glycosylation sites in 29 glycoproteins were significantly downregulated. Figure 6B shows a volcano plot of the differentially abundant IGPs using fold change > 1.5 or < 0.667 and a p-value < 0.05 as cutoffs. Additionally, a heatmap of the significantly upregulated and downregulated IGPs was generated to show the expression profiles of the IGPs across all samples, and was depicted in Figure 6C. As expected, subcellular localization analysis revealed that most of the identified glycoproteins were localized to the extracellular region (Figure 6D). This result was highly consistent with the biological function of glycoproteins, but somewhat different from the proteomics results, in which proteins were observed to be located in both the cytoplasm (30.71%) and extracellular region (29.37%) (Figure S1C). Furthermore, when we compared the differentially expressed proteins identified in the proteomic analysis with the significantly regulated glycoproteins found in the N-glycoproteomic analysis, we found that 58 proteins were shared between the two data sets (Figure 6E), except for APOB, AZGP1, BST1, C4BPA, CNDP1, CSTA, ENPP3, GC, GRN, HRG, KNG1, MFAP4, PRG4, and PSAP, which were only identified in the N-glycoproteomic analysis. This indicated that the functions of these proteins were altered, probably by aberrant N-glycosylation. Detailed information regarding the regulated IGPs, N-glycosylation sites, and glycoproteins is provided in Table S6.
3.6 Functional analysis of the N-linked glycoproteins
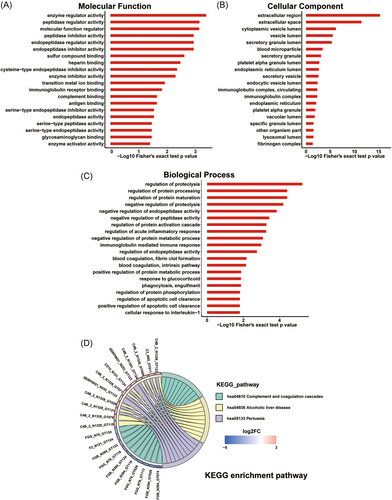
We performed GO and KEGG functional enrichment analyses of the significantly regulated N-glycopeptide-related proteins. GO enrichment analysis showed that these proteins were mainly enriched in enzyme regulator activity, peptidase regulator activity, MF regulator, and peptidase inhibitor activity in the MF category (Figure 7A). For the CC category, we noted that the proteins were enriched in extracellular region, extracellular space, and cytoplasmic vesicle lumen (Figure 7B), which was consistent with the results of the subcellular localization analysis. Meanwhile, for the BP category, the glycoproteins were found to be enriched in regulation of proteolysis, regulation of protein processing, and regulation of protein maturation (Figure 7C). In the KEGG pathway analysis, the significantly regulated glycoproteins were highly enriched in complement and coagulation cascades (Figure 7D), given many complement-related proteins, such as complement C2, complement C3, and C4b-binding protein alpha chain (C4BPA), were dysregulated. In addition, we separated the differentially regulated glycosylated proteins into five groups based on the glycan type, and performed GO and KEGG functional enrichment analyses to determine the function of the proteins in the different groups (Figure S4). The results showed that the enriched functions were mainly linked to glycoprotein sialylation, high mannose, and complex hybrid, with only a few functions related to glycoprotein paucimannose. This could be attributed to the low abundance of paucimannose glycans (Figure 5D). Within the BP category, proteins with varying glycan types were enriched in distinct terms. Additionally, certain terms in the CC category and pathways identified in KEGG functional analysis were simultaneously enriched by proteins with different glycan types. This may be due to the presence of multiple sugar types in these proteins. In conclusion, these findings suggested that protein glycosylation plays a significant role in the host response to DENV infection.
4 DISCUSSION
In this study, we utilized library-free DIA quantitative proteomics and N-glycoproteomics to obtain an unbiased profile of the host response to DENV infection. Quantitative proteomics analysis identified 1270 proteins that were significantly differentially expressed in serum between dengue patients and healthy controls. Moreover, we presented, for the first time, the serum N-glycoproteomes of dengue patients and healthy people. We identified 1260 IGPs derived from 481 glycosylation sites on 334 N-glycosylated proteins. Of the 1260 IGPs, 264 exhibited differential regulation. We further analyzed the motifs and glycan types of the identified N-glycosylated peptides and performed functional enrichment analysis of the differentially expressed proteins and glycoproteins to identify significantly enriched GO terms and KEGG pathways. Consequently, our study provides an important resource for the continued exploration of the mechanisms underlying dengue pathology and the discovery of novel prognostic and therapeutic glycomarkers for the disease.
Relatively little is known regarding the host's response to DENV infection, with current findings limited to the cellular level. In this study, using library-free DIA quantitative proteomics, we acquired the most extensive information on the serum proteome of dengue patients reported to date. Several significantly differentially expressed proteins were identified, such as FCGR3B and BCL10. FCGR3B, also known as CD16, is a low-affinity receptor for the Fc region of immunoglobulin gamma (IgG) and may be involved in capturing immune complexes in the peripheral circulation.31, 32 Single-cell transcriptome analysis revealed that FCGR3B is upregulated in patients with severe COVID-19, indicating that it may be involved in the recruitment and activation of other immune cells at the site of infection.33, 34 Notably, in this study, the expression of FCGR3B was almost undetectable (2/11) in healthy controls, but was detected in all the dengue patients (19/19), implying that it plays a crucial role in the host immune response against DENV infection. In contrast to FCGR3B, BCL10 was barely detectable in dengue patients (3/19) but was found in the serum of all the healthy controls (11/11). BCL10 contains a caspase recruitment domain and has been shown to induce apoptosis and activate NF-κB.35 The TRIM41-mediated Lys63-linked polyubiquitination of BCL10 serves as a hub for the recruitment of NF-κB essential modulator (NEMO) and is critical for subsequent NEMO-dependent activation of NF-κB and IRF3.36 This suggests that the DENV infection-induced downregulation of BCL10 may inhibit the host's innate antiviral response. Overall, our findings imply that these differentially expressed proteins may play an important role in the process of DENV infection; however, the underlying mechanisms require further investigation.
Recent developments in fragmentation strategies, MS instrumentation, and high-throughput workflows have made analyzing intact glycoproteins a possibility.37-39 In this study, we utilized the site-specific N-glycoproteomic approach to accurately characterize glycoproteins containing both glycosylation sites and attached glycan structures. The N-glycoproteomics data were normalized based on our quantitative proteomics data. Thus, a total of 264 IGPs at 115 N-glycosylation sites in 74 glycoproteins were successfully identified as being abnormally expressed in dengue patients in our study. Examination of the subcellular localization of these glycoproteins showed that they were mainly localized to the extracellular space (55/72), consistent with the fact that most proteins in an extracellular environment undergo N-linked glycosylation. Moreover, the characteristics and profiles of IGPs on these glycoproteins were also analyzed. Attractin (ATRN) has been demonstrated to play a significant role in the initial clustering of immune cells during the inflammatory response and may regulate the chemotactic activity of chemokines.40, 41 In this study, nine glycosylation sites were identified on ATRN, but only three (N731, N1054, and N1073) showed dysregulation in dengue patients. The N731 glycosylation site, with the glycan composition of HexNAc(4)Hex(5)Fuc(1)NeuAc(1), displayed significant upregulation in patients with dengue; however, in the healthy controls, N731 glycosylation in ATRN was almost undetectable (2/11). Moreover, the expression of ATRN did not differ significantly between the two groups based on our proteomics data, suggesting an involvement of ATRN N-glycosylation aberration during DENV infection. Overall, this comprehensive mapping of the serum glycoproteome of dengue patients is currently the largest and most extensive reported to date, and further investigations are warranted to elucidate the functions of N-glycosylation in these proteins upon DENV infection.
The complement system has a dual role during infection: although it protects the host by limiting viral proliferation, overactivation of the system can exacerbate the inflammatory response and cause more severe illness.42, 43 Functional analysis of the proteome and N-glycoproteome demonstrated that complement activation was enriched in patients with dengue. We found that several complement proteins (C2, C3, C4b, and C5) and some complement factors (CFB, CFH, CFHR4, and CFP) were differentially expressed in dengue patients. Notably, the majority of these proteins were upregulated in these individuals, suggesting that DENV infection activates the complement system. In addition, the N-glycoproteomics data revealed that some complement proteins were abnormally glycosylated in the serum of dengue patients. Examples include C2, C3, CFB, CFH, and C4BPA, the latter of which was not identified in the proteomic analysis. Although studies have shown that nearly all complement proteins are glycosylated, little is known about the functional significance of this modification.44 Early studies showed that blocking glycosylation of pro-C4, C2, and CFB inhibited the secretion of the corresponding native complement proteins in cell culture, and also enhanced the catabolism of pro-C4. Additionally, glycosylated pro-C4 was more rapidly catabolized intracellularly.45 Moreover, complement protein glycosylation plays a vital role in the modulation of the immune response.46 Increased complement deposition, along with elevated α2,6-sialylation levels on members of the complement cascade (C5 and C9), was observed in the plasma of patients with severe COVID-19.47 Consequently, we conclude that the N-glycosylation of complement proteins may be involved in host-DENV interaction. Studies on complement protein N-glycosylation are urgently needed to uncover novel mechanisms involved in the host immune response to DENV infection.
Owing to the small sample size in this study, we were unable to analyze the effects of infection with different DENV serotypes on the proteome and N-glycoproteome of dengue patients, as well as the differences between patients with dengue fever and those with the more severe dengue hemorrhagic fever. Follow-up studies are needed to validate the potential of proteins or N-glycoproteins as biomarkers and reveal the role of protein N-glycosylation in dengue pathogenesis.
5 CONCLUSION
To the best of our knowledge, our work is the first to illustrate the host response against DENV infection using integrated proteomics and N-glycoproteomics. We confirmed that DENV infection has a significant impact on host proteins and glycoproteins. Importantly, IGP analysis based on MS allowed us to gather comprehensive information about glycosylation sites and the related glycan types simultaneously, which further helped to determine the corresponding relationship between sugar chains and glycosylation sites. Subsequent research revealed that the differential glycoprotein expression in the serum of dengue patients could be shown as the differential extent of glycosylation at glycosites, as well as the glycan types on the glycosites, reflecting the critical roles that glycosylated proteins play in the host's defense against DENV infection. This work and the generated proteomics and N-glycoproteomics data, which are publicly accessible, offer a valuable resource to further explore the underpinnings the pathogenic mechanism of DENV and as well as discover novel dengue prognostic indicators.
AUTHOR CONTRIBUTION
Xiao Hu designed the experiment and wrote the manuscript. Xiao Hu and Jiamin Song analyzed the data. Guoguo Ye contributed critical ideas and edited the manuscript. Miao Zhu assisted in data analysis and manuscript editing. Jianfeng Lan, Zhiyi Ke, and Lijiao Zeng collected and processed the samples. Xiao Hu and Jing Yuan conceived and supervised the experiments. Jing Yuan revised the manuscript.
ACKNOWLEDGMENTS
This work was supported by the National Major Science and Technology Projects (2021YFC2301800), the Shenzhen Fund for Guangdong Provincial High-level Clinical Key Specialities (SZGSP011), and the China Postdoctoral Science Foundation (2022M711488).
CONFLICT OF INTEREST STATEMENT
The authors declare no conflict of interest.
Open Research
DATA AVAILABILITY STATEMENT
The data that support the findings of this study are available from the corresponding author upon reasonable request. The mass spectrometry proteomics data have been deposited to the ProteomeXchange Consortium via the PRIDE partner repository with the data set identifier PXD052720.


