Improved fluorescence-based assay for rapid screening and evaluation of SARS-CoV-2 main protease inhibitors
Rui Zhang and Haohao Yan contributed equally to this work.
Abstract
The outbreak of coronavirus disease 2019 (COVID-19) pandemic caused by the severe acute respiratory syndrome coronavirus 2 (SARS-CoV-2) is a global threat to human health. In parallel with vaccines, efficacious antivirals are urgently needed. SARS-CoV-2 main protease (Mpro) is an attractive drug target for antiviral development owing to its key roles in virus replication and host immune evasion. Due to the limitations of currently available methods, the development of novel high-throughput screening assays is of the highest importance for the discovery of Mpro inhibitors. In this study, we first developed an improved fluorescence-based assay for rapid screening of Mpro inhibitors from an anti-infection compound library using a versatile dimerization-dependent red fluorescent protein (ddRFP) biosensor. Utilizing this assay, we identified MG-101 as a competitive Mpro inhibitor in vitro. Moreover, our results revealed that ensitrelvir is a potent Mpro inhibitor, but baicalein, chloroquine, ebselen, echinatin, and silibinin are not. Therefore, this robust ddRFP assay provides a faithful avenue for rapid screening and evaluation of Mpro inhibitors to fight against COVID-19.
1 INTRODUCTION
The coronavirus disease 2019 (COVID-19) pandemic caused by the severe acute respiratory syndrome coronavirus 2 (SARS-CoV-2) continues to be a significant worldwide public health concern. However, therapeutic options for this disease are still limited. With the constant mutations of coronavirus, the Omicron variant is highly resistant to most therapeutic antibodies and can escape the host immune response of existing vaccines.1-4 This crisis highlights a pressing need for the discovery of novel broad-spectrum antivirals to combat COVID-19.
SARS-CoV-2 is an enveloped, positive-sense, and single-stranded RNA virus of the genus β-coronavirus, which shares 79% nucleotide sequence identity with SARS-CoV.5 The entry of SARS-CoV-2 into human host cells mainly depends upon the binding of viral surface spike glycoprotein to the cell receptor angiotensin-converting enzyme 2 (ACE-2), followed by virus-cell membrane fusion.6, 7 After virus invasion, two overlapping open reading frames (ORFs) of the virus genome, ORF1a and ORF1b, are translated into two large polyproteins pp1a and pp1ab, which are cleaved into nonstructural proteins (NSPs) 1-16 by the main protease (Mpro) and the papain-like protease (PLpro). Indeed, Mpro is a conserved enzyme and essential for virus replication. This enzyme and its closely related homologs are absent in human cells. It is responsible for 11 cleavage sites in the viral polyproteins to release 12 NSPs, including itself (NSP5), RNA-dependent RNA polymerase (RdRp, NSP12), and helicase (NSP13).8 In addition, Mpro cleaves histone deacetylases (HDACs) to attenuate host innate immune response of interferon-stimulated genes (ISGs).9 Due to its essential role in virus replication and host immune evasion, Mpro has been regarded as a viable drug target for developing antivirals.10-12
As a gold standard assay, the fluorescence resonance energy transfer (FRET) assay has been widely used for high-throughput screening (HTS) of Mpro inhibitors. The FRET assay is a conventional cell-free biochemical assay, but it is usually interfered with fluorogenic peptide substrate characters and assay conditions, thereby resulting in debatable results.13-15 Moreover, natural products that quench the fluorescence signal of peptide substrates will inevitably lead to false positive results.16, 17 The fluorescence polarization (FP) assay is more homogeneous, robust, and economical for a large-scale screening, but the unstable fluorogenic peptides still serve as substrates in this assay.18-20 With these assays, numerous compounds have been identified as potent Mpro inhibitors by measurement of the change of relative fluorescence unit (RFU) or millipolarization unit (mP), whereas only one single indicator is available in each assay. Furthermore, the preparation of fluorogenic peptide substrates is a complicated process, which can be prohibitive in terms of cost, yield, and multistep synthesis.21 In addition, cell-based screening assays are not readily compatible with HTS campaigns due to the complexity, cost, and tedious operations.14, 22, 23 For these reasons, there is an urgent need to develop novel HTS assays for the discovery of Mpro inhibitors using improved biosensors.
In this study, we first developed an improved fluorescence-based assay for rapid discovery of Mpro inhibitors from an anti-infection compound library using a versatile dimerization-dependent red fluorescent protein (ddRFP) biosensor. Utilizing this assay, we identified MG-101 as a competitive Mpro inhibitor in vitro, and rigorously reevaluated the reported Mpro inhibitors. This robust ddRFP assay is proved to be reliable for rapid screening and evaluation of Mpro inhibitors to fight against COVID-19.
2 MATERIALS AND METHODS
2.1 Chemical reagents
The anti-infection compound library, nirmatrelvir (PF-07321332, PF-332), GC-376, MG-101, ensitrelvir, baicalein, chloroquine, ebselen, echinatin, and silibinin were purchased from TargetMol (Shanghai, China). The FRET substrate (MCA-AVLQSGFR-K(Dnp)-K-NH2, λex/λem = 320/405 nm), FP probe (FITC-AVLQSGFRKK-Biotin, λex/λem = 485/535 nm), Z-RLRGG-AMC (λex/λem = 340/460 nm), and MCA-AVLQ peptide were chemically synthesized (GL Biochem Shanghai Co. Ltd.), and the purity was more than 95.0%.
2.2 Production of SARS-CoV-2 Mpro and PLpro enzymes
The expression, purification, and catalytic activity analysis of SARS-CoV-2 Mpro and PLpro enzymes were conducted as the published methods.18, 19, 24 After dialysis, the protein samples were moved to the HEPES buffer, aliquoted, and stored at −80°C. The HEPES buffer was 10 mM HEPES, 50 mM NaCl, 1 mM EDTA, 1 mM dithiothreitol (DTT), and 0.05% Tween 20 (vol/vol), pH7.0.
2.3 Expression and purification of the fluorogenic ddRFP biosensor
Mpro cleavage sequence (AVLQS) was incorporated between RFP-A1 (GenBank: JN381545) and RFP-B1 (GenBank: JN381546) domains to construct the ddRFP biosensor. A codon-optimized ddRFP gene was subcloned into the pET-28a vector with Nde I and Xho I restriction sites. Subsequently, the expression of target proteins was induced by the addition of 1 mM isopropyl β-d-thiogalactoside (IPTG) solution at 25°C. After 10 h incubation, the Escherichia coli Rosetta (DE3) cells were harvested, and then the cell pellets were lysed by an ultrasonic cell disruptor (SCIENTZ). Later, the supernatant fractions were purified by a HisTrap™ chelating column (Cytiva), and the quality of pure ddRFP biosensor was further assessed by sodium dodecyl sulfate-polyacrylamide gel electrophoresis (SDS-PAGE). After dialysis, the quantitative ddRFP biosensor sample was divided into 100 μL aliquots and stored in the HEPES buffer at −80°C before use.
2.4 Analysis of ddRFP biosensor as the specific Mpro substrate
About 30 μL sample containing Mpro or PLpro was dispensed into a black 96-well microplate (Corning). The enzyme reaction was initiated by adding 30 μL sample containing 20 μM ddRFP biosensor in the HEPES buffer. The RFU value was measured every 1 min for 30 min by a microplate reader (BioTek) with an excitation at 535 nm and emission at 605 nm at room temperature (RT). The time course trajectories of ddRFP biosensor were plotted. The final concentrations of Mpro were 0.5, 1, and 2 μM, but the concentration of PLpro used in this experiment was 2 μM.
Also, 30 μL sample containing 1 μM ddRFP biosensor was incubated with Mpro or PLpro for 1 h at RT in the HEPES buffer. After denaturing, 20 μL sample was loaded into the sample wells for SDS-PAGE analysis.17 The final concentrations of Mpro or PLpro were 0.5, 1, and 2 μM.
2.5 Optimizations of a robust ddRFP assay
To determine the kinetic parameters of Mpro enzyme reaction, 60 μL sample containing Mpro was incubated with the ddRFP biosensor at the indicated concentrations. After measurement of RFU value, the initial velocity (V) of the enzyme reaction was calculated for the first 20 min by a slope of the linear regression. Subsequently, the kinetic parameters, including Michaelis constant (Km), maximum velocity (Vmax), catalytic number (kcat), and kcat/Km value were calculated by fitting to the Michaelis–Menten equation using GraphPad Prism 8.0. The final concentrations of ddRFP biosensor were 2.5, 5, 10, 20, 30, 40, 50, 60, 70, and 80 μM, and the final concentration of Mpro used in this experiment was 2 μM.
The final concentrations of ddRFP biosensor were 2.5, 5, 10, 20, and 30 μM, and the final concentration of Mpro used in this experiment was 2 μM.
Also, 30 μL sample containing Mpro was dispensed into a black 96-well microplate in triplicate. The enzyme reaction was initiated by adding 30 μL sample containing ddRFP biosensor in the absence or presence of each detergent at the indicated concentrations. After measurement of RFU value, the kinetic progress of Mpro enzyme reaction was plotted. The final concentration of Mpro and ddRFP biosensors used in this experiment was 2 and 10 μM, respectively.
For dimethyl sulfoxide (DMSO) tolerance test, the reaction mixtures mentioned above were monitored for the change of RFU value in the absence or presence of DMSO at the indicated concentrations. The enzyme reaction curves in these experiments were plotted using GraphPad Prism 8.0.
2.6 Quality assessment of ddRFP assay
About 30 μL sample containing 2 μM Mpro was incubated with an increasing concentration of PF-332 in the HEPES buffer. After 1 h incubation, 1 μM ddRFP biosensor was added and further incubated for 1 h. After denaturing, 20 μL sample was loaded into the sample wells for SDS-PAGE analysis. The final concentrations of PF-332 were 1, 10, and 100 μM. GC-376 (10 μM) and DMSO served as the positive and negative controls, respectively.
The enzyme reaction was conducted as described above. The wells containing 10 μM PF-332 or DMSO were used as the positive and negative controls, respectively. Each control contained 96 wells, and the initial velocity of each control was analyzed for the calculation of the Z factor.
2.7 High-throughput screening
For primary screening, the reaction mixtures containing 2 mg/mL compounds (1 μL/well) and 4 μM Mpro (29 μL/well) were dispensed into a black 96-well microplate. After incubation for 30 min at RT, 30 μL sample containing 20 μM ddRFP biosensor was pipetted into the reaction mixtures to initiate the enzyme reaction. As described above, the RFU value was recorded every 1 min for 30 min by a microplate reader. In each assay microplate, PF-332 (10 μM), DMSO, and ddRFP biosensor (10 μM) were used as positive, negative, and background controls, respectively. Based on the initial velocity, the inhibition effect of each compound on Mpro was analyzed using Equation (3). Inhibition of Mpro by candidate compounds should be greater than 50% inhibition baseline, and the dose–response curve of each hit compound was plotted as described above.
2.8 Gel-based ddRFP biosensor cleavage assay
As described in the gel-based assay, the inhibition of Mpro by each hit compound was assessed using SDS-PAGE. The final concentrations of each compound were 1, 10, and 100 μM. PF-332 (10 μM) and DMSO served as the positive and negative controls, respectively.
2.9 Inhibition assessment of MG-101 and the reported Mpro inhibitors using ddRFP assay
The inhibition of Mpro by MG-101 and the reported Mpro inhibitors at each indicated concentration was evaluated by ddRFP assay, and the experiments were conducted as described above to calculate the IC50 values.
For SDS-PAGE analysis, the final concentrations of MG-101 and the reported Mpro inhibitors were 1, 10, and 100 μM. PF-332 (10 μM) and DMSO served as the positive and negative controls, respectively.
2.10 Inhibition assessment of MG-101 and the reported Mpro inhibitors using FRET assay
About 25 μL sample containing 0.4 μM Mpro was preincubated with the indicated concentrations of MG-101 or the reported Mpro inhibitors for 30 min at RT in the HEPES buffer. The enzyme reaction was initiated by adding 25 μL sample containing 40 μM FRET substrate. The RFU value was recorded every second for 1 min by a microplate reader with an excitation wavelength of 320 nm and emission wavelength of 405 nm. The initial velocity was calculated by a linear regression for the first 30 s, and the inhibition rate was determined as described in our previous studies.18, 19 PF-332 (1 μM) and DMSO were used as the positive and negative controls, respectively.
2.11 The fluorescence quenching effect of echinatin on MCA-AVLQ peptide in the FRET assay
2.12 Inhibition assessment of MG-101 and the reported Mpro inhibitors using FP assay
About 30 μL sample containing 0.4 μM Mpro was mixed with MG-101 or the reported Mpro inhibitors in the HEPES buffer and incubated at RT for 30 min. Later, 20 μL sample containing 60 nM FP probe was added and incubated for 20 min at RT. After quenching by 0.3 μM avidin (10 μL/well) for additional 5 min, the mP value was recorded by a microplate reader with an excitation at 485 nm and emission at 535 nm. The IC50 value was calculated as previously described.18, 19 PF-332 (1 μM) and DMSO were used as the positive and negative controls, respectively.
2.13 Inhibition mechanism of MG-101 against Mpro in vitro
About 30 μL reaction mixtures containing Mpro (4 μM) and MG-101 (0, 5, 10, and 20 μM) were separately incubated for 30 min at RT. After addition of 30 μL sample containing ddRFP biosensor (10, 20, and 40 μM), the initial velocity was measured as described above. The inhibition mechanism of MG-101 against Mpro in vitro was deduced using the Lineweaver–Burk (LB) plot and the inhibitory constant (Ki) was calculated by its secondary plot.
3 RESULTS
3.1 The design principle of ddRFP assay for the identification of Mpro inhibitors
In view of the issues posed above, we developed a ddRFP assay for the discovery of Mpro inhibitors from an anti-infection compound library. Our strategy for generating a versatile ddRFP biosensor was inspired by the documented practice of engineering the fluorogenic RFP heterodimer for quantifying matriptase activity.25 Accordingly, this ddRFP biosensor (55 kDa) relies on the interaction of a quenched RFP-A1 domain (29 kDa) and a nonfluorescent RFP-B1 domain (26 kDa), resulting in a high RFU value. Herein, we used a polypeptide linker containing Mpro cleavage sequence (AVLQS) to connect two RFP domains.26 Based on this design, Mpro can hydrolyze the ddRFP biosensor to yield RFP-A1 and RFP-B1 fragments. In this monomeric state, the RFP-A1 domain exhibits a predominately protonated (nonfluorescent) chromophore and a reduced quantum yield, rendering quenched fluorescence. However, when Mpro enzyme activity is inhibited by bioactive compounds, two RFP domains stay together via the polypeptide linker, resulting in a high RFU value (Figure 1). Therefore, candidate Mpro inhibitors could be easily identified by separately monitoring the change of RFU value and the cleavage of ddRFP biosensor using SDS-PAGE. The advantage of SDS-PAGE is that it can effectively avoid the fluorescence interference by test compounds. Thus, the combination of RFU readout and SDS-PAGE renders this ddRFP assay more reliable for the screening of Mpro inhibitors.

3.2 Construction and characterization of a versatile ddRFP biosensor as the specific Mpro substrate
As described above, the fluorogenic ddRFP biosensor contains RFP-A1 domain, a polypeptide linker (AVLQS), and RFP-B1 domain. A codon-optimized DNA fragment encoding ddRFP biosensor was subcloned into the pET-28a vector and expressed in E. coli Rosetta (DE3) cells with an extra N-terminal 6×His-tag. After sonication of the induced E. coli cells, the ddRFP biosensor could be noticeably detected, and most of the target proteins were presented in the supernatant fractions, indicating the high-level soluble expression. Subsequently, the purified ddRFP biosensor was further analyzed by SDS-PAGE, which showed that a single band appeared near 55 kDa in the gels (Figure 2A).

Using active Mpro and PLpro enzymes produced from E. coli cells (Supporting Information: Figure S1), the fluorogenic ddRFP biosensor was separately analyzed as the substrate for these two enzymes. As shown in Figure 2B, the fluorescence intensity of ddRFP biosensor decreased over time in the presence of Mpro with an obvious dose-dependent manner, but a high RFU value was retained over time in the presence of PLpro at 2 μM, indicating the specificity for Mpro. In SDS-PAGE analysis, the ddRFP biosensor was cleaved by Mpro at the indicated concentrations, but the cleavage efficiency by PLpro was very low (Figure 2C). This result was consistent with the results shown in Figure 2B. These results indicate that the fluorogenic ddRFP biosensor can be used as the specific Mpro substrate in vitro.
3.3 Optimization and quality assessment of ddRFP assay
As previously noted, we used ddRFP biosensor as the specific Mpro substrate in the ddRFP assay. We first optimized the concentration of Mpro used in this assay, because Mpro concentration has a decisive influence on the assay sensitivity. As shown in Figure 3A, we found that the enzyme reaction was roughly linear when Mpro concentration was lower than 2 µM, indicating that 2 µM of Mpro could be used in the ddRFP assay to achieve the high sensitivity. Subsequently, we determined the Km and kcat/Km values of Mpro for ddRFP biosensor as 50 µM and 32 493 L/(mol·min), respectively (Figure 3B).

Considering assay sensitivity and quality, it is desirable to use the lowest ddRFP biosensor concentration (ideally under Km value) that still yields a high signal-to-basal (S/B) ratio (>3-fold) and a fast catalytic efficiency in HTS campaigns, because a high substrate concentration can reduce potencies of candidate Mpro inhibitors in a pilot screening.27, 28 Based on the results in Figure 3B, we examined the initial velocity and S/B ratio of Mpro enzyme reaction. As illustrated in Figure 3C, the initial velocity significantly increased with the ddRFP biosensor amounts, but the S/B ratio decreased sharply. The expected S/B ratio and initial velocity were exhibited when the final concentration of ddRFP biosensor was 10 µM. Thus, we selected 10 µM of ddRFP biosensor as an optimal concentration for subsequent experiments, which is lower than the Km value to ensure that competitive and noncompetitive inhibitors can be easily identified.
Colloidal aggregation is a common source of false positives in early drug discovery, but this can be prevented by adding detergents, such as Tween-20, NP-40, and Triton X-100.29, 30 As illustrated in Figure 3D, the time course trajectories of Mpro enzyme reaction were highly overlapped in the absence or presence of each detergent using the established assay conditions. Hence, 0.05% Tween-20 (vol/vol) was added to the reaction buffer in the ddRFP assay.
The concentration of DMSO, a commonly used dissolvent, was also tested in the ddRFP assay. The time course trajectories of Mpro enzyme reaction were well maintained even in the presence of up to 5% DMSO, and showed the stable initial velocity (Figure 3E), indicating that less than 5% DMSO can achieve a reliable result in HTS experiments. All these results strongly suggested that the developed ddRFP assay is robust and sensitive, and the reaction mixtures containing 10 μM ddRFP biosensor and 2 μM Mpro should be used in a primary screening.
Nirmatrelvir (PF-07321332, PF-332) is a peptidomimetic inhibitor against Mpro in Paxlovid, intended for the treatment of hospitalized COVID-19 patients.31, 32 We further evaluated Mpro inhibition by PF-332 using ddRFP assay. As expected, PF-332 potently inhibited the cleavage of ddRFP biosensor catalyzed by Mpro (Figure 3F–H), and exhibited the half-maximum inhibitory concentration (IC50) of 0.13 ± 0.01 μM (Figure 3I). This is comparable to the published result from an independent study.17 Likewise, PF-332 also exhibited consistent inhibition against Mpro using SDS-PAGE (Figure 3J). These results demonstrated the feasibility and credibility of the ddRFP assay for the screening of Mpro inhibitors.
The parameter Z factor is a dimensionless, simple statistical characteristic for HTS assays, and has been extensively used as an assay quality metric in HTS campaigns. In general, it is widely accepted that the Z factor of 0.5 or higher is required for HTS.33 To assess the Z factor of the ddRFP assay, 10 μM of PF-332 was used as the positive control for quality assessment. As shown in Figure 3K, the calculated Z factor reached 0.86, indicating that this ddRFP assay is amenable to HTS.
3.4 The basic procedure for a large-scale screening of an anti-infection compound library
Based on the previous results of ddRFP assay, the basic procedure was mainly divided into three steps for a large-scale screening. As illustrated in Figure 4A, the entire procedure took about 1 h for each round of screening. First, 30 μL reaction mixtures containing 4 μM Mpro (29 μL/well) and 2 mg/mL compounds (1 μL/well) were incubated for 30 min at RT. After addition of 30 μL aliquot containing ddRFP biosensor (20 μM), the RFU value was measured every 1 min for 30 min by a microplate reader. Later, the inhibition against Mpro by candidate compounds was separately assessed using RFU readout and SDS-PAGE. To ensure a reliable screening cycle, the positive (PF-332), negative (DMSO), and background controls were included in each assay microplate (Figure 4B).

3.5 In vitro identification of MG-101 as a competitive inhibitor against Mpro
With the established ddRFP assay, we screened an anti-infection compound library containing 3000 compounds for the discovery of Mpro inhibitors. The primary screening identified three candidate compounds that showed more than 50% inhibition against Mpro (Figure 4C). In the second screening cycle, we found that a high RFU value was retained over time in the presence of MG-101 using ddRFP kinetic assay (Figure 4D,E), indicating that MG-101 could inhibit the cleavage of ddRFP biosensor catalyzed by Mpro. Based on the change in initial velocity of Mpro enzyme reaction, MG-101 was identified as a candidate Mpro inhibitor with an IC50 value of 9.73 ± 1.65 μM in vitro (Figure 4F,G). Consistently, MG-101 also showed obvious inhibition against Mpro using SDS-PAGE because of the failure for ddRFP biosensor cleavage by Mpro in the presence of MG-101 (Figure 4H). Intriguingly, MG-101 still exhibited detectable inhibition against Mpro in vitro using FRET and FP assays, and the IC50 values were determined as 2.67 ± 0.16 and 7.76 ± 1.41 μM, respectively (Figure 4I). These results indicated that MG-101 is a potential inhibitor against Mpro in vitro.
Next, we employed the LB plot graphical method to further interrogate the possible inhibition mechanism against Mpro by MG-101 in vitro for the ddRFP biosensor. As shown in Figure 4J, we found that the LB plot exhibited obvious profiles that a series of straight lines yield the same y-axis intercept in the presence of MG-101, and the Ki value was 7.13 μM (Figure 4K). These data clearly demonstrated that MG-101 is a competitive inhibitor against Mpro in vitro.
3.6 Evaluation of the reported Mpro inhibitors using combinational experiments
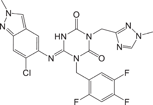
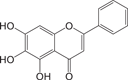
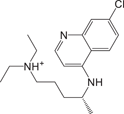
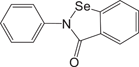
Recently, a number of structurally disparate compounds have been identified as potent Mpro inhibitors, including ensitrelvir, baicalein, chloroquine, ebselen, echinatin, and silibinin,26, 34-38 but a stringent validation is lacking. As such, we rigorously reevaluated the inhibition against Mpro by these compounds using combinational experiments, including FRET, FP, and ddRFP assays. Our FRET results showed that ensitrelvir and echinatin exhibited obvious inhibition against Mpro, but the other compounds did not inhibit Mpro (Supporting Information: Figure S2, Figure S3A). Intriguingly, we found that the presence of echinatin at the indicated concentrations could quench the fluorescence signal of MCA-AVLQ peptide, which is generated by the cleaved FRET substrate (Figure S3B). Importantly, this quenching effect fully contributed to the observed Mpro inhibition of echinatin in the FRET assay, indicating that this inhibition is false positive (Figure S3C).
We further evaluated the inhibition against Mpro by these compounds using FP and ddRFP assays. As expected, ensitrelvir showed potent inhibition against Mpro in both assays (Table 1, Supporting Information: Figure S4, Figure 5A). The consistent inhibition of Mpro was also detected by SDS-PAGE when the concentration of ensitrelvir was more than 10 μM, suggesting that ensitrelvir could inhibit the cleavage of ddRFP biosensor catalyzed by Mpro (Figure 5B). By contrast, other compounds were devoid of noticeable inhibition against Mpro in each assay, and the IC50 values were greater than 100 μM (Table 1, Supporting Information: Figure S4, Figure 5A). Consistently, other compounds also showed no inhibition against Mpro using SDS-PAGE, because the ddRFP biosensor could be cleaved into RFP-A1 and RFP-B1 fragments in the presence of each compound (Figure 5B). Importantly, our results are highly consistent with the independent studies from others.14, 39-41 We seriously doubted that there might be a significant flaw with the enzymatic assay inhibition results presented in the previous publications. Collectively, our results revealed that ensitrelvir is a potent inhibitor against Mpro, but baicalein, chloroquine, ebselen, echinatin, and silibinin are not. We suggest that the fluorescence quenching effect caused by test compounds should be seriously considered when evaluating Mpro inhibitors. Contrary to the conventional FRET approach, this ddRFP assay could be used as a reliable biochemical tool for the evaluation of Mpro inhibitors in vitro at the early stage of drug discovery.
| Compound | Reported IC50 (μM) | Measured IC50 (μM) | Comment |
|---|---|---|---|
 Ensitrelvir34 Ensitrelvir34 |
0.013 | 0.29 ± 0.04 | Validated Mpro inhibitor |
 Baicalein35 Baicalein35 |
0.39 ± 0.12 | >100 | Not a Mpro inhibitor |
 Chloroquine36 Chloroquine36 |
3.9 ± 0.2 | >100 | Not a Mpro inhibitor |
 Ebselen26 Ebselen26 |
0.67 ± 0.09 | >100 | Not a Mpro inhibitor |
 Echinatin37 Echinatin37 |
35.15 | >100 | Not a Mpro inhibitor |
 Silibinin38 Silibinin38 |
0.021 | >100 | Not a Mpro inhibitor |

4 DISCUSSION
To date, the unprecedented COVID-19 pandemic is a great threat to global public health. During the lifecycle of SARS-CoV-2, Mpro is crucial for virus polyproteins process and host immune escape, therefore recognized as a high-profile drug target for antiviral development.8 The exciting success of PF-332 highlights a promising avenue for the discovery of Mpro inhibitors to fight against COVID-19.11 Unfortunately, more emerging Mpro inhibitors have been intensively identified as promiscuous inhibitors due to the limitations of the currently available methods for Mpro inhibitor analysis.14-17, 39, 40 Therefore, the development of novel biochemical assays for the analysis of Mpro inhibitors is of the highest significance.
The HTS technique has been regarded as a useful tool for the identification of potent antivirals.42 However, its success rate depends not only on the capacity and diversity of screened chemical libraries, but also on the simplicity, robustness, and cheapness of HTS assays.43 In this case, the FRET and FP assays have been widely used for the screening of Mpro inhibitors, but these methods still face more limitations in a large-scale screening, resulting in false positive results. In this study, we developed an improved fluorescence-based assay for the discovery of Mpro inhibitors using a versatile ddRFP biosensor. Following E. coli production and purification, the versatile ddRFP biosensor showed ideal fluorescent properties, including a high quantum yield for emission at 605 nm wavelength, which is outside the range of most fluorescent molecules in test compounds. Most importantly, validation of bioactive compounds using ddRFP assay can be easily achieved by monitoring the change of RFU value as well as the cleavage of ddRFP biosensor using SDS-PAGE. In contrast to the FRET assay, the improved ddRFP assay is more reliable for screening and evaluation of Mpro inhibitors in vitro, because the potential fluorescent interferant by test compounds is minimal. Intriguingly, baicalein, chloroquine, ebselen, echinatin, and silibinin are identified as promiscuous Mpro inhibitors using this ddRFP assay, and these compounds might have other targets to exhibit antiviral activity against SARS-CoV-2, which can be further studied. We believe that a strict filtering is essential for identifying true positives in a primary screening. Moreover, the 3-step screening procedure only takes 1 h for each screening cycle. Hence, this ddRFP assay is featured by simple operation and greater efficiency, which is appropriate for HTS. In addition, the observed IC50 value of PF-332 showed minor differences from the previous FRET studies because of the distinct catalytic features of ddRFP biosensor.44, 45 Considering the flexible design of polypeptide linkers, the framework of this ddRFP assay can be easily modified to screen antiviral agents against virus protease.
Utilizing this ddRFP assay, MG-101 was identified as a competitive Mpro inhibitor in vitro with a Ki value of 7.13 μM through screening of an anti-infection compound library. Notably, MG-101 also exhibited the consistent inhibition of Mpro using FRET and FP assays. MG-101 is a synthetic tripeptide aldehyde that acts as a potent inhibitor of cysteine proteases, including calpain I, calpain II, cathepsin B, and cathepsin L. The recent studies identified MG-101 as a covalent Mpro inhibitor using FRET assay, and it possessed antiviral activity against authentic SARS-CoV-2.46-48 Similar to these findings, using our developed ddRFP assay, we have also confirmed that MG-101 is a competitive inhibitor against Mpro in vitro. Our study suggested that MG-101 is a promising lead compound against Mpro, which could deserve further chemical modifications for more potent antivirals.
5 CONCLUSION
In summary, we first developed an improved fluorescence-based assay for rapid screening of Mpro inhibitors from an anti-infection compound library using a versatile ddRFP biosensor. With this assay, we identified MG-101 as a competitive Mpro inhibitor in vitro. Our results revealed that ensitrelvir is a potent Mpro inhibitor, but baicalein, chloroquine, ebselen, echinatin, and silibinin are not. This robust ddRFP assay is proved to be reliable for rapid screening and evaluation of Mpro inhibitors to fight against COVID-19.
AUTHOR CONTRIBUTIONS
Rui Zhang and Haohao Yan wrote the manuscript and conducted the experiments. Jiahao Zhou, Gangan Yan, and Xiaoping Liu contributed to reagent support and data curation. Chao Shang and Yunyu Chen conceived the project, analyzed the experiments, and revised the manuscript. All authors reviewed the results and approved the final manuscript.
ACKNOWLEDGMENTS
This work was supported by the University Natural Science Research Project of Anhui Province, China (No. KJ2021A0839), the Young Fellow Program of Wannan Medical College, China (No. wyqnyx202104), and the Postgraduate Academic Innovation Program of Anhui Province, China (No. 2022xscx129). The authors thank Prof. Yanchang Wang (Department of Biomedical Sciences, College of Medicine, Florida State University, Tallahassee, United States) for his helpful readings of the manuscript.
CONFLICT OF INTEREST STATEMENT
The authors declare no conflict of interest.
Open Research
DATA AVAILABILITY STATEMENT
Data will be made available on request to the corresponding authors.