Genetic characterizations and molecular evolution of human norovirus GII.6 genotype during the past five decades
Abstract
The norovirus genotype GII.6 is circulating in the population with a relatively high prevalence, but in-depth molecular characterization studies of GII.6 are needed. In this study, norovirus GII.6 sequences were retrieved and analyzed to demonstrate the molecular characterizations of norovirus GII.6. The results show that GII.6 VP1 gene can be divided into three variants and all variants cocirculated in humans in the past decades. The intragenotypic showed no growth trend over time. Since the overall evolutionary rate was 3.432 × 10⁻³ substitutions/site/year, the infer most recent common ancestor was estimated as 1913. Only a few amino acid sites were recognized to be under positive selection pressure. The mean effective population size was stable in the recent years. The variant C (especially 87 GII.P7-GII.6 strains) had a higher evolutionary rate and more sites under positive selection pressure compared to other variants. NS4 protein had the higher diversity than other nonstructural proteins, and VP1 and VP2 genes had the same phylogenetic relationships. This study provides a systematic description of genetic characterizations and molecular evolution of GII.6. Research on norovirus molecular epidemiology should be pursued to enrich the genomic data of the diverse genotypes and improve their analysis.
1 INTRODUCTION
Norovirus is one of the leading viral agents responsible for both sporadic and outbreak of acute gastroenteritis (AGE). Norovirus infection can occur in all age groups, and the highest prevalence is in the children younger than 5 years.1 It was estimated that approximately 16% of AGE cases were caused by norovirus globally.2 Global economic burden of norovirus gastroenteritis was up to $60 billion per year.3
Norovirus is a single-stranded positive-sense RNA virus belonging to the family Caliciviridae. Its genome has a length of 7.5 kb and consists of three open reading frames (ORFs), encoding nonstructural proteins, the major capsid protein (VP1), and the minor capsid protein (VP2), respectively.4 VP1 is formed by a shell (S) and protruding (P) domain.5 The major determinants and host cell receptors binding sites are considered to be located in the P domain.6 Norovirus is genetically diverse and classified into 10 genogroups (GI ~ GIX) based on VP1 gene.7 Of these, GI, GII, GIV, GVIII, and GIX can cause human disease, and each genogroup also contains lots of genotypes. A dual nomenclature system was proposed to precisely identify norovirus strains according to the RNA-dependent RNA polymerase (RdRp) and VP1 gene because that recombination is an important evolution mechanism of norovirus.8
Norovirus GII is the most prevalent norovirus genogroup in the whole world.9 GII.4 variants have caused at least six pandemics of AGE,10 and a novel recombinant variant of GII.P16-GII.4 Sydney 2012 was detected in 2014.11 During the 2014–2015 winter, GII.17 variant with a new GII.P17 emerged as the most prevalent strain in many Asian countries.12, 13 A recombinant GII.P16-GII.2 strain became the predominant variant during 2016–2017 season.14, 15
As one common genotype worldwide, GII.6 was also observed in many regions.16-19 Retrospective study revealed that GII.6-associated AGE outbreaks can date back to 1971.20 From 2010 to 2012, GII.6 resulted in 107 norovirus outbreaks in the NoroNet network.21 In the 2014–2015 season, GII.P7-GII.6 recombination variant induced outbreaks of AGE in European and Asian areas, and 11% of norovirus outbreaks were caused by GII.6 in the CaliciNet network.22 From 2016 to 2020, GII.P7-GII.6 was the fourth circulating strains in the NoroSurv network.23
However, previous research focusing on the molecular characterizations of GII.6 were limited to few regions and the number of analyzed strains was relatively low. The reported results were not comprehensive enough.24-27 In this study, a great number of GII.6 sequences from the GenBank database were retrieved. They were fully analyzed to elucidate the phylogenetic and evolutionary information of GII.6, and to provide a better understanding of epidemiological characterizations of norovirus.
2 MATERIALS AND METHODS
2.1 Data set
Complete VP1 sequences of norovirus GII.6 were retrieved from the GenBank database (accessed on December 28, 2022), and their pairwise P-genotypes were searched. Nearly complete genome sequences (>7000 nt) of norovirus GII.6 were also retrieved. All sequences were confirmed by online Norovirus Genotyping Tool v.1.0.28 Strains with recombination signal on the VP1 gene were detected and excluded by the analysis of Recombination Detection Program 4.56 with p ≤ 0.05 in three or more methods.29 Strains with unknown collection year and undetermined nucleotides, and from environmental samples were also excluded.
2.2 Genetic characterizations of norovirus GII.6
Sequence alignment was performed by BioEdit 7.1.3.0.30 The maximum likelihood (ML) phylogenetic tree was reconstructed by IQ-TREE web server with 1000 ultrafast bootstrap replications.31 Sequence identities were calculated using BioEdit 7.1.3.0. Root-to-tip plot between genetic divergence and time was inferred using TempEst 1.5 based on the ML phylogenetic tree to detect the evolutionary clock-like signal.32 To evaluate the temporal fluctuation of intra-genotypic diversity of GII.6 VP1 gene, the mean pairwise p-distance of nucleotides and the mean number of pairwise amino acid differences within strains in the same year were estimated by MEGA 11.33
2.3 High variable site and selection pressure analysis of GII.6 VP1 gene
High variable amino acid site was determined by Shannon's entropy value which was estimated by the web service of the Shannon Entropy-One tool (www.hiv.lanl.gov, accessed on March 10, 2023). Selection pressure analysis was performed on the Datamonkey server (http://www.datamonkey.org, accessed on March 10, 2023). Positively selected site (dN > dS) was defined with a cutoff p of 0.05 by Single-Likelihood Ancestor Counting (SLAC), Fixed Effects Likelihood (FEL), and internal Fixed Effects Likelihood (IFEL) methods.34 All high variable and positively selected sites were mapped onto a three-dimensional (3D) structure of norovirus GII VP1 protein (PDB number: 6OTF). Visualization and annotation were conducted by PyMOL version 2.3.0.35
2.4 Time-scale evolutionary characterizations of GII.6 VP1 gene
Time-scale evolutionary characterizations were estimated by BEAST 1.8.4 based on the Bayesian Markov Chain Monte Carlo (MCMC) method. In brief, the best-fit nucleotide substitution model was estimated by IQ-TREE web server (http://iqtree.cibiv.univie.ac.at/, accessed on March 3, 2023) on the basis of Bayesian information criterion score.31 Three clock models (strict, relaxed uncorrelated exponential distribution, and uncorrelated lognormal distribution clock) were tested and compared by Akaike information criterion via MCMC (results of model comparison were shown in Supporting Information: Table S1). Bayesian skyline coalescent model was selected as tree before evaluate the changes in the effective population size of GII.6 VP1 gene. MCMC chains were run for 100 million steps. Tracer 1.6 (http://tree.bio.ed.ac.uk/software/tracer/) was used to display BEAST results and the initial 10% of logs from the MCMC run were excluded as burn-in. The maximum clade credibility (MCC) tree was constructed by TreeAnnotator 1.8.2 (http://tree.bio.ed.ac.uk/software/) and visualized using FigTree 1.4.36
3 RESULTS
3.1 Genetic characterizations of norovirus GII.6
According to inclusion and exclusion criteria, a total of 220 complete VP1 genes of norovirus GII.6 were retrieved from the GenBank database (Supporting Information: Table S2). These strains were isolated from 1971 to 2022 with the timespan of 51 years. Identity analysis showed that the nucleotide and amino acid identities of these strains were 75.2%–100% and 82.1%–100%, respectively. The phylogenetic tree based on ML method showing that GII.6 VP1 gene can be divided into three variants (Supporting Information: Figure S1). Strains in variant A were collected between 1971 and 2022 with the nucleotide and amino acid identities ranging from 89.1% to 100% and 94.7% to 100%, respectively. Strains in variant B were collected between 1976 and 2019 with the nucleotide and amino acid identities ranging from 88.8% to 100% and 94.0% to 100%, respectively. Strains in variant C were collected between 1977 and 2022 with the nucleotide and amino acid identities ranging from 85.0% to 100% and 94.0% to 100%, respectively.
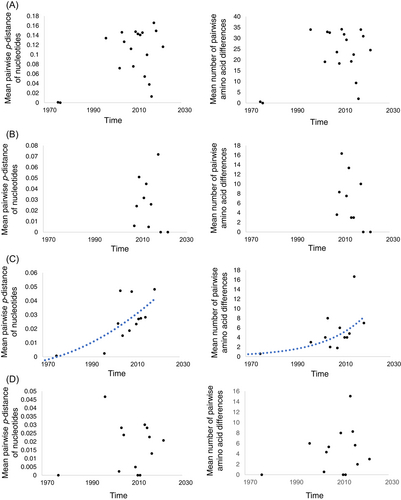
To explore the temporal fluctuation of intragenotypic diversity of GII.6 VP1 gene, the mean pairwise p-distance of nucleotides and the mean number of pairwise amino acid differences within strains in the same year were calculated. For all strains, the highest mean pairwise p-distance and mean number of pairwise amino acid differences were in 2018 (0.1660 ± 0.0061) and 2013 (40.4338 ± 3.6539), respectively. The intragenotypic diversity of all analyzed GII.6 VP1 genes showed no growth trend over time at nucleotide and amino acid levels. For each variant, only variant B showed an increase of intragenotypic diversity both at nucleotide and amino acid levels (Figure 1).
The P-genotypes associated to a total of 183 analyzed nearly complete sequences that included the VP1 genes were obtained from the database, and most of them belonged to GII.P7 (88.52%, 162/183). Others were GII.P6 (11.48%, 21/183). When considering P-genotypes, five groups (GII.P6-GII.6 and GII.P7-GII.6 in variant A, GII.P7-GII.6 in variant B, GII.P6-GII.6 and GII.P7-GII.6 in variant C) were identified in the data set. In variant C, 10 specific differences of frequency of amino acid mutations between GII.P6-GII.6 and GII.P7-GII.6 groups were recognized and illustrated in Table 1. Except position 311, other sites presented different dominant amino acid between these two groups. By root-to-tip divergence plot analysis, VP1 genes in variant C lacked a linear clock-like signal (Figure 2A). However, when analyzed according to their P-genotypes, linear regressions were observed in both GII.P6-GII.6 and GII.P7-GII.6 group of variant C (Figure 2B,C).
| Position | Mutations in GII.P6-GII.6 strains | Mutations in GII.P7-GII.6 strains |
|---|---|---|
| 23 | N (100%, 20/20) | T (96.34%, 79/82) |
| 172 | D (95.0%, 19/20) | N (92.68%, 76/82) |
| 255 | T (100%, 20/20) | A (96.34%, 79/82), T (3.66%, 3/82) |
| 311 | V (100%, 20) | V (62.20%, 51/82), A (37.80%, 31/82) |
| 359 | S (80%, 16/20), N (15%, 3/20), G (5%, 1/20) | N (69.51%, 57/82), S (19.51%, 16/82), G (9.76%, 8/82), T(1.22%, 1/82) |
| 362 | V (95%, 19/20), A (5%, 1/20) | I (93.90%, 77/82), V (2.44%, 2/82), L (1.22%, 1/82), E (1.22%, 1/82), T (1.22%, 1/82) |
| 391 | Q (50%, 10/20), Y (25%, 5/20), N (15%, 3/20), H (10%, 2/20) | Y (87.80%, 72/82), H (12.20%, 10/82) |
| 395 | S (95%, 19/20), T (5%, 1/20) | T (51.22%, 42/82), N (29.27%, 24/82), A (6.10%, 5/82), G (4.88%, 4/82), S (3.66%, 3/82), I (3.66%, 3/82), P (1.22%, 1/82) |
| 417 | R (70%, 14/20), H (30%, 6/20) | H (84.15%, 69/82), R (13.42%, 11/82), N (2.44%, 2/82) |
| 464 | Q (100%, 20/20) | H (92.68%, 76/82), Q (3.66%, 3/82), R (2.44%, 2/82), Y (1.22%, 1/82) |

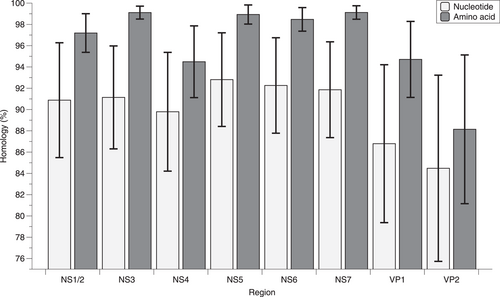
A total of 153 nearly complete genome sequences of norovirus GII.6 were obtained to conduct the genome-wide analysis. The analysis of mean pairwise identity among different coding regions (Figure 3) showed that VP2 had higher diversity than VP1 both at nucleotide and amino acid level (Wilcoxon test, p < 0.01). In the nonstructural proteins, NS4 presented the higher diversity than other proteins (Tamhane's T2 test, p < 0.01). Phylogenetic trees showed that the phylogenetic relations of NS1/2, NS3, NS4, NS5, NS6, and NS7 proteins were similar, and were inconsistent with VP1 gene (Supporting Information: Figure S2–S7). VP2 gene can be divided into three clusters and the phylogenetic relation was consistent with VP1 gene (Supporting Information: Figure S8).
3.2 High variable site and selection pressure analysis of GII.6 VP1 gene
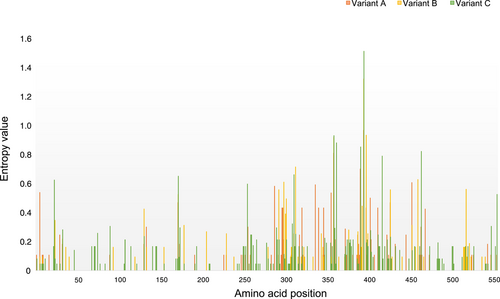
Entropy value for each amino acid position at variant level was evaluated to determine the high variable site which was defined as having an entropy value greater than 0.6 (Figure 4). The mean entropy values for A, B, and C variants were 0.0329, 0.0300, and 0.0477, and there were four, six, and nine high variable residues in each variant, respectively (Table 2). Residues 359 and 395 were consensus sites with high variation in all variants. The mean entropy values for GII.P7-GII.6 in variant A, GII.P7-GII.6 in variant B, GII.P6-GII.6, and GII.P7-GII.6 in variant C were 0.0335, 0.0253, 0.0096, and 0.0498, and there were seven, seven, seven and five high variable residues, respectively (Table 2). Residues 359 and 395 were also consensus sites with high variation in these groups.
| Group | Number of strains | Timespan | High variable residues | dN/dS | Positively selected sites | Evolutionary ratea (95% HPD) |
|---|---|---|---|---|---|---|
| Variant A | 45 | 1971–2022 | 359, 391, 395 and 453 | 0.0487 | 0 | 3.252 (2.795– 4.076) |
| GII.P6-GII.6 | 1 | 1971 | NA | NA | NA | NA |
| GII.P7-GII.6 | 35 | 2004–2022 | 288, 337, 356, 359, 391, 395, 453 | 0.0525 | 0 | 3.010 (1.822–4.316) |
| Variant B | 53 | 1976–2019 | 299, 313, 359, 395, 398, 460 | 0.0281 | 395 | 4.118 (3.411–4.796) |
| GII.P7-GII.6 | 45 | 1976–2019 | 299, 313, 359, 395, 398, 427, 460 | 0.0280 | 0 | 3.945 (3.130–4.785) |
| Variant C | 127 | 1977–2022 | 23, 172, 311, 359, 362, 391, 395, 417, 464 | 0.0581 | 359, 395, 417 | 4.143 (3.420–4.821) |
| GII.P6-GII.6 | 20 | 1977–2011 | 299, 313, 359, 395, 398, 427, 460 | 0.0276 | 0 | 3.001 (1.657–4.204) |
| GII.P7-GII.6 | 87 | 1994–2022 | 311, 359, 395, 417, 555 | 0.1032 | 359, 395 | 4.943 (3.872–6.210) |
| All strains | 220 | 1971–2022 | NC | 0.0409 | 359,395 | 3.432 (2.795–4.076) |
- Abbreviations; 95% HPD, 95% highest posterior densities; NA, not available; NC, not conducted.
- a The unit of evolutionary rate is ×10−3 substitutions/site/year.
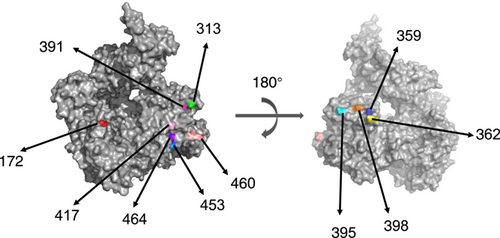
Next, selection pressure analysis was conducted to determine the positively selected sites. By the methods of SLAC, FEL, and IFEL, consensus sites under positive selection were at positions 359 and 395 for all analyzed GII.6 VP1 genes. For variant A, no consensus positively selected site was observed by these methods. For variant B, only one consensus site (at position 395) was under the positive section. For variant C, three consensus sites (at position 359, 395, and 417) were under positive section. In groups identified according to P-genotypes, only two consensus sites (at position 359 and 395) were under positive selection in GII.P7-GII.6 of variant C (Table 2). These high variable and positively selected sites were all located in the P2 domain except for positions 23, 172, 435, 460, and 464. Then all recognized sites were mapped on the 3D structure of the GII VP1 protein (positions 23, 299, 311, and 555 were not mapped due to the absence of them on the model), and they were surface-exposed (Figure 5).
3.3 Time-scale evolutionary characterizations of GII.6 VP1 gene
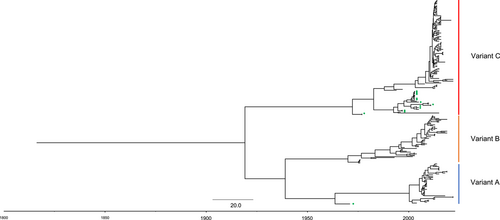
Time-scale phylogenetic tree was constructed based on the Bayesian MCMC method (Figure 6). MCMC tree also showed that three variants can be recognized in the GII.6 VP1 gene. Variant B was in a ladder-like branching pattern, and variants A and C displayed a relative balanced branching pattern. The most recent common ancestor (TMRCA) of GII.6 VP1 gene was 1913 (95% highest posterior densities [HPDs]: 1863–1953). Variant A diverged at 1964 (95% HPDs: 1949–1970). Variant B and C had the nearly divergent time of 1970 (95% HPDs: 1956–1973) and 1972 (95% HPDs: 1962–1977), respectively. The evolutionary rate was also estimated in this study. The overall evolutionary rate of GII.6 VP1 gene was 3.432 × 10⁻³ substitutions/site/year (95% HPDs: 2.795 × 10⁻³–4.076 × 10⁻³ substitutions/site/year). In each variant, variant A had a lower evolutionary rate than others. Variants B and C had a similar rate. In groups identified according to P-genotypes, VP1 genes of GII.P7-GII.6 in variant C had the higher evolutionary rate, followed by GII.P7-GII.6 in variant B. GII.P7-GII.6 in variant A and GII.P6-GII.6 in variant C had a similar evolutionary rate (Table 2).
The effective population size of GII.6 VP1 gene was evaluated by Bayesian skyline plots (Supporting Information: Figure S9). The effective population size of GII.6 VP1 gene had a peak around 2015, and remained stable in other time. For each variant, the effective population size of variant A reached a peak around 1990 and decreased slightly since then. The effective population size of variant B showed no obvious fluctuation in the past decades. The effective population size of variant C had a decrease around 2012 and increased obviously thereafter.
4 DISCUSSION
While representing a fraction only of about 5%, GII.6 was the fourth frequently detected circulating norovirus genotype and in-depth molecular characterization studies of GII.6 are needed.23 In this study, a large data set of norovirus GII.6 sequences were retrieved from the GenBank database and analyzed. The results showed that GII.6 VP1 gene can be divided into three variants, and timespan of strains in each GII.6 variant was nearly 50 years and longer than previous reports,26, 27 indicating the long-term cocirculation of these variants in the past decades. At nucleotide and amino acid level, intragenotypic diversity of GII.6 VP1 gene showed no growth trend over time. But different temporal variation patterns of intragenotypic diversity were observed in different variants, and only variant B showed the increase of intragenotypic diversity. This may be another evidence of independent evolution of GII.6 VP1 gene at variant level. However, since the number of sequences available per year for this study was limited, the variation pattern of the GII.6 VP1 gene intragenotypic diversity should be further investigated to support this analysis.
The P domain of VP1 protein is the binding region for human histo-blood group antigens (HBGAs) receptors,37 and can elicit innate, humoral, and cellular immunity.38 Variation in the P domain can change the HBGA binding patterns and antigenicity.39 In the VP1 gene of GII.6, most of the high variable amino acid sites were located in the P domain in this study. Strong selection pressure may be easier to produce immune escape variant. Selection pressure analysis in this study showed that only a few positively selected sites were observed and also located in the P domain. For each variant, variant C owned more sites under selection pressure. Given that variant C also had the most variable sites, variant C may be more easily to evolve to become an immune escape variant than other variants.
MCC tree also confirmed that GII.6 VP1 gene was clustered into three groups. Variant replacement is an important pattern of norovirus to adapt to different immunological environments.9 Ladder-like phylogenetic relationship of strains indicates a temporal replacement of prevalent variants driven by herd immunity.40 But this was not observed in the GII.6 VP1 gene, indicating the long-term cocirculation of GII.6 variants in the population. On the whole, the evolutionary rate of GII.6 VP1 gene was estimated to be 3.432 × 10⁻³ substitutions/site/year. This result was higher than previous reports.26, 27 A nearly fourfold number of analyzed strains in this study than others should provide more accurate evolutionary parameters. This result was also lower than the estimate of norovirus GII capsid strains (3.76 × 10⁻³ substitutions/site/year),41 meaning that GII.6 evolves slower than other norovirus GII genotypes. The Bayesian skyline plot is used to evaluate the change of effective population size, which can display a demographic history of one virus.36, 42 The Bayesian skyline plots of each GII.6 VP1 variants in this study showed that the prevalence of GII.6 in the population may remain stable in the future.
In nonstructural proteins of norovirus, NS3, NS5, NS6, and NS7 encode NTPase, VPg, Protease, and RdRp, respectively.43 Intergenotype recombination between the VP1 capsid and RdRp region of norovirus is common and an important evolutionary mechanism of norovirus. It has been described that the high epidemic activity of GII.17 and GII.2 in the past few years may be attributed to the acquisition of a novel polymerase.44, 45 The data in this study showed that only GII.P6 and GII.P7 were connected with GII.6, and the diversity of RdRp genotypes associated with GII.6 was much lower than other norovirus GII genotypes. For example, there are at least 7 and 10 different RdRp genotypes combined with GII.17 and GII.2.46 This may be due to the fact that co-infection of GII.6 and other stains with different P-genotypes are not common. More importantly, by comparison of genetic characterizations and molecular evolution of VP1 gene between GII.P6-GII.6 and GII.P7-GII.6 strains in variant C, some interesting results were observed. First, specific amino acid mutation patterns were detected between two groups. Second, the GII.6 sequences showed a linear regression at the P-genotype level. Third, the VP1 gene of GII.P7-GII.6 strains had a higher evolutionary rate than GII.P6-GII.6 and is under positive selection. These reveal that the RdRp region might influence the molecular evolution of the GII.6 VP1 gene. The evolution of the variant C GII.P7-GII.6 strains should be paid more attention. Although dual nomenclature system of norovirus has been proposed, it is not the common practice in some countries, and the available number of RdRp strains is still low, hampering the further analysis of relationship between norovirus VP1 and RdRp region. To make definitive statements about P-genotypes and the capsid gene, the whole genome should be analyzed.
Except for RdRp, the role of nonstructural proteins on evolution and transmission of norovirus is underappreciated. In this study, NS4 presented higher diversity than other nonstructural proteins, but the function of NS4 is still to be determined.47 Thus, the meaning of this phenomenon needs to be discussed. In the capsids of norovirus, the minor capsid of VP2 is associated with the stability and the homogeneity of the size of norovirus particle.48 Although VP2 displayed higher diversity than VP1 in this study, the phylogenetic relations of VP1 and VP2 proteins of GII.6 were the same. This may show another evidence of covariation of VP1 and VP2 proteins, just like previous reports of GII.4.49, 50
Studies on norovirus molecular evolution based on genomic sequences from public databases can provide valuable information for epidemiology, vaccine design, and detection. However, most of previous reports only focused on one specific region, such as VP1, RdRp, and protease gene of norovirus GI and GII.41, 51-54 In this study, besides the molecular characterizations of GII.6 VP1 gene, we also evaluated the genetic diversity of other nonstructural proteins and explored the influence of RdRp region on the molecular evolution of GII.6 VP1 gene. Although virological surveillance is temporally and geographically uneven, and the strains analyzed in this study may be biased. But the number of analyzed strains in this study is quite large, and the results show that GII.6 VP1 gene can be divided into three variants and was not under strong selection pressure. Three variants cocirculated in human in the past decades. The intragenotypic diversity of GII.6 VP1 gene showed no growth trend over time. For each variant, variant C owned the higher nucleotide substitution rate and had more sites with high variation and positive selection. RdRp gene has a significant impact on the molecular evolution of GII.6 VP1 and GII.P7-GII.6 strains in variant C should be paid more attention. NS1 and NS4 had the higher diversity in the nonstructural proteins, and VP1 and VP2 may covary. In the future, long-term surveillance of norovirus should be performed to enrich the genomic data of diverse genotypes for systematic analysis.
AUTHOR CONTRIBUTIONS
Nan Zhou: Conceptualization; methodology; software; writing—original draft preparation; funding acquisition. Mingma Li: Software. Lu Zhou: Data curation; writing—review and editing. Yue Huang: Methodology; formal analysis; data curation.
ACKNOWLEDGMENTS
This research was supported by the National Natural Science Foundation of China (grant number: 82003513) and Zhishan Scholar Program of Southeast University (2242022R40062).
CONFLICT OF INTEREST STATEMENT
The authors declare no conflicts of interest.
Open Research
DATA AVAILABILITY STATEMENT
The data that support the findings of this study are available in GenBank database at https://www.ncbi.nlm.nih.gov/genbank/ (accessed on December 28, 2022).


