Increasing positive rate of IgG against hepatitis E virus with steady IgM positivity and clinical incidence: A retrospective seroprevalence time series analysis of HEV from 2012 to 2021 in Chongqing, China
Abstract
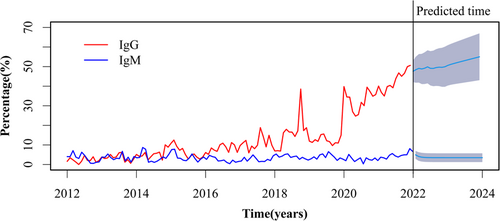
China is an epidemic area of hepatitis E, and the serum prevalence data is very important for formulating prevention and control strategies. However, almost all related research in the past decade are cross-sectional studies. In this study, we analyzed the serological data from 2012 to 2021 in Chongqing for 10 consecutive years. We found that the positive rate of hepatitis E IgG antibody increased gradually, from 1.61% in January 2012 to 50.63% in December 2021. The autoregressive integrated moving average model was used to predict the trend, and it was found that it will continue to show an upward trend in the recent future. In contrast, the positive rate of IgM and clinical incidence of hepatitis E showed a relatively stable trend. Although the positive rate of antibodies gradually increased with age, there was no significant difference in the age distribution of the subjects each year. Therefore, these results suggest that the accumulated infection of hepatitis E in Chongqing may be gradually increasing, but the clinical incidence rate remains unchanged, which provides a new concern for formulating prevention and control strategies.
1 INTRODUCTION
Hepatitis E virus (HEV) is a nonenveloped, single-stranded RNA virus that belongs to the genus Orthohepevirus of the Hepeviridae family, and eight genotypes have been identified.1 Genotypes 1 and 2 infect only humans and are transmitted in developing countries mainly through the fecal-oral route.2 Genotypes 3 and 4 are capable of infecting pigs, deer, and other zoonotic species, and can spread through polluted water and food, contact with afflicted creatures, and transfusions of blood products.3 Genotypes 5 and 6 are known to cause infections in wild boar.4 Genotypes 7 and 8 have been detected in camels from the Middle East and China.5 HEV is the smallest of all known human hepatitis viruses and has a linear genome of approximately 7.2 kb, which is composed of three open reading frames (ORFs) that code for the viral nonstructural proteins, the capsid protein, and the polymerase.6 The infection is typically spread through contaminated water, infected animals or through ingestion of undercooked food. Hepatitis E patients have a significantly higher mortality rate7 and adverse maternal outcomes risk in pregnant women.8 HEV infection also accelerates decompensation and increases mortality of patients suffering with liver cirrhosis.9
HEV is a major cause of acute viral hepatitis globally, with high seroprevalence in many countries ranging from 0.25% to more than 70% in certain populations.10 The seroprevalence of HEV is highly variable and depends on many factors, including the population studied, the type of assay used, the geographic region, and so forth. In the United States, the overall seroprevalence of anti-HEV IgG and IgM is estimated to be approximately 6.1% and 1.0%, without significant trend from 2009 to 2016.11 Asia and Africa, on the other hand, are endemic regions with higher positivity rates than Europe and North America, and in some countries, such as South Sudan, even up to 70%.12 Many studies regarding seroepidemiology in China have been published in the last decade, yet they are all cross-sectional, making it challenging to accurately compare antibody positivity levels between different places and times.13 We urgently need data on dynamic changes over time to gain insight into the present trend of HEV infection, however, no studies on seroepidemiology have been conducted, in contrast to the current hepatitis E time series studies that are all incidence-related.14
The present study retrospectively analyzed HEV serological data from three hospitals in Chongqing over the last 10 years and discovered that positive rate of anti-HEV IgG tended to increase, while positive rate of anti-HEV IgM and clinical incidence did not change, providing new concerns for the development of prevention and control strategies.
2 METHODS
2.1 Data collection
This study was approved by the Ethics Committee of the First Affiliated Hospital of Chongqing Medical University (CQMU 1st Hospital). To obtain as comprehensive data as possible, all people who were tested for hepatitis E antibodies at the three hospitals from January 2012 to December 2021, including health check-ups, outpatients and inpatients, were included in the study. All data were directly derived from the hospital information system, totaling 28 621 individuals from three hospitals (27 153 were from CQMU 1st Hospital, 1171 were from Jinshan Campus of CQMU 1st Hospital, and 297 were from the First Branch of CQMU 1st Hospital). Incidence of hepatitis E of Chongqing and whole China (2012–2021) were downloaded from official website of the data center of China public health science (www.phsciencedata.cn), Bureau of Disease Control and Prevention, National Health Commission of the People's Republic of China (http://www.nhc.gov.cn/jkj) and Chongqing center for disease control and prevention (CDC) (www.cqcdc.org).
2.2 Detection of anti-HEV IgM and IgG
All specimens were sent to the laboratory immediately after collection and stored at 4°C and tested within 12 h, and then the corresponding results and patients data were stored in the hospital information system. Serum anti-HEV IgM and anti-HEV IgG antibodies were detected by ELISA kits (Beijing Hyundai Gundam from January 2012 to August 2019, and Beijing Wantai Company from September 2019 to December 2021). Before replacing the kit, a total of 20 samples were tested for consistency check (10 positive, 10 negative), 4 randomly each day for 5 consecutive days. Seven of the positive specimens were weakly positive between 1 and 4 times the cutoff value, three were strongly positive >10 times the cutoff value, and only two weakly positive samples did not match the test. Consistency rate is 90% (18/20). S/CO value ≥ 1 was judged as positive, and all positive results were confirmed by re-examination.
2.3 Statistics
The quantitative data were presented as mean ± standard deviation (SD) and compared by Student's t test. χ2 or Fisher's exact test was used to enumeration data. The Fisher's exact test was used when more than 20% of the cells have an expected frequency of less than 5, or when at least one cell has an expected frequency of 1, otherwise, the χ2 test was employed. The binary logistic regression analysis was used to examine the odds ratio (OR) for antibody positivity related variables, and variables that were statistically significant by univariate analysis were included in the further multivariate analysis. Autoregressive integrated moving average (ARIMA) model was used to predict tendency of anti-HEV IgM and IgG. All statistical analyses were performed using the R (version 4.2.2) package. All tests were two-sided and p < 0.05 were considered significant.
3 RESULTS
3.1 Demographic characteristics
A total of 28 621 individuals from January 1, 2012 to December 31, 2021 were tested for anti-HEV IgG and IgM. The ratio of male to female is 1.27:1 (16005:12616). Average age is 47.24 ± 17.06 years (2–99 years). As shown in Table 1, the logistic regression analysis was used to examine demographic information including gender, age, ethnicity, marital status, and whether they were admitted for liver-related diseases. And we found that age and whether they came for liver-related disease were independent risk factors for antibody positivity. Until the age of 60, the rate of anti-HEV IgM positivity did not vary with increasing age (per 10 years), whereas the rate of anti-HEV IgG positivity gradually increased. Individuals with liver illness, on the other hand, had a much greater rate of positive for both anti- HEV IgM and anti-HEV IgG than individuals without liver disease.
| Univariate analysis | Multivariate analysis | ||||||||||
|---|---|---|---|---|---|---|---|---|---|---|---|
| IgM | IgG | IgM | IgG | ||||||||
| N | Anti-HEV IgM+, No. (%) | Anti-HEV IgG+, No. (%) | OR (95% CI) | p Value | OR (95% CI) | P Value | OR (95% CI) | p Value | OR (95% CI) | p Value | |
| Age group (year) | |||||||||||
| 0–20 | 1359 | 24 (1.77) | 85 (6.25) | 1 | 1 | 1 | 1 | ||||
| 21–30 | 4437 | 141 (3.18) | 408 (9.20) | 1.826 (1.179–2.827) | 0.007 | 1.518 (1.192–1.933) | 0.001 | 1.002 (0.386–2.606) | 0.996 | 1.416 (0.955–2.101) | 0.083 |
| 31–40 | 4585 | 189 (4.12) | 626 (13.65) | 2.392 (1.557–3.673) | <0.001 | 2.370 (1.873–2.998) | <0.001 | 0.934 (0.345–2.527) | 0.892 | 2.004 (1.340–2.999) | 0.001 |
| 41–50 | 5954 | 245 (4.11) | 998 (16.76) | 2.387 (1.563–3.646) | <0.001 | 3.018 (2.398–3.798) | <0.001 | 1.825 (0.701–4.750) | 0.218 | 2.814 (1.897–4.175) | <0.001 |
| 51–60 | 5496 | 217 (3.95) | 1096 (19.94) | 2.277 (1.487–3.487) | <0.001 | 3.750 (2.981–4.716) | <0.001 | 1.594 (0.610–4.168) | 0.341 | 3.702 (2.500–5.484) | <0.001 |
| >60 | 6790 | 165 (2.43) | 1185 (17.45) | 1.385 (0.899–2.134) | 0.139 | 3.169 (2.522–3.982) | <0.001 | 1.699 (0.657–4.390) | 0.274 | 3.561 (2.414–5.253) | <0.001 |
| Gender | |||||||||||
| Female | 12 616 | 449 (3.56%) | 1893 (15.00%) | 1 | 1 | ||||||
| Male | 16 005 | 532 (3.32%) | 2505 (15.65%) | 0.932 (0.82–1.059) | 0.278 | 1.051 (0.985–1.122) | 0.132 | ||||
| Ethnicitya | |||||||||||
| Han | 28 269 | 967 (3.42%) | 4353 (15.40%) | 1 | 1 | 1 | |||||
| Tujia | 245 | 9 (3.67%) | 26 (10.61%) | 1.077 (0.552–2.102) | 0.829 | 0.652 (0.434–0.981) | 0.001 | 0.682 (0.452–1.028) | 0.068 | ||
| Miao | 59 | 3 (5.08%) | 9 (15.25%) | 1.513 (0.473–4.841) | 0.486 | 0.989 (0.486–2.012) | 0.976 | 0.996 (0.487–2.040) | 0.992 | ||
| Others | 39 | 0 (0.00%) | 8 (20.51%) | 0.000 (0.000) | 0.998 | 1.418 (0.379) | 0.379 | 1.550 (0.708–3.395) | 0.273 | ||
| Marital statusb | |||||||||||
| Single | 3527 | 207 (5.87%) | 861 (24.41%) | 1 | 1 | 1 | 1 | ||||
| Married or cohabit | 25 046 | 773 (3.09%) | 3529 (14.09%) | 0.511 (0.426–0.612) | <0.001 | 0.508 (0.466–0.562) | <0.001 | 0.727 (0.436–1.211) | 0.221 | 0.993 (0.823–1.198) | 0.993 |
| Admitted for liver disease | |||||||||||
| Without | 20 518 | 633 (3.09%) | 2836 (13.82%) | 1 | 1 | 1 | 1 | ||||
| With | 8103 | 348 (4.29%) | 1562 (19.28%) | 1.489 (1.391–1.594) | <0.001 | 1.410 (1.234–1.611) | <0.001 | 2.284 (1.832–2.847) | <0.001 | 1.460 (1.331–1.601) | <0.001 |
- Abbreviations: CI, confidence interval; HEV, hepatitis E virus; OR, odds ratio.
- a N = 28 612, lower than 28 621 for missing values.
- b N = 28 573, lower than 28 621 for missing values.
3.2 Time series analysis of positive rate of anti-HEV IgG and IgM from January 2012 to December 2021
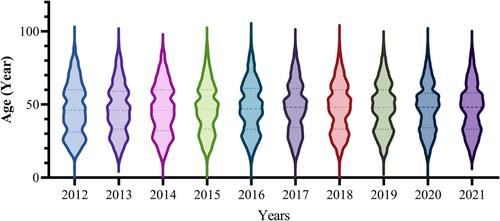
First, we analyzed the monthly trends of anti-HEV IgG and IgM positivity rates from January 2012 to December 2021. The anti-HEV IgG displayed an ascending pattern with a median of 9.54%, between the 25% and 75% quartiles of 4.61% and 17.07%, which is evident in Figure 1 and has increased from 1.61% in January 2012 to 50.63% in December 2021. In comparison, IgM fluctuated between a peak of 8.7% in March 2014 and a low of 0.31% in July 2020, with a median of 3.34% (the 25% and 75% quartile was 2.17% and 4.37%, respectively). We utilized the ARIMA model to forecast that anti-HEV IgG would experience a steady rise over the 2 years after 2021, whereas anti-HEV IgM had no significant alteration in trend (Figure 1). Since the previous section demonstrated an increase in antibody positivity with increasing age, we compared the age distribution of the tested population for each year, and the age distribution of the tested population for each of the last 10 years showed a similar composition (Figure 2).


3.3 Comparison of antibodies positive rates among groups of health screening, outpatients, and inpatients
Physicians may be more likely to order tests for those visiting the hospital for specific medical issues, which could lead to an overestimation of the number of positive antibody results. To reduce the effects of the composition of the attendees, we further split the test subjects into three categories: inpatients, outpatients, and those for health checkup examinees. As shown in Table 2, the 10-year combined anti-HEV IgG positive rates for health screening population, outpatient, and inpatient were 18.9%, 18.13%, and 14.06%, respectively. There was no significant difference between health screening and outpatient populations (p = 0.5907), with the inpatient population having the lowest rate of positivity. Outpatients had a much higher anti-HEV IgM positivity rate of 7.47%, compared with the 1.35% of health checkup populations and 1.88% of inpatients. Because above results revealed that whether or not a visit was for liver-related disease was an independent risk factor for antibody positive, we examined the data on outpatient and inpatient visits for liver disease. Of the 8035 outpatients, 2635 (32.79%) were admitted for liver related disease, which was significantly higher than the percentage of inpatients seen for liver disease, 5468/19623 (27.87%) (p < 0.001). And among those who visited for liver disease, 627/2635 (23.80%) and 179/2635 (6.79%) of outpatients with liver disease were positive for IgG and IgM, respectively, both significantly higher than the rate of IgG (936/5468, 17.12%) and IgM (169/5468, 1.26%) (both p < 0.001) positivity in inpatients with liver disease.
| Year | Health checkup examinees (N = 963) | Outpatients (N = 8035) | Inpatients (N = 19623) | |||||||||
|---|---|---|---|---|---|---|---|---|---|---|---|---|
| n | IgM+, No.(%) | IgG+, No.(%) | IgM+ and IgG+, No.(%) | n | IgM+, No.(%) | IgG+, No.(%) | IgM+ and IgG+, No.(%) | n | IgM+ No.(%) | IgG+, No.(%) | IgM+ and IgG+, No.(%) | |
| 2012 | 26 | 0(0) | 1(3.85) | 0(0) | 526 | 30(5.70) | 17(3.23) | 6(1.14) | 1494 | 38(2.54)### | 29(1.94) | 7(0.47) |
| 2013 | 15 | 0(0) | 0(0) | 0(0) | 542 | 34(6.27) | 19(3.51) | 3(0.55) | 1505 | 39(2.59)### | 55(3.65) | 15(1.00) |
| 2014 | 62 | 0(0) | 2(3.23) | 0(0) | 507 | 43(8.48)** | 39(7.69) | 11(2.17) | 1570 | 35(2.23)### | 75(4.78)# | 18(1.15) |
| 2015 | 58 | 0(0) | 1(1.72) | 0(0) | 567 | 43(7.58)** | 43(7.58) | 17(3.00) | 2027 | 50(2.47)### | 111(5.48) | 31(1.53) |
| 2016 | 57 | 1(1.75) | 2(3.51) | 0(0) | 692 | 38(5.49) | 66(9.54) | 17(2.46) | 2157 | 26(1.21)### | 170(7.88) | 16(0.74)### |
| 2017 | 46 | 1(2.17) | 3(6.52) | 0(0) | 808 | 52(6.44) | 112(13.86) | 24(2.97) | 2354 | 31(1.32)### | 249(10.58)# | 18(0.76)### |
| 2018 | 105 | 0(0) | 14(13.33) | 0(0) | 1024 | 91(8.89)** | 159(15.53) | 34(3.32) | 2393 | 48(2.01)### | 363(15.17) | 29(1.21)### |
| 2019 | 178 | 5(2.80) | 18(10.11) | 0(0) | 1189 | 97(8.16)* | 170(14.30) | 40(3.36)* | 2413 | 50(2.07)### | 280(11.60) | 27(1.12)### |
| 2020 | 158 | 2(1.27) | 47(29.75) | 0(0) | 1016 | 55(5.41)* | 336(33.07) | 48 (4.72)** | 1788 | 15(0.84)### | 589(32.94) | 14(0.78)### |
| 2021 | 258 | 4(1.55) | 94(36.43) | 4(1.55) | 1164 | 117(10.05)*** | 496(42.61) | 91(7.82)*** | 1922 | 36(1.87)### | 838(43.60) | 28(1.46)### |
| Total | 963 | 13(1.35) | 182(18.90) | 4(0.42) | 8035 | 600(7.47)*** | 1457(18.13) | 291(3.62)*** | 19 623 | 368(1.88)### | 2759(14.06)*, # | 203(1.03)### |
- Abbreviation: HEV, hepatitis E virus.
- * p < 0.05, **p < 0.01, ***p < 0.001 compared with healthy checkup examinees.
- # p < 0.05, ###p < 0.001 compared with outpatients.
3.4 No upward trend in the incidence of acute hepatitis E in Chongqing and nationwide from 2012 to 2021
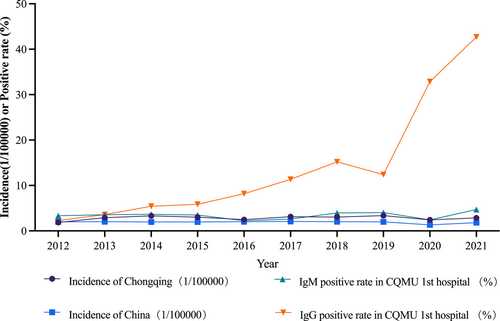
Seroepidemiologic data from our hospital suggested an increase in anti-HEV IgG for previous HEV infections, suggesting an increase of infected population, but no significant trend in anti-HEV IgM reflecting acute or presenting infections. To further confirm the phenomenon, we downloaded official 2012–2021 direct web-based data on hepatitis E from the Chinese National Epidemiological Data Network, official website of National Health Commission of China and Chongqing CDC for Chongqing and the whole country. As shown in Figure 3, like the anti-HEV-IgM trend in our hospital, the incidence of hepatitis E in Chongqing and nationwide has been relatively stable.

4 DISCUSSION
The rate of IgM and IgG positivity can be used to measure the level of infection in a population. IgM is often a sign of a current or recent infection, while IgG is usually used as an indicator of a prior infection due to its lengthy presence and the difficulty of pinpointing when it is positive. Chen et al.15 conducted a meta-analysis of swine hepatitis E seroprevalence studies in China from 2010 to 2019, which revealed a decrease in the proportion of positive antibody tests. However, it is difficult to make precise comparisons and combination between seroepidemiological data from different times and locations because of the complexity of the test kits available, the genetic characteristics of HEV strains, and hosts ethnic backgrounds. This is due to the many variables that can influence results, making it difficult to draw reliable conclusions from the data. Despite this, seroepidemiological data remains an invaluable tool for epidemiologists and healthcare professionals in understanding the spread of an infectious disease and informing decisions about prevention and treatment. Consequently, having a comprehensive and consistent epidemiological data set over a lengthy period of time is highly essential.
In this study, the rate of anti-HEV IgG positivity in Chongqing, a city in southwest China, has gradually increased over the last decade, but the positive rate of anti-HEV IgM has not altered. Although a rise in antibody positivity does not suggest an increase in antibody levels, it can indicate an increase in the number of patients infected with HEV. Since the positive rate of anti-HEV IgG increases with age, gradually increased positive rate of anti-HEV IgG might be probably caused by the increased cumulative infection rate of HEV with age. However, as shown in Figure 2, the age distribution of the tested population in each year of the last decade was largely similar, so is it possible that indeed the number of people infected with HEV is increasing gradually. What could be the cause for the annual clinical incidence of HEV in Chongqing and China not rising significantly, even though the number of people infected appears to be increasing each year? On the one hand, it is possible that better sanitation and awareness make it hard to meet enough viruses to develop symptoms, leading to a more subclinical infection. On the other hand, as viruses change over time, they become less infectious and pathogenic. Li et al.16 discovered that genotype 4d HEV had a reduced capacity to cause infection and illness compared with genotype 3ra HEV which is more common in developed countries, and that neither 4a nor 4h could infect the rabbit models. The most common genetic type found in China is mainly type 4. Therefore, whether the epidemiological changes caused by different virulence of different gene subtypes need to be further confirmed.
Another reason for the increasing positive rate is due to the continuous improvement of the test kits. In particular, the Wantai kit used after 2019 in the present study showed a higher positive rate compared with the other kits in several research.17, 18 However, the trend of anti-HEV IgM and IgG observed, and two kits used in this study remained consistent before and after 2019, suggesting that the change in trend was not related to the assay kit utilized. In addition, various populations tested with HEV antibodies were grouped in this study, and the population for health screening was closer to the general population, while data from outpatients and inpatients may be biased by selectively prescribed HEV antibody tests resulting from symptoms and purpose of visits. According to Table 2, anti-HEV IgM positive rate was generally higher in outpatients than in health checkups and inpatients during the same period. Previous research on the seroepidemiology of HEV has concentrated on blood donors19 and specific groups such as those with chronic liver disease,20 immunocompromised populations,21 dialysis populations,22 inflammatory bowel disease,23 and so on. There have been no large-scale studies comparing general outpatients to inpatients. Our findings imply that over the previous decade, outpatients with either liver illness or non-liver disease have consistently had the highest positive rate of anti-HEV IgM. One of the reasons for this phenomenon may be due to the fact that outpatients contain more visits for liver-related diseases. In addition, the probability of nosocomial HEV infection may be lower in hospitals due to more secure diets, whereas outpatients are more likely to seek experienced specialists for hepatitis-related symptoms and be given targeted test. In contrast, inpatients are often examined after abnormal liver function tests, which may be related to medications.
In conclusion, the 10-year consecutive data from the present study revealed a steady increase of anti-HEV IgG positivity in Chongqing, but the rate of clinical incidence of hepatitis E in both Chongqing and the whole nation remained relatively unchanged. It is imperative to develop long-term prevention and control strategies and the rationale for this needs to be further elucidated.
AUTHOR CONTRIBUTIONS
Shujun Zhang and Wenxiang Huang designed the study. Lingfeng Shi, Yanping Wang, and Xuemei Cao collected the data. Lingfeng Shi, Yanping Wang, Xuemei Cao, and Shujun Zhang analyzed the data. All authors drafted the manuscript and approved the final version.
ACKNOWLEDGMENTS
This study was supported by the Joint Project of Chongqing Health Commission and Science and Technology Bureau (NO. 2019MSXM076 and NO. 2020FYYX007) and the Senior Medical Talents Program of Chongqing for Young and Middle-aged (2019-181).
CONFLICT OF INTEREST STATEMENT
The authors declare no conflict of interest.
ETHICS STATEMENT
This study was conducted in accordance with the protocol and the principles of the Declaration of Helsinki. The protocol was approved by the Ethical Committee of the First Affiliated Hospital of Chongqing Hospital.
Open Research
DATA AVAILABILITY STATEMENT
The data that support the findings of this study are available from the corresponding author upon reasonable request.


