The association between serum 25-hydroxyvitamin D and the prevalence of herpes simplex virus
Abstract
Previous studies have reported a potential anti-infection effect for vitamin D. However, the relationship between vitamin D status and herpes simplex virus (HSV) infection has not yet been evaluated. Therefore, this study aimed to determine the association between serum 25-hydroxyvitamin D [25(OH)D] and infection with HSV types 1 and 2 (HSV-1 and HSV-2). Data were collected from the National Health and Nutrition Examination Survey from 2007 to 2016. The association between 25(OH)D and HSV prevalence was evaluated using propensity score matching (PSM) and univariate and multivariate logistic regression analyses. Overall, 14 174 participants were included in the final analysis. Before PSM, 8639 (60.9%) had positive HSV-1 and 2636 (18.6%) had HSV-2. The HSV-1 and HSV-2 positive groups had more females and older individuals (p < 0.05). The HSV-2 patients had lower 25(OH)D levels than those with HSV-1. Age and gender did not differ in the groups after PSM (p > 0.05). The 25(OH)D level was significantly lower in the HSV-1 and HSV-2 groups than in the non-HSV infection groups. Multivariate logistic regression showed that serum 25(OH)D level was negatively associated with HSV-1 and HSV-2 infection (odds ratio [OR] = 0.730 and 0.691, p < 0.001, respectively). Vitamin D deficiency was an independent risk factor for both HSV-1 and HSV-2 (adjusted OR = 2.205 and 2.704, p < 0.001, respectively). Lower serum 25(OH)D levels correlated significantly with increased HSV-1 and HSV-2 infection risk.
Abbreviations
-
- 25(OH)D
-
- 25-hydroxyvitamin D
-
- BMI
-
- body mass index
-
- HSV
-
- herpes simplex virus
-
- NHANES
-
- National Health and Nutrition Examination Survey
-
- PSM
-
- propensity score matching
1 INTRODUCTION
Herpes simplex virus (HSV) is an enveloped virus that has infected more than half of the world's population.1 HSV has two types (HSV-1 and HSV-2).2 The estimated infection rate of HSV overall is 66.6% in the 0–49 age group, and HSV-2 is 13.2% in the 15–49 age group. HSV-1 is mainly transmitted by oral-to-oral contact and causes orolabial ulcers,3 but it can also result in severe symptoms such as keratitis and central nervous system complications.4, 5 HSV-2 is a sexually transmitted infection. It causes genital herpes and can increase susceptibility to human immunodeficiency virus (HIV) infection.6 Symptoms of HSV infection are usually mild so asymptomatic cases can cause the spread of this virus.
Vitamin D is a steroid hormone classically involved in calcium metabolism and bone homeostasis.7 Vitamin D deficiency might lead to a higher susceptibility to viral and bacterial infections, and vitamin D supplementation has been observed to protect against acute viral infection.8 Low vitamin D levels have been associated with infection risk, including human papillomavirus, latent tuberculosis, COVID-19, and HIV.9-13 However, there is little literature regarding the association between vitamin D status and HSV infection. The present study aimed to explore the relationship between vitamin D and HSV infection based on a population survey database.
2 METHODS
2.1 Study population
The study data were from the National Health and Nutrition Examination Surveys (NHANES) 2007–2016. NHANES is a periodic survey conducted by the National Center for Health Statistics of the Centers for Disease Control and Prevention of the United States. The National Center for Health Statistics Research Ethics Review Board approved the NHANES study protocol, and informed consent was obtained from all subjects. All data are anonymous and freely accessible online (https://www.cdc.gov/nchs/nhanes/about_nhanes.htm). As this study used the open-access deidentified data, no additional ethics approval was required. The inclusion criteria were all participants registered in the NHANES database. The exclusion criteria were those who did not have the serum vitamin D and HSV tests.
2.2 Definition
The following demographic variables were obtained from the original database: age, gender, weight, height, season, history of hypertension, and type 2 diabetes. Body mass index (BMI) was calculated as weight (in kilograms) divided by the square of the height (in meters). Being overweight was defined as BMI ≥ 25 kg/m2.14 Heavy alcohol users were defined as males consuming more than 21 drinks and females more than 14 drinks per week. Smokers were defined as those having smoked at least 100 cigarettes throughout their entire life.
2.3 Serum vitamin D test
Serum 25-hydroxyvitamin D [25(OH)D] is a well-accepted indicator for evaluating vitamin D nutritional status. In this study, the 25(OH)D level was tested using a high-performance liquid chromatography-tandem mass spectrometry (LC-MS/MS) technique (https://wwwn.cdc.gov/nchs/nhanes/vitamind/analyticalnote.aspx?b=2015&e=2016&d=VID_I). We categorized the serum 25(OH)D levels into three clinically relevant categories: deficiency (<20 ng/ml), insufficiency (20–30 ng/ml), and sufficiency (≥30 ng/ml).15
2.4 HSV-1 and HSV-2
The viral-specific glycoprotein was tested to identify HSV-1 and HSV-2 infections. In this survey, only participants aged 18–49 years underwent testing for both HSV-1 and HSV-2 immunoglobulin G antibodies. HSV-1 and HSV-2 infections were defined with positive corresponding antibody results; non-HSV infection was defined as negative for both antibody types.
2.5 Statistical analysis
Continuous variables are expressed as mean ± standard variation. Categorical variables are expressed as percentages. The Student's t-test (for normally distributed variables), Mann–Whitney U test (for non-normally distributed variables), and χ2 test (for categorical variables) were used to evaluate differences between the groups. As the risk of viral infection may increase with age, we used propensity score matching (PSM) to select age- and gender-matched cases in the infection and noninfection groups. Patients were matched 1:1 based on their propensity scores, and the match tolerance value was 0.0001. Univariate and multivariate logistic regression (stepwise multivariate logistic regression) analyses were used to find factors associated with HSV infection. Factors with a p value less than 0.05 on univariate logistic regression were selected as candidate variables for multivariate regression analysis. Regression results are presented as odds ratios (OR) with 95% confidence intervals (CI). All tests were two-tailed, and results with p values less than 0.05 were considered statistically significant. All analysis was conducted using R 3.6.2 (https://www.r-project.org/) or SPSS 19.0.
3 RESULTS
3.1 Participant characteristics
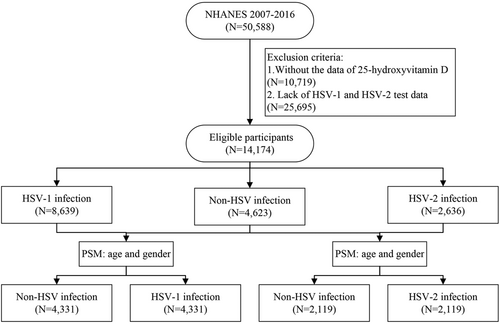
From 2007 to 2016, 50 588 participants were registered in the NHANES database. The participants who did not receive 25[OH]D and HSV tests were excluded. As a result, 14 174 cases were included in the final analysis (Figure 1). The baseline patient characteristics are presented in Supplementary Table 1. The mean age was 33.1 ± 9.4 years, and 52.0% were female. A total of 7330 (51.7%) participants were tested in the warm season (May–October). Hypertension was present in 18.6% of participants and type 2 diabetes in 8.0%. The percentages of tobacco and alcohol consumers were 35.5% and 25.0%, respectively. The mean BMI was 28.7 ± 7.3 kg/m2, and 65.0% were overweight (BMI ≥ 25 kg/m2). The mean value of 25(OH)D level was 23.6 ± 9.8 ng/ml, and 38.9% of participants had a vitamin D deficiency (<20 ng/ml).

| Variables | Non-HSV | HSV-1 | p | Non-HSV | HSV-2 | p |
|---|---|---|---|---|---|---|
| N | 4331 | 4331 | 2119 | 2119 | ||
| Age (years) | 30.0 ± 9.1 | 30.4 ± 9.1 | 0.04 | 36.1 ± 8.0 | 36.3 ± 8.1 | 0.412 |
| Age (years), n (%) | 1.000 | 0.943 | ||||
| 18–24 | 1491 (34.4) | 1491 (34.4) | 207 (9.8) | 207 (9.8) | ||
| 25–30 | 952 (22.0) | 952 (22.0) | 360 (17.0) | 355 (16.8) | ||
| 31–40 | 1161 (26.8) | 1161 (26.8) | 825 (38.9) | 844 (39.8) | ||
| 41–49 | 727 (16.8) | 727 (16.8) | 727 (34.3) | 713 (33.6) | ||
| Gender, n (%) | 1.000 | 0.491 | ||||
| Female | 2058 (47.5) | 2058 (47.5) | 1251 (59.0) | 1274 (60.1) | ||
| Male | 2273 (52.5) | 2273 (52.5) | 868 (41.0) | 845 (39.9) | ||
| Season, n (%) | <0.001 | <0.001 | ||||
| Summer (May–October) | 2420 (55.9) | 2162 (49.9) | 1231 (58.1) | 1044 (49.3) | ||
| Winter (November–April) | 1911 (44.1) | 2169 (50.1) | 888 (41.9) | 1075 (50.7) | ||
| Hypertension, n (%) | 619 (14.3) | 624 (14.4) | 0.902 | 400 (18.9) | 548 (25.9) | <0.001 |
| Type 2 diabetes, n (%) | 223 (5.1) | 219 (5.1) | 0.884 | 144 (6.8) | 235 (11.1) | <0.001 |
| Smoker, n (%) | 1254 (29) | 1336 (30.8) | 0.057 | 625 (29.5) | 986 (46.5) | <0.001 |
| Overdrink, n (%) | 971 (22.4) | 1142 (26.4) | <0.001 | 364 (17.2) | 554 (26.1) | <0.001 |
| BMI (kg/m2) | 27.5 ± 7.0 | 27.5 ± 6.6 | 0.578 | 27.6 ± 6.9 | 30.3 ± 7.7 | <0.001 |
| BMI ≥ 25 kg/m2, n (%) | 2426 (56.4) | 2583 (60.1) | <0.001 | 1218 (57.8) | 1592 (75.6) | <0.001 |
| 25(OH)D (ng/ml) | 25.0 ± 10.3 | 22.1 ± 9.1 | <0.001 | 26.1 ± 10.5 | 21.7 ± 9.9 | <0.001 |
| 25(OH)D categories (ng/ml) | <0.001 | <0.001 | ||||
| ≥30 | 1210 (27.9) | 763 (17.6) | 680 (32.1) | 367 (17.3) | ||
| 20–30 | 1698 (39.2) | 1604 (37.0) | 842 (39.7) | 728 (34.4) | ||
| <20 | 1423 (32.9) | 1964 (45.3) | 597 (28.2) | 1024 (48.3) | ||
- Note: Categorical values are shown as n (%). Continuous variables are shown as mean ± standard deviation.
- Crude association between 25(OH)D level and HSV-1 or HSV-2 infection after PSM.
- Abbreviations: 25(OH)D, 25-hydroxyvitamin D; BMI, body mass index; HSV, herpes simplex virus; PSM, propensity score matching.
3.2 Pre-PSM comparison
A total of 8639 (60.9%) cases were HSV-1 positive (HSV-1 group), and 2636 (18.6%) were HSV-2 positive (HSV-2 group). Overall, 1724 (12.2%) were positive for both HSV-1 and HSV-2, and 4623 (32.6%) were negative for both (non-HSV group). The baseline characteristics comparison for all participants is presented in Supporting Information: Supplementary Table 1. The infection subgroups, regardless of the HSV subtypes, contained more female and older individuals (p < 0.05) and had higher proportions of overweight, hypertensive, and diabetic patients. Cases with smoking and alcohol histories were more commonly found in the infection groups. The mean 25(OH)D level was lower in the infection subgroups, with a higher rate of vitamin D deficiency. The comparison between HSV-1 infected (22.9 ± 9.4 ng/ml) and HSV-2 infected patients (22.2 ± 10.3 ng/ml) showed a lower 25(OH)D level in the HSV-2 patients.
3.3 Post-PSM comparison
As the risk of viral infection may increase with age, we used PSM to select age and gender-matched cases between the infection and non-infection groups. The comparison between groups after PSM is summarized in Table 1. After PSM, no differences in age and gender were observed between the infection and noninfection groups.
The 25(OH)D levels were significantly lower in the HSV-1 group than in the non-HSV group (22.1 ± 9.1 ng/ml vs. 25.0 ± 10.3 ng/ml, p < 0.001). Higher prevalence of vitamin D deficiency (45.3% vs. 32.9%, p < 0.001) was found in the HSV-1 infection group.
Compared with the non-HSV group, cases with HSV-2 infection had a higher prevalence of overweight, hypertension, diabetes, smoking, and excess alcohol history. Like the HSV-1 subgroup, the HSV-2 subgroup had lower 25(OH)D levels than the non-HSV group (21.7 ± 9.9 ng/ml vs. 26.1 ± 10.5 ng/ml, p < 0.001). The percentages of vitamin D deficiency were higher in the HSV-2 group than in the non-HSV group (48.3% vs. 28.2%, p < 0.001).
3.4 Univariate and multivariate logistic regression: 25(OH)D levels and HSV infection risk
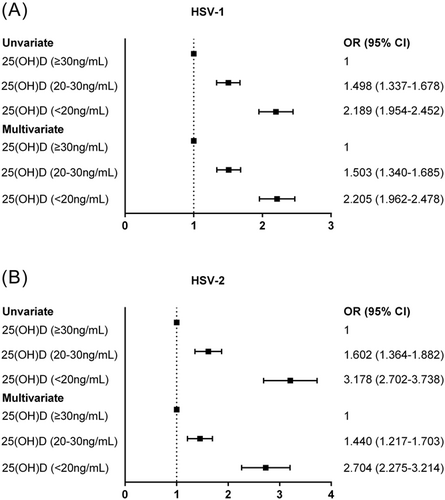
Univariate logistic regression analysis was performed after PSM to identify HSV risk factors. As shown in Table 2 and Figure 2A,B. The 25(OH)D level was negatively correlated with HSV-1 and HSV-2 infections (crude OR = 0.731 and 0.644, respectively, p < 0.001). The risk of HSV-1 infection was significantly higher in participants with vitamin D deficiency and insufficiency than in those with sufficiency. The same tendency was also observed in the HSV-2 population.
| Characteristics | HSV-1 infection crude OR (95% CI) | HSV-2 infection crude OR (95% CI) |
|---|---|---|
| Continuous serum 25(OH)D per 10 ng/ml increase | 0.731 (0.699–0.765) | 0.644 (0.604–0.687) |
| Categorical serum 25(OH)D (ng/ml) | ||
| ≥30 | 1.000 | 1.000 |
| 20–30 | 1.498 (1.337–1.678) | 1.602 (1.364–1.882) |
| <20 | 2.189 (1.954–2.452) | 3.178 (2.702–3.738) |
- Abbreviations: 25(OH)D, 25-hydroxyvitamin D; CI, confidence interval; HSV, herpes simplex virus; OR, odds ratios; PSM, propensity score matching.

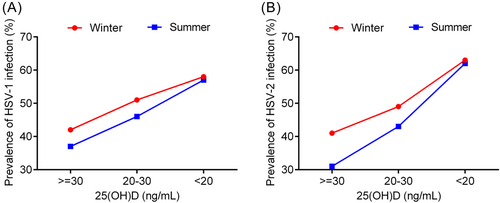
The factors with p values less than 0.05 on univariate analysis were included in the multivariate regression. After adjustments for age, drinking history, and testing season, the serum 25(OH)D level was negatively associated with the HSV-1 infection rate (OR = 0.730, 95% CI = 0.696–0.765, p < 0.001) (Table 3). This risk was significantly higher in participants with vitamin D deficiency (adjusted OR = 2.205, 95% CI = 1.962–2.478, p < 0.001) and insufficiency (adjusted OR = 1.503, 95% CI = 1.340–1.685, p < 0.001) than in those with vitamin D sufficiency. As for HSV-2 infection, multivariate logistic analysis was carried out after adjustments for covariates including hypertension, diabetes, smoking history, drinking history, testing season, and BMI; the same results were achieved (serum 25(OH)D level, adjusted OR = 0.691, 95% CI = 0.646–0.740, p < 0.001; vitamin D deficiency, adjusted OR = 2.704, 95% CI: 2.275–3.214, p < 0.001) and insufficiency (adjusted OR = 1.440, 95% CI = 1.217–1.703, p < 0.001). The association between serum 25(OH)D level and HSV infection was independent of the 25(OH)D testing season (Supporting Information: Supplementary Table 2; Figure 3A,B).
| Characteristics | HSV-1 infection adjusted OR (95% CI)a | HSV-2 infection adjusted OR (95% CI)b |
|---|---|---|
| Continuous serum 25(OH)D per 10 ng/ml increase | 0.730 (0.696–0.765) | 0.691 (0.646–0.740) |
| Categorical serum 25(OH)D (ng/ml) | ||
| ≥30 | 1.000 | 1.000 |
| 20–30 | 1.503 (1.340–1.685) | 1.440 (1.217–1.703) |
| <20 | 2.205 (1.962–2.478) | 2.704 (2.275–3.214) |
- Abbreviations: 25(OH)D, 25-hydroxyvitamin D; BMI, body mass index; CI, confidence interval; HSV, herpes simplex virus; OR, odds ratios; PSM, propensity score matching.
- a Adjusted for season, smoker, and overdrink.
- b Adjusted for the season, hypertension, type 2 diabetes, BMI, smoker, and overdrink.

4 DISCUSSION
The present study investigated the association between vitamin D and HSV infection risk based on population-based data. We found that serum 25(OH)D levels were inversely associated with the risk of HSV-1 and HSV-2 infection in American adults aged 18-49.
Lower 25(OH)D levels and a higher frequency of vitamin D deficiency were found in the HSV-infected groups. This result emerged after propensity matching for two major confounding factors: age and sex. Multivariate analysis also confirmed the independent association of 25(OH)D level and HSV infection after adjusting for more potential confounding factors. These results support the hypothesis that vitamin D has an anti-infection function.16
The anti-infection role of vitamin D has been frequently reported by previous studies.16, 17 Furthermore, several epidemiological studies have reported the association of vitamin D deficiency with the risk for infectious diseases.18-21 A possible explanation is that vitamin D is involved in our innate immune responses.22 1,25(OH)2D3 is the active form of vitamin D and is thought to exert its anti-inflammatory actions by binding to the vitamin D receptor in target tissues.23 Furthermore, the level of vitamin D may involve in the expression of several innate immune defense genes, including genes encoding cytokines, antimicrobial peptides, chemokines, and pattern recognition receptors.22, 24 Moreover, 1,25(OH)2D3 enhances the antimicrobial activities of the innate immune cells by stimulating the production of endogenous antimicrobial cathelicidin.25 In addition, vitamin D regulates the inflammatory cascade by modulating the nuclear factor kappa B pathway.26 In short, vitamin D deficiency may suppress the immune system and result in susceptibility to various pathogens.
Our results suggested that vitamin D deficiency was strongly associated with an increased risk of HSV infection. However, whether vitamin D supplementation is protective remains unclear. Therefore, further studies are warranted to evaluate the effects of vitamin D supplements on HSV infection.
The current study was strong on a number of points. First, we used data from the high-quality NHANES study, which comprised a large representative sample of the US population. Therefore, the results are robust, credible, and generalizable, at least in a Western population. Second, the measurement of 25(OH)D concentrations was performed with the LC-MS/MS technique, which is both accurate and reliable.27 Finally, serum HSV antibody positivity does not mean active infection. The association between vitamin D levels and active HSV infection should be further investigated.
The main limitation of this study was the cross-sectional nature of the study design; we could not establish the causal relationship between vitamin D and HSV infection. Second, we could not obtain HSV infection status from the original database.
In conclusion, a lower serum 25(OH)D level was significantly associated with a higher risk of HSV-1 and HSV-2 infection. However, whether vitamin D supplementation can prevent HSV infection remains unclear and needs further investigation.
AUTHOR CONTRIBUTIONS
Study concept and design: Jiaofeng Huang and Su Lin. Data acquisition and drafting manuscript of the paper: Jiaofeng Huang and Yinlian Wu. Data collection and data analysis: Jiaofeng Huang, Su Lin, and Mingfang Wang. Tables and figures preparation: Jiaofeng Huang and Yinlian Wu. Final approval of the version to be published: Su Lin. All authors have read and agreed to the published version of the manuscript.
ACKNOWLEDGMENTS
This research was supported by Joint Funds for the Innovation of Science and Technology, Fujian Province (No. 2020Y9105), and the Natural Science Foundation of Fujian Province (No. 2022J01700).
CONFLICT OF INTEREST
The authors declare no conflict of interest.
Open Research
DATA AVAILABILITY STATEMENT
To download the data used in these analyses, please visit the National Center for Health Statistics at https://wwwn.cdc.gov/nchs/nhanes/tutorials/default.aspx.


