Rhinovirus persistence during the COVID-19 pandemic—Impact on pediatric acute wheezing presentations
Abstract
Rhinoviruses have persisted throughout the COVID-19 pandemic, despite other seasonal respiratory viruses (influenza, parainfluenza, respiratory syncytial virus, adenoviruses, human metapneumovirus) being mostly suppressed by pandemic restrictions, such as masking and other forms of social distancing, especially during the national lockdown periods. Rhinoviruses, as nonenveloped viruses, are known to transmit effectively via the airborne and fomite route, which has allowed infection among children and adults to continue despite pandemic restrictions. Rhinoviruses are also known to cause and exacerbate acute wheezing episodes in children predisposed to this condition. Noninfectious causes such as air pollutants (PM2.5, PM10) can also play a role. In this retrospective ecological study, we demonstrate the correlation between UK national sentinel rhinovirus surveillance, the level of airborne particulates, and the changing patterns of pediatric emergency department presentations for acute wheezing, before and during the COVID-19 pandemic (2018–2021) in a large UK teaching hospital.
1 INTRODUCTION
One of the virological oddities during the COVID-19 pandemic has been the persistence—even the predominance—of rhinoviruses globally, in the absence of most of the other seasonal respiratory viruses (influenza, parainfluenza, respiratory syncytial virus (RSV), human metapneumonivirus (hMPV). Indeed, it is recognized that influenza and rhinoviruses compete, and the absence of influenza for the first 16–18 months of the pandemic (from March 2020) allowed rhinoviruses to become dominant in many parts of the world.1-3
Earlier studies on rhinoviruses have demonstrated their ability to transmit through aerosols,4, 5 which have been reiterated in more recent studies.6, 7 As nonenveloped viruses, rhinoviruses can survive longer on surfaces and resist alcohol-containing disinfectants, allowing effective fomite transmission.8, 9 This has likely helped rhinovirus to continue to propagate through populations despite the imposition of various pandemic masking, social distancing, and lockdown measures, as people still continue to mix when performing “essential” activities, like grocery shopping, some essential work duties, and any related childcare activities.10
Another well-recognized characteristic of rhinoviruses is their ability to cause acute wheezing and exacerbations of asthma in children—a common winter season healthcare presentation in pediatric emergency departments (PEDs).11-13 Such clinical wheezing can also be exacerbated by the inhalation of airborne particulate material in the ≤2.5 and ≤10 µm diameter range (PM2.5, PM10).13-15
Here, we describe trends in PED presentations with acute wheeze, pre-and during the pandemic, and compare this to trends in national rhinovirus circulation and local concentrations of airborne particulates.
2 METHODS
In this retrospective ecological study, we extracted the data of all children (aged 0 months to 18 years) presented to PED between January 2018 to December 2021, from the University Hospitals of Leicester NHS Trust. Children who were coded as “asthma” or “viral-induced wheeze (VIW)” by the clinicians as the first diagnosis in the PED were analyzed. These two terms are from the Emergency Care Data Set, a Systematized Nomenclature of Medicine Clinical Term compliant nationally mandated coding system.
Demographic data including age at presentation, ethnicity, and gender were extracted. The patient groups were further divided into under 5 years (aged 0 months to 5 years) and above 5 years (aged 5 years 1 month to 18 years) subgroups.
Contemporaneous air quality index (AQI) data were also obtained. The AQI is an index that reflects multiple air pollutants. As it is categorical data, the monthly mean of AQI cannot be calculated. Instead, we used the monthly mean of the two main pollutants—particulate matter ≤2.5 µm in diameter (PM2.5) and particulate matter ≤10 µm in diameter (PM10). The data were obtained from the Department of Environment Food and Rural Affair annual and exceedance statistic.16
The location for the PM2.5 data measurement was at the University of Leicester, which is assumed to be representative of the City of Leicester. The location for the PM10 data measurements was at the roadside of the Leicester section of the A594, representing Leicester's central distributor road network.
The levels of circulating respiratory viruses including rhinovirus, RSV, parainfluenza, hMPV, and adenovirus were obtained from the weekly national influenza and COVID-19 surveillance reports by Public Health England.17-19 The values of weekly positivity for rhinovirus were obtained from the figures within these national surveillance reports (Supporting Information: Figures S4–S6).
3 RESULTS
Table 1 shows the characteristics of the children presenting to PED with acute wheezing. The percentage of children according to age group, gender, and ethnicity did not differ much during 2018–2021, though the absolute numbers of such cases were 30%–50% lower across the different age groups in 2020.
| 2018 | 2019 | 2020 | 2021 | |
|---|---|---|---|---|
| Total number of PED presentations with acute wheezing, n | 2805 | 2971 | 1622 | 2814 |
| Male, n (%) | 1748 (62) | 1841 (62) | 1023 (63) | 1713 (61) |
| White British, n (%) | 1337 (48) | 1420 (48) | 743 (46) | 1340 (45) |
| BAME, n (%) | 1139 (41) | 1211 (41) | 663 (41) | 1147 (41) |
| Mixed White and other White background, n (%) | 301 (11) | 307 (10) | 179 (11) | 290 (10) |
| Not stated, n (%) | 28 (1) | 33 (1) | 37 (2) | 37 (1) |
| PED presentations of children under 5, n | 2069 | 2096 | 1035 | 1942 |
| White British, n (%) | 1060 (51) | 1071 (51) | 502 (49) | 1007 (52) |
| BAME, n (%) | 767 (37) | 778 (37) | 385 (37) | 707 (36) |
| Mixed White and other White background, n (%) | 229 (11) | 227 (11) | 128 (12) | 200 (10) |
| Not stated, n (%) | 13 (1) | 20 (1) | 20 (2) | 28 (1) |
| PED presentations of children over 5, n | 736 | 875 | 587 | 872 |
| White British, n (%) | 277 (38) | 349 (40) | 241 (41) | 333 (38) |
| BAME, n (%) | 372 (51) | 433 (49) | 278 (47) | 440 (50) |
| Mixed White and other White background, n (%) | 72 (10) | 80 (9) | 51 (9) | 90 (10) |
| Not stated, n (%) | 15 (2) | 13 (1) | 17 (3) | 9 (1) |
- Abbreviations: BAME, Black, Asian, and minority ethnicity; PED, pediatric emergency department.
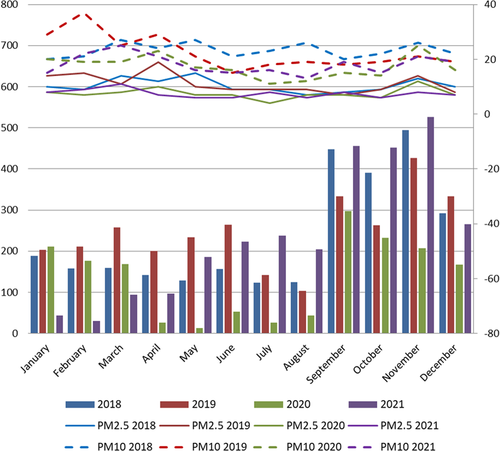
Table 2 and Figure 1 show that the numbers of PED presentations for acute wheezing in 2020–2021 were very similar to those in 2018–2019 in the same months—except for April–August 2020, November 2020, and January–March 2021. There was also a drop in the number of all PED presentations between March 2020 and February 2021.
| Total number of all PED presentation, n | Number of PED presentations with acute wheezing, n | Monthly mean PM2.5 (μg/m3) | Monthly mean PM10 (μg/m3) | ||||||||||||||
|---|---|---|---|---|---|---|---|---|---|---|---|---|---|---|---|---|---|
| 2018 | 2019 | 2020 | 2021 | 2018 | 2019 | 2020 | 2021 | 2018 | 2019 | 2020 | 2021 | 2018 | 2019 | 2020 | 2021 | ||
| January | 4303 | 5268 | 5177 | 2613 | 189 | 203 | 211 | 43 | 10 | 14 | 8 | 8 | 20 | 29 | 20 | 15 | |
| February | 4039 | 5157 | 4854 | 2563 | 158 | 211 | 177 | 30 | 9 | 15 | 7 | 9 | 21 | 37 | 19 | 22 | |
| March | 4515 | 6191 | 4119 | 4103 | 159 | 257 | 169 | 94 | 14 | 11 | 8 | 11 | 27 | 25 | 19 | 25 | |
| April | 4583 | 5532 | 1758 | 4675 | 142 | 200 | 26 | 97 | 12 | 19 | 10 | 7 | 24 | 29 | 23 | 21 | |
| May | 4967 | 5357 | 2489 | 5838 | 129 | 234 | 13 | 186 | 15 | 10 | 7 | 6 | 27 | 21 | 17 | 16 | |
| June | 4775 | 5238 | 2723 | 6268 | 156 | 264 | 53 | 223 | 9 | 9 | 7 | 6 | 21 | 15 | 16 | 15 | |
| July | 4539 | 4835 | 2916 | 5403 | 123 | 142 | 26 | 237 | 9 | 9 | 4 | 8 | 23 | 18 | 11 | 16 | |
| August | 4085 | 4459 | 3349 | 5029 | 124 | 103 | 43 | 204 | 7 | 9 | 7 | 6 | 26 | 19 | 12 | 13 | |
| September | 5087 | 5575 | 4207 | 7046 | 448 | 334 | 298 | 456 | 8 | 7 | 7 | 8 | 20 | 18 | 15 | 19 | |
| October | 5470 | 5396 | 3781 | 5898 | 391 | 263 | 232 | 452 | 9 | 9 | 6 | 6 | 22 | 19 | 14 | 15 | |
| November | 6561 | 6400 | 3633 | 6149 | 494 | 426 | 207 | 526 | 13 | 14 | 12 | 8 | 26 | 21 | 25 | 21 | |
| December | 5986 | 6693 | 3127 | 4831 | 292 | 334 | 167 | 266 | 10 | 8 | 7 | 7 | 22 | 19 | 16 | 19 | |
- Abbreviation: PED, pediatric emergency department.

The levels of airborne environmental particulates (PM2.5 and PM10) did not vary significantly during 2018–2021 for April–July (one-way analysis of variance: PM2.5, p value = 0.08; PM10, p value = 0.12) (Table 2, Supporting Information: Figures S1–S4).
Our local virology laboratory ceased all routine testing for seasonal respiratory viruses during this period to cope with the SARS-CoV-2 testing in the first wave of the COVID-19 pandemic. However, national sentinel surveillance testing for seasonal respiratory viruses continued, with data available from Public Health England (PHE) surveillance reports during 2018–2021 (Supporting Information: Figures S5–S7).17-19
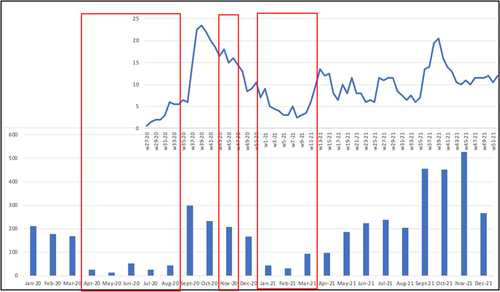
These national reports showed that during 2020 and early 2021, the other common seasonal respiratory viruses (influenza, RSV, parainfluenza virus, hMPV) were mostly completely absent, except for a persistent low-level background of adenovirus. There was an ongoing, though the fluctuating incidence of rhinovirus. Although there is a discontinuity in the PHE surveillance reports (Supporting Information: Figure S5) for rhinovirus during weeks 15–26 (April–July) 2020, the incidence trend of rhinovirus during this period appears to be relatively low. Figure 2 shows that the variation of rhinovirus incidence approximately correlated to the number of PED presentations with acute wheeze.

Once the national lockdown restrictions were eased in March 2021, the incidence of other seasonal respiratory viruses increased, particularly parainfluenza (week 15–31 of 2021), RSV (week 23 of 2021 to week 3 of 2022), and hMPV (week 39 of 2021 to week 3 of 2022) (Supporting Information: Figure S7).
4 DISCUSSION
These study findings suggest that the primary reason for the drop in the number of PED presentations for acute wheezing during April–August 2020, November 2020, and January–March 2021 (compared to the same periods in 2018–2019) is a decrease in the national incidence of rhinovirus over these periods. These periods correlated with the imposition of national and local lockdown measures (first national lockdown March 26, 2020 to March 23, 2020, local lockdown in Leicester, July 4, 2020 to August 31, 2020, second national lockdown November 5, 2020 to December 2, 2020, and third national lockdown January 6, 2021 to March 8, 2021).20 During these periods, strict containment measures were imposed which required everyone to stay at home, except for a limited number of circumstances such as essential shops and work. Schools, children's playgrounds, and parks were closed.
Based on the contemporaneous plots of PM2.5 and PM10 (Supporting Information: Figures S1–S4), these airborne particulates appeared to have played no role in this decrease. Similar findings were reported in a US study, where a decrease in asthma-related healthcare utilization was more closely linked to a decrease in circulating rhinovirus rather than changes in airborne pollutants.21
The persistence and dominance of rhinoviruses during the COVID-19 pandemic suggests that the social distancing restrictions applied during the lockdown were more effective in suppressing the other seasonal respiratory viruses than rhinoviruses.22, 23
Other reasons for a reduction in PED attendances for recurrent wheezing during the pandemic lockdown periods could include more home-schooling with less social contact with other children (most schools closed during national and local lockdowns). This reduced mixing would have reduced the exposure to both seasonal respiratory viruses as well as other outdoor allergens. Staying at home could also have improved compliance with preventative medication.24 Health-seeking behavior had also changed during the pandemic, as fear of COVID-19 led to fewer hospital presentations.25, 26
As an ecological study, this study has some limitations. The causal relationship between the drop in PED presentations and circulating rhinovirus could not be drawn on an individual level, and thus more individual-based observational studies might be required. The data for rhinoviruses were obtained from national sentinel surveillance testing due to the cessation of local laboratory testing for respiratory viruses, though we note that some weeks of surveillance data were not available. As such, the assumption was made that local rhinovirus prevalence correlated with the national data. Besides, other factors that might cause a reduction in PED attendances could not be strictly excluded.
In summary, COVID-19 pandemic lockdown measures reduced the incidence of rhinoviruses and other seasonal respiratory viruses, globally, which were correlated with reductions in PED presentations for acute wheezing. The level of airborne pollutants (PM2.5 and PM10) showed little correlation with this trend in acute wheezing during the pandemic.
AUTHOR CONTRIBUTIONS
The study was conceived by Kah Wee Teo, Damian Roland, and Erol A. Gaillard. Kah Wee Teo, Deepa Patel, and Shilpa Sisodia collated and curated the data. These data were reviewed and analyzed by Kah Wee Teo and Julian W. Tang who also drafted the first version of manuscript. Further editing and revision was performed by all authors, before submission.
CONFLICT OF INTEREST
The authors declare no conflict of interest.
Open Research
DATA AVAILABILITY STATEMENT
All the data are shown in the manuscript and/or are publicly available on government websites (the national respiratory virus surveillance data). All data are available upon reasonable request.


