Differential expression profile of long noncoding RNAs in chronic HBV infection: New insights into pathogenesis
Qingqin Hao and Zheng Wang contributed equally to this study.
Abstract
Increasing studies have revealed that long noncoding RNAs (lncRNAs) might play vital roles in the development and progression of various diseases including viral infectious diseases. However, the expression and biological functions of lncRNAs in chronic hepatitis B virus (HBV) infection remain largely unknown. Therefore, lncRNA microarray was performed to analyze the lncRNAs' and messenger RNAs' (mRNAs) expression profiles in liver tissues from patients with chronic HBV infection. Subsequently, a comprehensive bioinformatics analysis was conducted to investigate the potential functions of the differentially expressed genes. As a result, a total of 203 differentially expressed lncRNAs and 180 mRNAs were identified in chronic HBV infection. The expressions of five differentially expressed lncRNAs were further validated using quantitative real-time polymerase chain reaction. Gene ontology, pathway analysis, and gene set enrichment analysis revealed that differentially expressed lncRNAs might be mainly be involved in cytokine-cytokine receptor interaction and varied biotransformation processes, including fatty acid metabolism, amino acid metabolism, carbon metabolism, and drug metabolism. Additionally, coexpression networks between differentially expressed lncRNAs and mRNAs were constructed to reveal the hub regulator and analyze the functional pathways. This study provided an overview of lncRNA and mRNA expression in liver tissues from patients with chronic HBV infection. These differentially expressed lncRNAs might play crucial roles in the pathogenesis and progression of chronic HBV infection, which deserve further investigation.
Highlights
This study provided an overview of lncRNA expression in liver tissues from patients with chronic HBV infection.
These lncRNAs might play crucial roles in the pathogenesis and progression of chronic HBV infection through cytokine-cytokine receptor interaction and multiple biotransformation processes, especially fatty acid degradation.
Abbreviations
-
- BP
-
- biological processes
-
- CC
-
- cellular components
-
- GO
-
- Gene Ontology
-
- GSEA
-
- gene set enrichment analysis
-
- HBV
-
- hepatitis B virus
-
- KEGG
-
- Kyoto Encyclopedia of Genes and Genomes
-
- lncRNAs
-
- long noncoding RNAs
-
- MF
-
- molecular functions
-
- qRT-PCR
-
- quantitative real-time polymerase chain reaction
1 INTRODUCTION
Chronic hepatitis B virus (HBV) infection remains a serious global public health problem with significant morbidity and mortality.1 Globally, an estimated 257 million people have chronic HBV infection, accounting for nearly one million deaths annually.2 The natural history of chronic HBV infection varies widely and is affected by a complex interplay between HBV replication and host immune response. With the progression of chronic HBV infection, it could evolve toward serious liver diseases, such as cirrhosis, liver failure, and hepatocellular carcinoma (HCC).3 Currently, antiviral treatment for HBV infection includes PEGylated interferon (IFN)-α and nucleoside/nucleotide analogs. However, largely due to the persistence of the covalently closed viral circular DNA and the failure of a sufficiently robust, functional, and sustained immune response, these treatments are less than satisfactory.4 Therefore, a better understanding of the pathogenesis of chronic HBV infection is urgently needed to improve the success of future therapies.
Long noncoding RNAs (lncRNAs) are RNA transcripts longer than 200 nucleotides, without protein translation capacity.5 Initially, they were considered as transcriptional noise without biological function. Recently, increasing studies revealed that lncRNAs, functioning as regulatory factors, might regulate gene expression by interacting with RNA, DNA, and protein at various levels, such as chromatin modification, transcription, and posttranscriptional processing, and played critical roles in various physiological and pathological processes, and associated with many diseases, including viral infectious diseases.6, 7 Recent studies suggested that lncRNAs might demonstrate diverse effects on the interactions between virus and host factors, and consequently determined the clinical outcome of infectious diseases.6 For instance, HULC could activate HBV replication by HBx/STAT3/miR-539/APOBEC3B signaling, leading to the growth of liver cancer.8 lncRNA NRON, highly expressed in resting CD4+ T lymphocytes, could be involved in HIV-1 latency by specifically inducing Tat protein degradation.9 Additionally, lncRNA#32 could regulate the level of IFN-stimulated genes under both unstimulated and type I IFN-stimulated conditions through interactions with hnRNPU and ATF2, and therefore plays an important role in host antiviral responses.10 However, the lncRNA profile and their biological functions in chronic HBV infection remain largely unknown.
Therefore, in this study, lncRNA microarray was conducted to comprehensively identify differentially expressed lncRNAs and messenger RNAs (mRNAs) in chronic HBV infection. Subsequently, comprehensive bioinformatics analyses were performed to investigate the potential functions of these genes. Finally, coexpression networks were further constructed to clarify the interaction between lncRNAs and mRNAs. These findings will provide a better understanding of the potential roles of lncRNAs in the pathogenesis and progression of chronic HBV infection.
2 MATERIALS AND METHODS
2.1 Patient and sample collection
Liver tissues were obtained from 16 patients who received liver biopsy or hepatectomy in Wuxi No. 5 People's Hospital during the period from March to July 2019, including nine patients with chronic HBV infection and seven noninfected liver tissues (controls). The diagnosis of chronic HBV infection was according to the Guidelines for Prevention and Treatment of Chronic Hepatitis B, China (2015).11 Of the seven noninfected liver tissues, three normal samples used for microarray analysis were from patients with HCC. These normal tissues were distant from the tumor edge for 5 cm and had no clinical signs of hepatitis and viral infections. And the others were from patients who received liver biopsy for abnormal liver function had no clinical signs of viral infections. Patients with liver disease due to diabetes, metabolism disorders, or severe cardiovascular diseases, and coinfection with human immunodeficiency virus or hepatitis A/C/D/E virus were excluded. All samples were confirmed by experienced pathologists. The clinicopathological characteristics of patients are listed in Table S1. Liver tissues were collected after liver biopsy, followed by washing in precold phosphate-buffered solution and immediately stored in liquid nitrogen for the following research.
The study was conducted according to the ethical standards of the Declaration of Helsinki and was approved by the Ethics Committee of Wuxi Red Cross Blood Center. Written informed consent was obtained from all participants.
2.2 Total RNA extraction and quality control
Total RNA from tissue samples was extracted with the Trizol reagent (Invitrogen, Carlsbad, CA). The quantification and quality of RNA was measured by NanoDrop ND1000 (Agilent Technologies, CA), and the integrity of RNA and DNA contamination was assessed by standard denaturing agarose gel electrophoresis (Invitrogen).
2.3 Microarray analysis
The Arraystar Human LncRNA Arrays V5 (Arraystar, Rockville, MD) was used to identify differently expressed lncRNA and mRNA based on the manufacturer's standard protocols (KangChen Bio-tech, Shanghai, China).12, 13 This microarray covers about 39 317 (8393 gold standard lncRNAs and 30 924 reliable lncRNAs) lncRNAs and 21 174 coding transcripts. lncRNAs are carefully extensively collected from all major public databases and repositories, knowledge-based mining of scientific publications, and their lncRNA discovery pipelines: FANTOM5 CAT (v1), GENECODE (v29), RefSeq (updated to November 2018), BIGTranscriptome (v1), knownGene (updated to November 2018), LncRNAdb, LncRNAWiki, RNAdb, NRED, CLSFL, NONCODE (v5), MiTranscriptome (v2), and lncRNA discovery pipeline from more than 47 Tb RNA-seq data.
2.4 Gene Ontology, KEGG pathway analysis, and gene set enrichment analysis
Gene Ontology (GO) and Kyoto Encyclopedia of Genes and Genomes (KEGG) pathway analysis were performed to annotate the biological functions of differentially expressed mRNAs. Biological processes, molecular functions, and cellular components were analyzed with GO database (http://www.geneontology.org). The significant pathways were identified according to the KEGG database (http://www.genome.jp/kegg/). A two-sided Fisher's exact test was used to identify the significance of GO terms and KEGG pathways with P < .05.
Gene set enrichment analysis (GSEA),14 a computational methodology to identify key pathways and gene sets, was also performed to determine whether a priori defined set of genes show statistically significant differences between two biological states. For mRNAs, we analyzed the data using GseaPreRanked module by ranking fold changes of mRNAs. For lncRNAs, we first calculated Pearson's correlation coefficient between the selected lncRNA and all mRNAs, and then analyzed the mRNAs data using GseaPreRanked module by ranking Pearson's correlation coefficient of mRNAs. A value of false discovery rate (FDR) < 0.05 was set as the threshold to consider statistical significance.
2.5 lncRNA-mRNA coexpression network analysis
To associate the lncRNAs with direct regulated expression of target mRNAs, lncRNA-mRNA coexpression networks were constructed. Pearson's correlation coefficient was calculated between differentially expressed lncRNAs and mRNAs, and pairs (lncRNA-mRNA) with significant correlation (0.98 or greater) were selected to construct the network with Cytoscape. Each lncRNA or mRNA corresponded to a node and the connections between lncRNAs and mRNAs were represented by an edge, indicating a strong correlation. To estimate the relative significance of lncRNAs or mRNAs in the network, we calculated the core degree defined as the number of directly linked lncRNAs or mRNAs. A higher degree indicated a more important role in the network.
2.6 Quantitative real-time polymerase chain reaction
After genomic DNA was further removed from total RNA with Baseline-ZERO DNase (Epicentre, Wisconsin), total RNA was then reverse-transcribed to complementary DNA (cDNA) with SuperScript III Reverse Transcriptase Kit (Invitrogen) according to the manufacturer's instructions. Quantitative polymerase chain reaction (PCR) was then performed using 2× PCR Master Mix (Arraystar) on ViiA 7 Real-Time PCR System (Applied Biosystems) in a total volume of 10 µL, which contained 2× Master Mix (Arraystar), 200 nmol/L forward primer, 200 nmol/L reverse primer, and 2 ng of cDNA. All samples were quantified in triplicates with the following conditions: 95°C for 10 minutes, followed by 40 cycles of 95°C for 10 seconds, and 60°C for 60 seconds. Firstly, PCR products of lncRNAs and glyceraldehyde-3-phosphate dehydrogenase (GAPDH) were diluted by 10 times gradient. After PCR, the standard curve was then drawn accordingly. Subsequently, according to the standard curve, the concentration of lncRNAs and GAPDH in each sample was generated. Finally, the relative lncRNA expression was normalized to GAPDH, and the fold change between the two groups was then calculated. The primer sequences for lncRNAs are presented in Table S2.
2.7 Data analysis
Data were analyzed with SPSS 17.0 (SPSS Inc, Chicago) and GraphPad Prism 5 (GraphPad Software Inc, San Diego). Continuous variables were expressed as mean ± standard deviation. Categorical data were presented as counts and percentages. Student's t test or χ2 test was used for comparisons between groups. A value of P < .05 was considered statistically significant.
3 RESULTS
3.1 Overview of differentially expressed lncRNAs and mRNAs
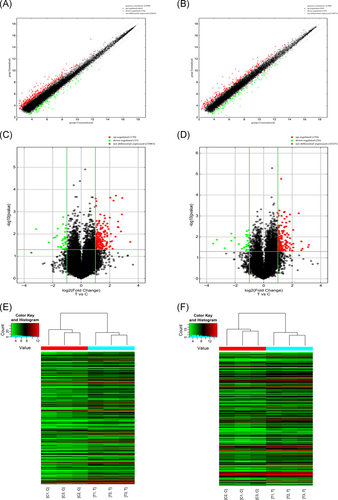
To investigate the differentially expressed mRNA and lncRNA, three liver tissues from patients with chronic HBV infection and three age- and sex-matched normal liver tissues were used for microarray analyses. The scatter plots were created to assess lncRNA and mRNA expression variations between samples of two groups. As shown in Figure 1A,B, Pearson's correlation coefficient for the samples of two groups showed a high degree of correlation. Compared with controls, a total of 203 lncRNAs (170 were upregulated and 33 were downregulated) and 180 mRNAs (154 were upregulation and 26 were downregulation) were differentially expressed in chronic HBV infection (fold change [FC] ≥ 2; P < .05) (Figure 1C,D). The top 10 upregulated and 10 downregulated lncRNAs and mRNAs have been listed in Tables 1 and 2, respectively. The most significantly dysregulated lncRNAs were ENST00000553896 (DHRS2) (FC: up; 10.8856479) and ENST00000555383 (AL355102.1) (FC: down; 8.8937791), while the most markedly dysregulated mRNAs were ENST00000372930 (TMEM35A) (FC: up; 9.0263073) and ENST00000334287 (SLC51B) (FC: down; 11.6170243). Hierarchical clustering analysis was also performed to analyze the distinguishable lncRNA and mRNA expression pattern between these two groups and displayed as a heat map (Figure 1E,F).
| Probe name | Seqname | Gene symbol | Chromosome | Start | End | P values | Fold change | Regulation | Relation |
|---|---|---|---|---|---|---|---|---|---|
| ASHG19LNC1A110657780V5 | ENST00000553896 | DHRS2 | chr14 | 24099324 | 24111647 | .022708533 | 10.886 | Up | Exon sense |
| ASHG19LNC1A106830235V5 | ENST00000560864 | AC022898.1 | chr15 | 61056939 | 61057824 | .000237543 | 7.3905 | Up | Intronic antisense |
| ASHGV40037340V5 | T262735 | G060477 | chr4 | 27187414 | 27190488 | .001309845 | 7.245 | Up | Intergenic |
| ASHGV40004180V5 | ENST00000512675 | AC139491.1 | chr5 | 175476681 | 175489024 | .007679361 | 6.942 | Up | Natural antisense |
| ASHGV40057253V5 | ENST00000417805 | AL160408.1 | chr1 | 234782035 | 234796670 | .005005722 | 6.1324 | Up | Intergenic |
| ASHG19LNC1A100106365V5 | ENST00000443030 | AC092168.1 | chr2 | 101338683 | 101339344 | .002731133 | 6.0248 | Up | Intergenic |
| ASHGV40034602V5 | ENST00000484892 | LINC00971 | chr3 | 84687557 | 84918726 | .004820202 | 5.9495 | Up | Intergenic |
| ASHGV40032672V5 | ENST00000425517 | LINC01707 | chr1 | 69521581 | 69650686 | .00018729 | 5.4275 | Up | Intergenic |
| ASHGV40034502V5 | ENST00000485805 | LINC00994 | chr3 | 64064037 | 64073039 | .013201746 | 5.3217 | Up | Intergenic |
| ASHG19LNC1A110868358V5 | ENST00000624327 | AC004158.1 | chr16 | 72463252 | 72567791 | .000311768 | 4.8343 | Up | Intergenic |
| ASHG19LNC1A100011776V5 | ENST00000555383 | AL355102.1 | chr14 | 96677197 | 96681155 | .006043097 | 8.8937791 | Down | Intronic sense |
| ASHGV40025827V5 | ENST00000598170 | AC006262.1 | chr19 | 46713499 | 46718094 | .023666021 | 4.8221762 | Down | Intergenic |
| ASHG19LNC1A100063611V5 | ENST00000624272 | C5orf66 | chr5 | 134368970 | 134680375 | .014622353 | 3.7770337 | Down | Natural antisense |
| ASHGV40049489V5 | ENST00000518143 | ZFHX4-AS1 | chr8 | 77523116 | 77595513 | .014022802 | 3.4827895 | Down | Natural antisense |
| ASHG19LNC1A107979790V5 | ENST00000457901 | AC018742.1 | chr2 | 21444057 | 21486958 | .011928929 | 3.2169485 | Down | Intergenic |
| ASHG19LNC1A108440760V5 | ENST00000642898 | LINC01488 | chr11 | 69300379 | 69309720 | .005731354 | 3.1080119 | Down | Intergenic |
| ASHG19LNC1ABL100000692V5 | compmerge.2878.pooled.chrX | LINC01186 | chrX | 46322668 | 46327652 | .037491139 | 3.0599907 | Down | Natural antisense |
| ASHGV40044473V5 | TCONS_00011631 | XLOC_005119 | chr6 | 230931 | 237179 | .040471364 | 2.6646732 | Down | Intergenic |
| ASHG19LNC1A107575874V5 | ENST00000449405 | LINC01939 | chr2 | 897183 | 900983 | .036997745 | 2.6634536 | Down | Intergenic |
| ASHG19LNC1A103227854V5 | ENST00000649049 | AL390856.1 | chr1 | 182096432 | 182097817 | .038133246 | 2.6416402 | Down | Intergenic |
- Abbreviations: HBV, hepatitis B virus; lncRNA, long noncoding RNA.
| Probe name | Seqname | Gene symbol | Description | Chromosome | Start | End | P values | Fold change | Regulation |
|---|---|---|---|---|---|---|---|---|---|
| ASHG19AP1B123494791V5 | ENST00000372930 | TMEM35A | Transmembrane protein 35A | chrX | 100333709 | 100351353 | 0.024003 | 9.026307 | Up |
| ASHG19AP1B103900526V5 | ENST00000344777 | DHRS2 | Dehydrogenase/reductase 2 | chr14 | 24105582 | 24114848 | 0.03054 | 8.694347 | Up |
| ASHG19AP1B105316397V5 | ENST00000645002 | SNRPN | Small nuclear ribonucleoprotein polypeptide N | chr15 | 25068872 | 25223724 | 0.036523 | 6.608694 | Up |
| ASHG19AP1B100172403V5 | ENST00000064571 | CBLN4 | Cerebellin 4 precursor | chr20 | 54572496 | 54580528 | 0.043373 | 6.272659 | Up |
| ASHG19AP1B100083243V5 | ENST00000303921 | GPR37 | G protein-coupled receptor 37 | chr7 | 124386051 | 124405681 | 0.016513 | 6.267627 | Up |
| ASHG19AP1B119068821V5 | ENST00000360948 | NTRK3 | Neurotrophic receptor tyrosine kinase 3 | chr15 | 88419988 | 88799962 | 0.000747 | 5.499896 | Up |
| ASHG19AP1B124285250V5 | ENST00000368845 | OAT | Ornithine aminotransferase | chr10 | 126085876 | 126107505 | 0.021101 | 4.249839 | Up |
| ASHG19AP1B113708091V5 | ENST00000306318 | GBX2 | Gastrulation brain homeobox 2 | chr2 | 237073879 | 237077012 | 0.032053 | 4.240156 | Up |
| ASHG19AP1B103262351V5 | ENST00000287139 | NODAL | Nodal growth differentiation factor | chr10 | 72192071 | 72201423 | 0.004643 | 4.230555 | Up |
| ASHG19AP1B100001215V5 | ENST00000508487 | CXCL2 | C-X-C motif chemokine ligand 2 | chr4 | 74962752 | 74965010 | 0.045589 | 4.085023 | Up |
| ASHG19AP1B100141581V5 | ENST00000334287 | SLC51B | Solute carrier family 51 beta subunit | chr15 | 65337708 | 65345734 | 0.0208708 | 11.6170243 | Down |
| ASHG19AP1B100062875V5 | ENST00000294312 | FGF19 | Fibroblast growth factor 19 | chr11 | 69513000 | 69519410 | 0.0137204 | 9.7112621 | Down |
| ASHG19AP1B100199917V5 | ENST00000326577 | TNFRSF12A | TNF receptor superfamily member 12A | chr16 | 3070313 | 3072384 | 0.0347484 | 6.6562845 | Down |
| ASHG19AP1B122125283V5 | ENST00000302913 | ACHE | Acetylcholinesterase (Cartwright blood group) | chr7 | 100487616 | 100493541 | 0.0152625 | 4.8140662 | Down |
| ASHG19AP1B124038577V5 | ENST00000402182 | APOBEC3B | Apolipoprotein B mRNA editing enzyme catalytic subunit 3B | chr22 | 39378404 | 39388809 | 0.0069478 | 4.794671 | Down |
| ASHG19AP1B100088306V5 | ENST00000239461 | PRRX1 | Paired related homeobox 1 | chr1 | 170633047 | 170708560 | 0.0109187 | 4.0384107 | Down |
| ASHG19AP1B100060467V5 | ENST00000252809 | GDF15 | Growth differentiation factor 15 | chr19 | 18496968 | 18499986 | 0.022066 | 3.3410947 | Down |
| ASHG19AP1B100085273V5 | ENST00000560104 | BLID | BH3-like motif containing, cell death inducer | chr11 | 121986062 | 121986923 | 0.036857 | 2.8834914 | Down |
| ASHG19AP1B101559793V5 | ENST00000261597 | NDC80 | NDC80, kinetochore complex component | chr18 | 2571510 | 2616634 | 0.0333044 | 2.5954002 | Down |
| ASHG19AP1B100127172V5 | ENST00000262713 | AJUBA | Ajuba LIM protein | chr14 | 23440383 | 23451851 | 0.031267 | 2.5511673 | Down |
- Abbreviations: HBV, hepatitis B virus; mRNA, messenger RNA.
3.2 Characteristics of differentially expressed lncRNAs
According to the location of lncRNA in coding genes, 203 differentially expressed lncRNAs were further classified. These lncRNAs were mainly from intergenic regions or natural antisense to protein-coding loci (Figure 2B). Furthermore, most of lncRNAs were distributed between 200 and 2000 bp in length (Figure 2A). Chromosome distribution revealed that these lncRNAs were located on different chromosomes (Figure 2C). Additionally, 13 of these lncRNAs might possess enhancer-like function, namely, T262735, ENST00000417805, ENST00000443030, ENST00000484892, ENST00000425517, ENST00000485805, ENST00000624327, ENST00000598170, ENST00000457901, ENST00000642898, TCONS_00011631, ENST00000449405, and ENST00000649049.

3.3 Bioinformatics analysis of differentially expressed lncRNAs
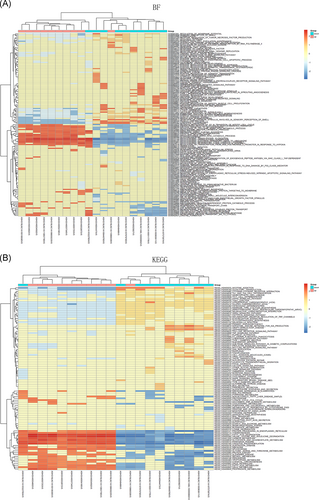
The potential functions of differentially expressed lncRNAs were predicted by GSEA base on Pearson's correlation coefficient between the selected lncRNA and all mRNAs. To better understand the enrichment results, the gene sets of each lncRNA were clustered and displayed using a heat map. As indicated in Figure 3, the top 10 upregulated and 10 downregulated lncRNAs might be mainly involved in biological processes including fatty acid oxidation, mitochondrial translational elongation and termination, mitochondrial electron transport (NADH to ubiquinone), mitochondrial respiratory chain complexes I and IV assembly, ATP biosynthesis process, branched-chain amino acid catabolism, regulation of cellular amino acid metabolism, gluconeogenesis, ribosomal RNA processing, protein folding, protein targeting to peroxisome and mitochondrion, proteasomal protein catabolic process, endoplasmic reticulum to Golgi vesicle transport and lymphocyte and monocyte chemotaxis. Moreover, these lncRNAs were primarily related to biotransformation pathways: fatty acid metabolism, nonalcoholic fatty liver disease, amino acid metabolism (such as valine, leucine, isoleucine, glycine, serine, threonine, and tryptophan), carbon metabolism, drug metabolism, protein processing in endoplasmic reticulum, protein export, oxidative phosphorylation, ribosome, and proteasome.
3.4 GO, KEGG, and GSEA analysis of differentially expressed mRNAs
According to the results of GO analysis, these differentially expressed mRNAs were primarily enriched in a biological process linked to the organic/carboxylic/amino acid metabolic process, and in cellular components, principally including mitochondrion, as well as in molecular function, such as transmembrane transporter activity and transferase activity (Figure 4A). The KEGG pathway analysis revealed that these mRNAs were significantly enriched in cytokine-cytokine receptor interaction, fatty acid degradation, fatty acid elongation, biosynthesis of unsaturated fatty acids, valine, leucine, and isoleucine degradation, carbon metabolism, and peroxisome proliferator-activated receptor signaling pathway (Figure 4B).
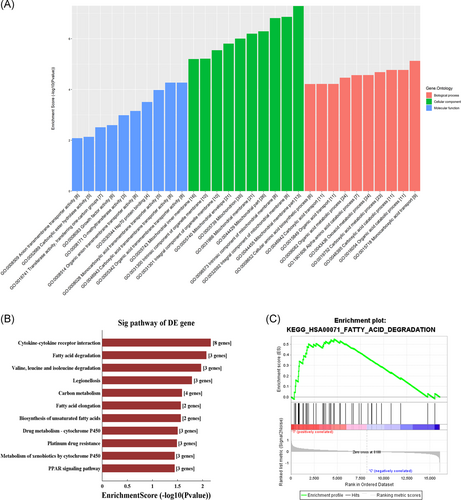
Additionally, GSEA was also performed (Tables S3 and S4). Consistently, these mRNAs were significantly correlated with valine, leucine, and isoleucine degradation (normalized enrichment score [NES] = 1.60; P < .001) and fatty acid degradation (NES = 1.52; P < .001) (Figure 4C).
3.5 Construction of lncRNA-mRNA coexpression network
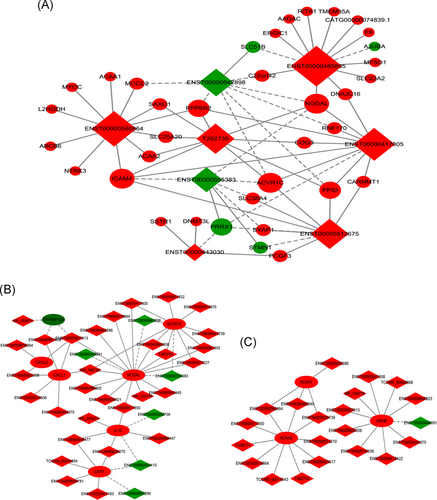
Based on the correlations of all differentially expressed lncRNAs and mRNAs, a coexpression network was constructed to identify hub regulatory factors associated with chronic HBV infection (Figure S1). According to the degree analysis, 8 of the top 10 upregulated and 10 downregulated lncRNAs with higher core degrees might be critical to the pathogenesis of chronic HBV infection. Therefore, a subgroup coexpression network of these eight lncRNAs and interacted mRNAs was further constructed and shown in Figure 5A. In addition, subgroup networks based on KEGG terms were also constructed. As presented, 36 lncRNAs interacted with 7 mRNAs in the KEGG term of cytokine-cytokine receptor interaction (Figure 5B) and 21 lncRNAs interacted with 3 mRNAs in the KEGG term of fatty acid degradation (Figure 5C).
3.6 Validation of differentially expressed lncRNAs
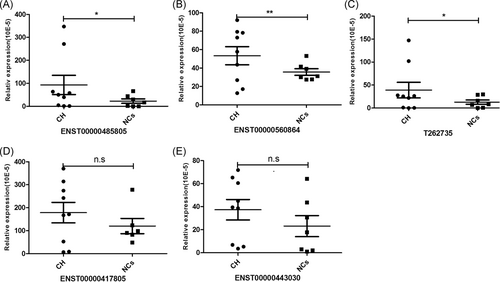
Five lncRNAs with more significant difference in expression and higher core degree were selected for quantitative real-time polymerase chain reaction (qRT-PCR) analysis to validate the microarray data. Consequently, the expression of ENST00000485805, T262735, and ENST00000560864 were upregulated (FC = 4.12, P = .02; FC = 3.01, P = .003; and FC = 1.50, P = .037, respectively) in chronic HBV infection compared with controls. ENST00000417805 and ENST00000443030 were also upregulated in chronic HBV infection; however, they did not reach statistical significance (FC = 1.41, P = .102 and FC = 1.61, P = .795, respectively) (Figure 6).
4 DISCUSSION
Recent studies have identified many lncRNAs associated with the regulation of immune responses during host-pathogen interactions,15-17 and an understanding of their functional roles in the pathogenesis of infectious, inflammatory, and autoimmune diseases is just emerging.6 However, to date, the expression profile and functions of lncRNAs in chronic HBV infection have not been well demonstrated yet. To the best of our knowledge, this is the first study to systematically compare the expression profiles of lncRNAs and mRNAs in liver tissues between patients with chronic HBV infection and normal controls with microarray analysis. Consequently, a total of 203 lncRNAs, including 170 upregulated and 33 downregulated lncRNAs, were identified to be differentially expressed in chronic HBV infection. Simultaneously, 180 differentially expressed mRNAs were also identified, including 154 upregulated and 26 downregulated mRNAs. Then, five candidate lncRNAs were further chosen for qRT-PCR confirmation. Consequently, ENST00000560864, T262735, and ENST00000485805 showed the same expression pattern as those analyzed by microarray. These results, to a certain extent, indicated a low FDR and the good reliability of the microarray data.
Previously, Yilmaz Susluer et al18 applied qRT-PCR to analyze the expression of 135 lncRNAs in plasma from 82 patients with chronic HBV infection (classified as chronic patients, inactive carriers, or resolved patients) and 81 healthy volunteers. Compared with healthy controls, they identified 15 upregulated and 7 downregulated lncRNAs from initial diagnosis to the 12th month of treatment/follow-up in patients with chronic HBV infection. Ruan et al19 showed that lncRNA HEIH and lncRNA HULC were upregulated in peripheral blood and liver tissues in hepatitis B patients, particularly those with hepatitis B-related HCC. However, the differential expression of these lncRNAs was not found in our study. The possible reasons for this discrepancy might be mainly due to differences in expression profile being analyzed, specimen type, detection methods, and characteristics of study populations. Despite, these results suggest that chronic HBV infection is also accompanied by changes in the expression of some lncRNAs, and these lncRNAs may be implicated in the pathogenesis and progression of chronic HBV infection.
To explore the functions of the identified genes and their relationships in the development of chronic HBV infection, a comprehensive bioinformatics analysis was performed. According to GO and KEGG analysis, differentially expressed mRNAs were mainly involved in cytokine-cytokine receptor interaction, organic/carboxylic/amino acid metabolic process and biotransformation pathways, particularly fatty acid metabolism. Moreover, similar results were also found by GSEA. Therefore, we inferred that these differentially expressed mRNAs might play vital roles in the underlying metabolic pathogenesis of chronic HBV infection.
In contrast to miRNAs, lncRNAs can play biological functions via a variety of complex mechanisms.7 Until now, there is no uniform approach to predict the potential functions of lncRNAs. However, many research studies indicated that lncRNAs might mediate the expression of neighboring and distantly located genes via cis/trans regulatory effects, respectively, and the genomic context could, therefore, provide important information about the potential functions of lncRNAs.7, 20 Therefore, most researchers always indirectly predict the functions of lncRNAs by performing GO and pathway analysis of their neighboring and distantly target genes.21, 22 However, to investigate the integrated functions of lncRNAs, we performed GSEA base on Pearson's correlation coefficient between the selected lncRNA and all mRNAs in this study. Largely consistent with the results of enrichment analysis of the differentially expressed mRNAs, the top 10 upregulated and 10 downregulated lncRNAs were also primarily involved in the biotransformation process, such as fatty acid metabolism, amino acid metabolism, carbon metabolism, and drug metabolism. Collectively, all the above results suggested that these lncRNAs might participate in the progression of chronic HBV infection by interacting with the differentially expressed mRNAs in this study. Then, to further study this complicated regulatory relationship, we conducted coexpression network analysis. In the network, numerous connections between lncRNAs and mRNAs indicated the complexity of molecular mechanisms of CHB. Subsequently, eight hub lncRNAs with higher core degrees and fold change were identified accordingly. Besides, we also selected two important pathways and linked them to some differentially expressed lncRNAs through a coexpression network, which might provide new directions for future experimental research.
Based on bioinformatics analysis, two pathways might be probably associated with the progression of chronic HBV infection: cytokine-cytokine receptor interaction and fatty acid degradation. Cytokines have been shown to control HBV replication and mediate a noncytolytic clearance of the virus.23 In this study, some differentially expressed mRNAs were involved in cytokine-cytokine receptor interaction, such as ACVR1C, CNTF, CXCL1, CXCL2, GDF15, IL-10, NODAL, and TNFRSF12A. Das et al24 reported that in IL-10 was the primary factor in chronic HBV infection. As an anti-inflammatory Th2 cytokine, IL-10 could restrain the host's anti-HBV activity, leading to sustained replication and expression, and association with HBV serum titers and degree of liver inflammation, determining the development and progression of hepatitis B disease.24-26 Additionally, inhibition of IL-10 has been proven to recover specific CD8+ T-cell response and accelerate virus eradication in in vivo and in vitro studies.24, 27 As shown in Figure 5B, IL-10 was positively and negatively correlated with five lncRNAs and two lncRNAs, respectively, indicating that these lncRNAs might participate in the molecular mechanism of CHB through mediating the functions of IL-10. Thus, future studies are warranted to elucidate the interactions between these lncRNAs and IL-10 in the development of chronic HBV infection.
Liver is a vital metabolic organ for the synthesis and circulation of lipids (including fatty acids), oxidation of fatty acids, and production of ketone bodies.28 Recently, increasing research studies demonstrated that HBV, a “metabolovirus,” could interfere with hepatic metabolic processes, especially lipid metabolism.29-31 For instance, HBx could induce the activation of fatty acid oxidation and subsequently maintain NADPH and ATP levels in the absence of glucose, which was crucial for HCC cells to overcome glucose starvation.32 Meanwhile, the life cycle of HBV, in turn, is affected by fatty acid metabolism. Okamura et al33 revealed that fatty acid biosynthesis might be associated with the formation and egression of infectious HBV particles from cells. Huang et al34 found that fatty acid translocase and cluster of differentiation 36 could promote HBV replication by upregulating the levels of hepatic cytosolic calcium. However, the precise mechanisms involved in altered lipid metabolism by chronic HBV infection remain largely unknown. In this study, 21 lncRNAs interacted with three mRNAs which were associated with fatty acid degradation, suggesting an underlying role of lncRNAs in lipid metabolism in the development of CHB. Therefore, a clearer understanding of this newly emerging role of lncRNAs in the metabolic pathogenesis of chronic HBV infection may provide new insights into the prevention and treatment for HBV-induced disease, which is worth further exploration.
In addition, lncRNAs might be also implicated in the metabolic pathogenesis of chronic HBV infection through amino acid metabolism, like valine, leucine, and isoleucine degradation. However, to date, few studies about an association between HBV infection and amino acid profile changes have been reported.35 Therefore, this finding in the current study still needs further confirmation.
Finally, the following limitations should be noted. First, the pathogenesis of chronic HBV infection is complex and involves complicated interactions between virus and the host. Of which, intrahepatic innate and adaptive immune responses play crucial roles in the persistent virus replication and liver damage during chronic HBV infection.36, 37 Surprisingly, most differentially expressed genes in this study did not significantly associate with some important pathways of immune responses. One possible explanation for this might be the source of normal liver tissues. As liver tissues from healthy people were unavailable, normal liver tissues from HCC patients were selected as controls instead of identifying differentially expressed genes, which, to a certain extent, might bias our results. Second, due to the limited sources of liver tissue, the sample size was relatively small and the representativeness of these samples is still limited. Hence, a larger and more diverse cohort is needed to further validate our findings. Finally, the functions of lncRNAs and associated pathways in the development of chronic HBV infection were predicted mainly based on bioinformatics analysis, which still require further experimental validation in vivo or in vitro.
In summary, this study identified the differential expression patterns of lncRNAs and mRNAs in liver tissues from patients with chronic HBV infection. Bioinformatics analysis revealed that these lncRNAs might be involved in cytokine-cytokine receptor interaction and multiple biotransformation processes, especially fatty acid degradation. These findings will provide new insights into the pathogenesis and progression of chronic HBV infection, and the roles of these lncRNAs in chronic HBV infection should be further explored.
ACKNOWLEDGMENTS
This study is funded by the Foundation of Science and Technology Department (No. WX18IIAN037) and Health Commission of Wuxi (No. MS201925).
CONFLICT OF INTERESTS
The authors declare that there are no conflict of interests.
AUTHOR CONTRIBUTIONS
Conceptualization: QH, ZW, ZL, HQ; experiments and data curation: QH, ZW, QW, WX; formal analysis: QH, ZW, HC, HQ; software: HC; resources: ZL; writing and original draft: QH, ZW; writing, review, and editing: QW, WX, HC, ZL, HQ.


