Magnetic Resonance Assessment of Left Ventricular Ejection Fraction at Any Time Post-Infarction for Prediction of Subsequent Events in a Large Multicenter STEMI Registry
Jose Gavara and Victor Marcos-Garces contributed equally to this work.
Abstract
Background
Magnetic resonance imaging (MRI) is the most accurate imaging technique for left ventricular ejection fraction (LVEF) quantification, but as yet the prognostic value of LVEF assessment at any time after ST-segment elevation myocardial infarction (STEMI) for subsequent major adverse cardiac event (MACE) prediction is uncertain.
Purpose
To explore the prognostic impact of MRI-derived LVEF at any time post-STEMI to predict subsequent MACE (cardiovascular death or re-admission for acute heart failure).
Study Type
Prospective.
Population
One thousand thirteen STEMI patients were included in a multicenter registry.
Field Strength/Sequence
1.5-T. Balanced steady-state free precession (cine imaging) and segmented inversion recovery steady-state free precession (late gadolinium enhancement) sequences.
Assessment
Post-infarction MRI-derived LVEF (reduced [r]: <40%; mid-range [mr]: 40%–49%; preserved [p]: ≥50%) was sequentially quantified at 1 week and after >3 months of follow-up.
Statistical Tests
Multi-state Markov model to determine the prognostic value of each LVEF state (r-, mr- or p-) at any time point assessed to predict subsequent MACE. A P-value <0.05 was considered to be statistically significant.
Results
During a 6.2-year median follow-up, 105 MACE (10%) were registered. Transitions toward improved LVEF predominated and only r-LVEF (at any time assessed) was significantly related to a higher incidence of subsequent MACE. The observed transitions from r-LVEF, mr-LVEF, and p-LVEF states to MACE were: 15.3%, 6%, and 6.7%, respectively. Regarding the adjusted transition intensity ratios, patients in r-LVEF state were 4.52-fold more likely than those in mr-LVEF state and 5.01-fold more likely than those in p-LVEF state to move to MACE state. Nevertheless, no significant differences were found in transitions from mr-LVEF and p-LVEF states to MACE state (P-value = 0.6).
Data Conclusion
LVEF is an important MRI index for simple and dynamic post-STEMI risk stratification. Detection of r-LVEF by MRI at any time during follow-up identifies a subset of patients at high risk of subsequent events.
Level of Evidence
2
Technical Efficacy Stage
2
Although current management strategies have substantially improved outcomes, the mortality rates of hospitalized patients with ST-segment elevation myocardial infarction (STEMI) vary between 4% and 12% in European national registries.1 Moreover, risk of death or re-admission for heart failure during the following months ranges between 5% and 20%.2 Accurate and simple risk stratification of STEMI patients at any time, not only in the hospital but also in subsequent months and years, is therefore imperative.
Magnetic resonance imaging (MRI) has become the most reliable and reproducible method for comprehensive non-invasive evaluation of the structural consequences of STEMI.3 Left ventricular ejection fraction (LVEF) has traditionally been used as the cornerstone for risk stratification1, 4 and MRI is the reference standard for an accurate quantification and detection of dynamic changes.5, 6 In recent years, detection of late gadolinium contrast-enhanced MRI-derived infarct size (IS) and microvascular obstruction (MVO) soon after STEMI has demonstrated additional prognostic value.7 However, compared to acute phase, the additional value of MVO and IS to stratify risk in chronic phase is slight.
The prognostic significance of MRI-derived LVEF soon after STEMI has been widely validated.3, 5, 7 Dramatic changes in LVEF may occur during the weeks and months following STEMI,8 potentially altering the risk profile of patients beyond the subacute phase and thus also affecting decision-making. Despite this, the impact of MRI-derived LVEF (at any time assessed) on the risk of subsequent events in STEMI patients remains largely undetermined.9 Moreover, the value of LVEF categorization as derived from the latest guidelines10 into preserved (p-LVEF, ≥50%), mid-range (mr-LVEF, 40%–49%), or reduced (r-LVEF, <40%) for this purpose is unknown.
Hence, the aim of this study was to draw from a large registry of STEMI patients sequentially evaluated with MRI at 1 week and >3 months after infarction in order to explore the potential prognostic implications of LVEF at any time assessed and its effect on the incidence of subsequent major adverse cardiac events (MACE).
Materials and Methods
Study Group
The study protocols were approved by the local Human Research Ethics Committees and complied with the 1975 Declaration of Helsinki guidelines. Patient written informed consent was obtained. This multicenter registry, which included 1036 STEMI patients, was collated from the databases of three prospective ongoing registries kept in three Spanish University Hospitals.
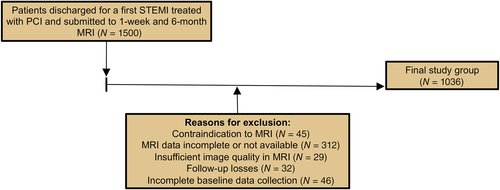
Patients discharged between 2007 and 2017 after a first STEMI treated with percutaneous coronary intervention and submitted to early (1 week) MRI were prospectively recruited. Only patients undergoing a second MRI >3 months after STEMI and followed-up for a minimum of 1 year were included. A flowchart of patient enrollment, together with exclusion criteria, is given in Fig. 1. In 138 patients, at least one additional MRI study was performed for clinical indication beyond the first follow-up study (Fig. S1 in the Supplemental Material).
Patient characteristics including the Global Registry of Acute Coronary Events and Thrombolysis in Myocardial Infarction (TIMI) scores, Killip class at admission, peak creatine kinase MB mass, and TIMI flow grade in the culprit artery (before and after reperfusion) were recorded. Patients were managed both in-hospital and after discharge following specific STEMI guidelines.1
Magnetic Resonance Imaging
In STEMI patients, images were acquired by phased-array body surface coil during breath-holds and were triggered by retrospective electrocardiographic gating. Patients were examined with a 1.5-T System (Sonata Magnetom, Siemens, Erlangen, Germany) at pre-discharge or shortly after discharge (7 ± 2 days post-STEMI) and re-evaluated >3 months thereafter (182 ± 39 days after STEMI). Local cardiologists specialized in cardiac MRI with a high level of experience (MPLL: 20 years, JVM: 15 years, JFRP and JTOP: 10 years) carried out studies, quantified parameters using customized software (QMASS MR, 6.1.5, Medis, Leiden, The Netherlands), and prospectively included data in the respective databases.
Cine images were acquired in two-, three-, and four-chamber views and in short-axis views using a balanced steady-state free precession sequence (repetition time/echo time: 2.8/1.2 msec; flip angle: 58°; matrix: 256 × 300; field of view: 320 mm × 270 mm; slice thickness: 7 mm). Two hundred and fifty-six lines of k-space were acquired per cardiac phase in each cardiac cycle and 30 cine phases were reconstructed.
LVEF (%), LV end-diastolic volume index (mL/m2), LV end-systolic volume index (mL/m2), and LV mass index (g/m2) were calculated by the same operators by manual planimetry of endocardial and epicardial borders in short-axis view cine images.
Breath-hold late gadolinium enhancement imaging was performed 10 minutes after administering a gadolinium-based contrast (dimeglumine gadopentetate or dimeglumine gadobenate at 0.1 mmol/kg or gadoteric acid at 0.15 mmol/kg) in the same locations as in the cine images using a segmented inversion recovery steady-state free precession sequence (repetition time/echo time: 750/1.26 msec; flip angle: 45°; matrix: 256 × 184; field of view: 340 mm × 235 mm; slice thickness: 7 mm). Inversion time was adjusted to nullify normal myocardium.
Areas showing late gadolinium enhancement were visually quantified by manual planimetry by the same operators. IS (% of LV mass) was assessed as the percentage of LV mass showing late gadolinium enhancement. MVO was defined as the number of segments displaying a lack of contrast uptake in the tissue core showing late gadolinium enhancement; the 17-segment model was applied.11
LVEF Categorization
Following the latest guidelines on heart failure,10 we categorized LVEF as p-LVEF (≥50%), mr-LVEF (40%–49%), or r-LVEF (<40%).
Furthermore, based on the high MACE rate detected in patients with LVEF < 40% (vs. those with ≥40%) both at 1 week and after follow-up MRI in this registry and previous analysis by our group,12 additional analyses were performed using this cut-off value to study the prognostic impact of LVEF dynamics (i.e., LVEF change from initial to follow up). Consequently, patients were classified into Group 1—sustained LVEF < 40% (“r- to r-LVEF”), Group 2—worsened LVEF (“p- or mr- to r-LVEF”), Group 3—improved LVEF (“r- to mr- or p-LVEF”), and Group 4—sustained LVEF ≥ 40% (“mr- or p- to mr- or p-LVEF”).
Endpoint and Follow-Up
MACE was defined as a combined clinical endpoint including cardiovascular death or re-admission for acute heart failure, whichever occurred first, after MRI.
Events were prospectively adjudicated by clinical cardiologists of the participating institutions via periodic revisions of the respective electronic regional health system registries.
Statistical Analysis
Normal data distribution was tested using the Kolmogorov–Smirnov test. Continuous normally distributed data were expressed as mean ± SD and compared using the unpaired Student's t test. Nonparametric data were expressed as the median (interquartile range) and compared using the Mann–Whitney U test. Group percentages were compared using the Chi-square test or Fisher's exact test where appropriate.
In univariate analysis, Kaplan–Meier curves and Cox proportional hazard regression models were used to assess 1) the association between LVEF categories at follow-up MRI and time to first MACE after follow-up MRI, and 2) the association of LVEF dynamics (according to the four above groups) with time to first MACE after follow-up MRI.
Correlation between baseline characteristics, 1-week, and follow-up MRI indices and time to first MACE after follow-up MRI was assessed by means of multivariable, hierarchical Cox proportional hazard regression models. For this purpose, patients with a first MACE before follow-up MRI were censored. From a clinical point of view and to avoid model overfitting, we carried out the following steps: 1) first, a multivariable model (Model 1: baseline characteristics) was tested, including the baseline variables showing an association (P-value <0.1) with MACE occurrence; 2) a second multivariable model (Model 2a: baseline characteristics plus 1-week MRI indices), including variables from Model 1 independently related to MACE occurrence plus 1-week MRI indices; 3) a third multivariable model (Model 2b: baseline characteristics plus 1-week and follow-up MRI indices), including variables from Model 2a independently related to MACE occurrence plus follow-up MRI indices; and 4) the final multivariable model (Model 3: baseline characteristics plus 1-week and follow-up MRI indices plus LVEF dynamics), including variables from Model 2b independently related to MACE occurrence plus LVEF dynamics. Hazard ratios with the corresponding 95% confidence intervals were computed. The collinearity of variables tested in the final multivariate model was assessed using the variance inflation factor (inflated if >5) and its tolerance statistic (inflated if <0.20).
To evaluate the additional prognostic contribution of LVEF dynamics beyond baseline characteristics and 1-week MRI indices, we computed changes in risk classification using the continuous net reclassification improvement (NRI) index and the integrated discrimination improvement (IDI) index.13 The “incrisk” package in Stata was used for calculations. The logit model was applied to obtain logistic regressions and the resulting linear predictors were used for calculations. The two tested models were considered different if the 95% confidence intervals of NRI and IDI did not overlap the zero value. These analyses were used to evaluate the additional prognostic contribution of LVEF dynamics beyond baseline characteristics and 1-week MRI indices.
The continuous-time multi-state Markov model was used to explore patient transition rates between r-, mr-, and p-LVEF states along the entire observation process, and to determine the prognostic value of each LVEF state at any time point assessed to predict subsequent MACE. At each time point, patients were located in one of the four following states: State 1 = LVEF < 40% (r-LVEF); State 2 = LVEF 40%–49% (mr-LVEF); State 3 = LVEF ≥ 50% (p-LVEF); or State 4, if MACE occurred. Estimates from the multi-state Markov model are presented as observed transitions, adjusted transition probabilities, or transition intensity ratios, the latter two indexes with their respective 95% confidence intervals. For this specific purpose, patients with a first MACE before the follow-up MRI were also included.
Statistical significance was considered for 2-tailed P-values <0.05. The SPSS statistical package version 21.0, STATA version 14.1, and R software were used throughout. Further details on statistical analysis can be consulted in the Supplemental Material.
Results
The final registry was comprised of 1013 STEMI patients (mean age 59 ± 12 years, 84% male). Patient characteristics are shown in Table 1. During a median follow-up 6.2 years (range of 3.3–7.7 years), 105 total MACE (after 1-week MRI, 10%, 36 cardiovascular deaths, and 69 admissions for heart failure) and 82 MACE (after follow-up MRI, 8%, 35 cardiovascular deaths, and 47 admissions for heart failure) were registered. Twenty-three patients presented the first MACE before follow-up MRI.
| Characteristics | All Patients (N = 1013) | MACE (N = 82) | No MACE (N = 931) | P-Value |
|---|---|---|---|---|
| Age (years) | 59 ± 12 | 65 ± 12 | 58 ± 11 | <0.001 |
| Male sex (%) | 853 (84) | 68 (83) | 785 (84) | 0.72 |
| Diabetes mellitus (%) | 187 (18) | 19 (23) | 168 (18) | 0.27 |
| Hypertension (%) | 457 (45) | 45 (55) | 412 (44) | 0.07 |
| Hypercholesterolemia (%) | 439 (43) | 33 (40) | 406 (44) | 0.51 |
| Smoker (%) | 652 (64) | 44 (54) | 608 (65) | 0.03 |
| Heart rate on admission (beats per min) | 76 ± 18 | 84 ± 22 | 75 ± 18 | 0.001 |
| Systolic pressure (mmHg) | 130 ± 30 | 135 ± 33 | 129 ± 29 | 0.12 |
| Killip class (%) | 0.02 | |||
| 1 | 865 (85) | 63 (77) | 802 (86) | |
| >1 | 148 (15) | 19 (23) | 129 (14) | |
| Time to reperfusion (minutes) | 190 [136–300] | 210 [148–304] | 190 [135–300] | 0.35 |
| Peak creatine kinase MB mass (ng/mL) | 188 [88–301] | 266 [101–424] | 183 [87–292] | 0.01 |
| Anterior infarction (%) | 515 (51) | 52 (63) | 463 (50) | 0.02 |
| TIMI flow grade before PCI (%) | 0.05 | |||
| 0 | 642 (63) | 50 (61) | 592 (64) | |
| 1 | 70 (7) | 2 (3) | 68 (7) | |
| 2 | 101 (10) | 6 (7) | 95 (10) | |
| 3 | 200 (20) | 24 (29) | 176 (19) | |
| TIMI flow grade after PCI (%) | 0.48 | |||
| 0 | 16 (2) | 2 (2) | 14 (2) | |
| 1 | 8 (1) | 0 (0) | 8 (1) | |
| 2 | 76 (7) | 8 (10) | 68 (7) | |
| 3 | 913 (90) | 72 (88) | 841 (90) | |
| GRACE risk score | 127 ± 31 | 147 ± 35 | 126 ± 30 | <0.001 |
| TIMI risk score | 2 [1–4] | 4 [3–5] | 2 [1–4] | <0.001 |
- GRACE = Global Registry of Acute Coronary Events; MACE = major adverse cardiac events; PCI = percutaneous coronary intervention; TIMI = Thrombolysis in Myocardial Infarction.
LVEF in Chronic Phase and Prediction of Subsequent MACE
In univariate analyses, patients who experienced MACE differed significantly in several clinical characteristics (Table 1). Regarding MRI indices both at 1 week and at follow-up, occurrence of MACE was associated with more depressed LVEF, larger IS, and more extensive MVO (Table 2).
| Characteristics | All Patients (N = 1013) | MACE (N = 82) | No MACE (N = 931) | P-Value |
|---|---|---|---|---|
| MRI indices at 1 week | ||||
| LVEF (%) | 50 ± 11 | 44 ± 13 | 50 ± 11 | <0.001 |
| LV end-diastolic volume index (mL/m2) | 81 ± 21 | 83 ± 27 | 80 ± 20 | 0.41 |
| LV end-systolic volume index (mL/m2) | 42 ± 18 | 48 ± 23 | 41 ± 17 | 0.008 |
| LV mass (g/m2) | 70 ± 17 | 79 ± 22 | 70 ± 17 | 0.001 |
| MVO (N of segments) | 0 [0–2] | 1 [0–3] | 0 [0–2] | 0.004 |
| IS (% of LV mass) | 19 [11–29] | 27 [15–39] | 18 [10–28] | <0.001 |
| MRI indices at follow-up | ||||
| LVEF (%) | 53 ± 12 | 46 ± 14 | 54 ± 11 | <0.001 |
| LV end-diastolic volume index (mL/m2) | 83 ± 24 | 89 ± 33 | 82 ± 23 | 0.06 |
| LV end-systolic volume index (mL/m2) | 40 ± 20 | 51 ± 29 | 39 ± 19 | 0.001 |
| LV mass (g/m2) | 64 ± 16 | 72 ± 20 | 63 ± 15 | <0.001 |
| MVO (N of segments) | 0 [0–0] | 0 [0–0] | 0 [0–0] | 0.53 |
| IS (% of LV mass) | 15 [8–24] | 25 [12–36] | 15 [8–22] | <0.001 |
- Normally distributed data are given as mean ± SD. Non-normally distributed data are given as median [inter-quartile range].
- IS = infarct size; LV = left ventricular; LVEF = left ventricular ejection fraction; MACE = major adverse cardiac events; MVO = microvascular obstruction.
From 1-week to follow-up MRI, IS significantly decreased (median [interquartile range]: 19 [11–29]% vs. 15 [8–24]% of LV mass) and MVO significantly reduced to almost zero (median [interquartile range]: 0 [0–2]% vs. 0 [0–0]% of LV mass).
LVEF significantly improved (50 ± 11% vs. 53 ± 12%) and crossover of patients to categories with more preserved LVEF took place. At 1-week MRI, 207 patients (20%) displayed r-LVEF, 328 (32%) mr-LVEF, and 501 (48%) p-LVEF. At follow-up MRI, 144 patients (14%) showed r-LVEF, 247 (24%) mr-LVEF, and 645 (62%) p-LVEF.
Incidence of MACE was significantly higher only in patients with r-LVEF at follow-up MRI (22%), compared with 7% in those with mr-LVEF and 6% in those with p-LVEF (Fig. 2a). The risk of MACE increased in parallel with LVEF dysfunction (Fig. 2b). A similar tendency was observed in the association of 1-week LVEF and total MACE rate since discharge (Fig. S2 in the Supplemental Material).
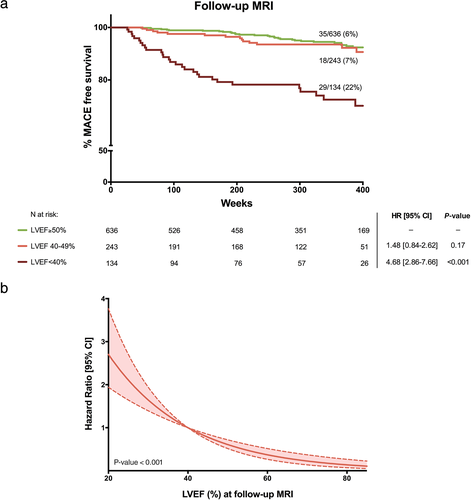
In a hierarchical multivariable model including first baseline characteristics (Model 1) and then 1-week and follow-up MRI data (Models 2a and 2b), LVEF at follow-up MRI was independently associated with the occurrence of subsequent MACE (Table 3).
| Characteristics | Hazard Ratio [95% CI] | P-Value |
|---|---|---|
| Model 1: Baseline characteristics | ||
| Age (years) | 1.05 [1.03–1.08] | <0.001 |
| Hypertension (%) | 1.23 [0.74–2.03] | 0.39 |
| Smoker (%) | 1.01 [0.61–1.67] | 0.87 |
| Heart rate on admission (beats per min) | 1.02 [1.009–1.03] | <0.001 |
| Killip class (%) | 1.40 [0.82–2.37] | 0.16 |
| Peak creatine kinase MB mass (ng/mL) | 1 [0.99–1.001] | 0.12 |
| Anterior infarction (%) | 1.40 [0.83–2.30] | 0.13 |
| TIMI flow grade before PCI (%) | 1.01 [0.84–1.22] | 0.94 |
| GRACE risk score | 0.99 [0.98–1.01] | 0.91 |
| TIMI risk score | 1.15 [1.01–1.30] | 0.03 |
| Model 2a: Baseline characteristics ± 1-week MRI | ||
| Age (years) | 1.06 [1.03–1.09] | <0.001 |
| Heart rate on admission (beats per min) | 1.02 [1.005–1.03] | 0.005 |
| TIMI risk score | 1.11 [0.98–1.26] | 0.09 |
| LVEF at 1-week MRI (%) | 0.98 [0.95–0.99] | 0.04 |
| MVO at 1-week MRI (N of segments) | 1.05 [0.92–1.19] | 0.56 |
| IS at 1-week MRI (% of LV mass) | 1.02 [1.006–1.04] | 0.008 |
| Model 2b: Baseline characteristics ± 1-week and follow-up MRI | ||
| Age (years) | 1.07 [1.05–1.09] | <0.001 |
| Heart rate on admission (beats per min) | 1.02 [1.009–1.03] | <0.001 |
| LVEF at 1-week MRI (%) | 1 [0.97–1.03] | 0.92 |
| IS at 1-week MRI (% of LV mass) | 1.009 [0.98–1.04] | 0.50 |
| LVEF at follow-up MRI (%) | 0.97 [0.95–0.99] | 0.003 |
| MVO at follow-up MRI (N of segments) | 1.06 [0.83–1.34] | 0.59 |
| IS at follow-up MRI (% of LV mass) | 1.03 [1.004–1.05] | 0.02 |
| Model 3: Baseline characteristics ± 1-week and follow-up MRI ± LVEF dynamics | ||
| Age (years) | 1.07 [1.05–1.09] | <0.001 |
| Heart rate on admission (beats per min) | 1.02 [1.007–1.03] | 0.001 |
| LVEF at follow-up MRI (%) | 0.99 [0.96–1.02] | 0.46 |
| IS at follow-up MRI (% of LV mass) | 1.02 [1.004–1.04] | 0.02 |
| LVEF dynamics | 0.004 | |
| Group 1 | – | – |
| Group 2 | 0.76 [0.32–1.85] | 0.55 |
| Group 3 | 0.62 [0.29–1.32] | 0.22 |
| Group 4 | 0.31 [0.16–0.60] | 0.001 |
- Model 1 refers to the 10 baseline variables showing an association (P-value <0.1 in Table 1) with occurrence of MACE. Model 2a includes variables of Model 1 independently related to MACE occurrence plus 1-week MRI indices (LVEF, MVO, and IS). Model 2b includes variables of Model 2a independently associated with MACE occurrence plus follow-up MRI indices (LVEF, MVO, and IS). Model 3 includes variables of Model 2b independently related to MACE occurrence plus LVEF dynamics. For LVEF dynamics from 1-week to follow-up MRI, Group 1 (“reduced to reduced”) was considered as the reference value. Group 2 (“non-reduced to reduced”), Group 3 (“reduced to non-reduced”), and Group 4 (“non-reduced to non-reduced”) were compared with Group 1 regarding the relative risk of MACE. Variables with excessive collinearity (tolerance statistic <0.20 and/or variance inflation factor >5) were excluded from multivariable models.
- CI = confidence interval; GRACE = Global Registry of Acute Coronary Events; IS = infarct size; LVEF = left ventricular ejection fraction; MACE = major adverse cardiac events; MVO = microvascular obstruction; PCI = percutaneous coronary intervention; TIMI = Thrombolysis in Myocardial Infarction.
LVEF Dynamics from 1-Week to Follow-Up MRI and Prediction of Subsequent MACE
Based on the dynamics of LVEF, the MACE rate was very low in patients with sustained mr- or p-LVEF (41/783, 5%; Group 4), intermediate in those with improved LVEF from r-LVEF at 1 week to mr- or p-LVEF (12/96, 13%; Group 3) and high in patients with sustained r-LVEF (22/100, 22%; Group 1) or worsened LVEF from mr- or p-LVEF at 1 week to r-LVEF (7/34, 21%; Group 2), P-value ≤0.001 for the trend of MACE rate between groups (Fig. 3).
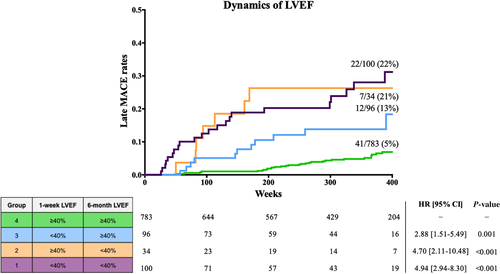
LVEF dynamics were tested in the final multivariable model (Table 3, Model 3). In this setting, independent predictors of MACE were age, heart rate on admission, IS at follow-up MRI, and LVEF dynamics. Compared to Groups 1–3 (with any measurement <40%), Group 4 (with sustained LVEF ≥ 40%) correlated independently with a significantly lower risk of subsequent MACE during follow-up.
Adding LVEF dynamics into the final model (Model 3) significantly improved discrimination accuracy (C-statistic: 0.80 vs. 0.75) and risk reclassification (continuous NRI: 0.282 [0.011–0.503] and IDI: 0.019 [0–0.049]) compared to the 1-week multivariable model (Model 2a, Table 3).
Multi-State Markov Analysis
Figure 4 illustrates that transitions between the different LVEF states (1 = r-LVEF, 2 = mr-LVEF, 3 = p-LVEF) were most frequently toward states with higher LVEF. Moving from r- to mr-LVEF (LVEF < 40% to LVEF 40%–49%) or mr- to p-LVEF (40%–49% to LVEF ≥ 50%) was more than twice as likely than the opposite transitions. There were 2.1-fold more transitions from State 1 to State 2 than from State 2 to State 1, and 4.5-fold more transitions from State 2 to State 3 than from State 3 to State 2 (Table S1 in the Supplemental Material).
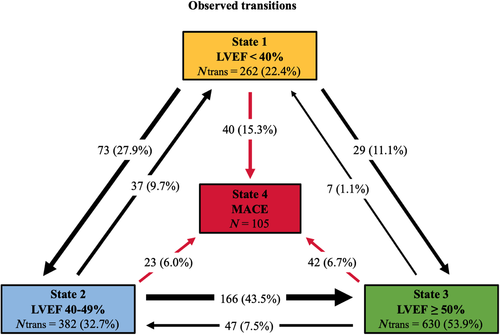
The observed transitions from State 1 to MACE (State 4) were almost double those from State 2 and 3: 15.3% vs. 6% and 6.7%, respectively (Fig. 4).
The distribution of transitions to MACE (State 4) is depicted in Fig. 5a,b in continuous time. Overall, MRI-LVEF assessment at any time revealed a higher risk of MACE in patients with LVEF < 40% (State 1) than in patients with LVEF ≥ 40% (States 2 and 3) (Fig. 5).
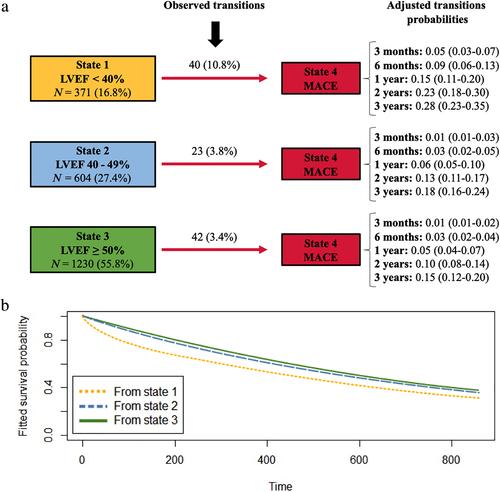
Table 4 compares the transition intensity ratios from LVEF states to MACE (State 4). Patients in State 1 were 4.52-fold more likely to reach State 4 than those in State 3. Similarly, patients in State 1 were 5.01-fold more likely to move to State 4 than those in State 2. Nevertheless, no significant differences were found in transitions to State 4 between patients in State 2 (mr-LVEF) and State 3 (p-LVEF) where the transition intensity ratio was almost 1 (P-value = 0.6).
| Transitions to MACE | ||||
|---|---|---|---|---|
| Ratios | ITR | Lower [95% CI] | Upper [95% CI] | P-Value |
| 1–4 to 3–4 | 4.52 | 2.42 | 8.44 | <0.001 |
| 2–4 to 3–4 | 0.90 | 0.27 | 3.07 | 0.6 |
| 1–4 to 2–4 | 5.01 | 1.56 | 16.01 | 0.04 |
- CI = confidence interval; ITR = intensity transition ratio; MACE = major adverse cardiac event.
Discussion
We present a large STEMI registry evaluating the prognostic value of assessment of MRI-derived LVEF at any time post-infarction. The main finding of our study is that r-LVEF (<40%) detected at any assessment time point is associated with a significantly higher risk of subsequent events. Sequential assessment reveals that transitions toward states with higher LVEF clearly predominate and that MRI-derived LVEF dynamics can exert a major impact on patient outcomes.
Early risk assessment is recommended to identify patients at higher risk of MACE who could benefit most from optimal medical treatment and close follow-up.1 LVEF as derived from echocardiography is the cornerstone for non-invasive risk prediction in this setting. Detection of depressed LVEF soon after STEMI is strongly associated with the occurrence of subsequent events.1, 4, 14, 15 Pre-discharge MRI can provide a more accurate measurement of LVEF5, 6 and additional information on relevant prognostic parameters such as IS and MVO.3, 7 We recently showed that significant crossovers can occur between LVEF categories when pre-discharge values from echocardiography and MRI are compared.12
Risk reconsideration in chronic phase has shown an impact on decision-making. Patients with less closely monitored LVEF are less likely to be treated with specific evidence-based medications and implantable cardioverter-defibrillators.16, 17 Still, LVEF reassessment rates are relatively low even in patients with initial r-LVEF after STEMI.18 Most of these studies16-18 have used echocardiography as the risk stratification and decision-making technique, whereas MRI has been rarely used for this purpose.
The prognostic implications of categorizing MRI-derived LVEF at any time of assessment after STEMI following the latest recommendations (p-LVEF, ≥50%; mr-LVEF, 40%–49%; r-LVEF, <40%)10 had not been addressed so far. In this study, transitions toward states with higher LVEF were more than twice as probable than vice versa. Observed continuously over time using sequential MRI, these switches confirm a strong tendency toward spontaneous systolic recovery in reperfused STEMI patients.4, 9, 18
Thus sequential MRI allowed us to pinpoint LVEF dynamics between LVEF states and their prognostic consequences. Most patients (around 85%) displayed non-reduced LVEF in chronic phase and a low-intermediate risk of subsequent events. Patients with chronic-phase r-LVEF represented the small subset (less than 15% of the entire group) at highest risk. This confirms the salutary effects of systolic recovery, the deleterious consequences of LVEF deterioration, and the need for close follow-up of STEMI patients with r-LVEF.16-18
The multi-state Markov approach allowed us to overcome the limitations of static LVEF measurement and analyze the transition intensity of LVEF states toward MACE occurrence at any assessment time point. Patients with r-LVEF were significantly more likely to reach MACE than those with mr- and p-LVEF. Nevertheless, transition intensity to MACE was almost identical from mr- and p-LVEF. This analysis suggests that categorization of LVEF into ≥40% (p- or mr) and <40% (r-LVEF) would permit a straightforward risk stratification of subsequent events along the entire follow-up process of STEMI, not only at pre-discharge but also at any time of assessment in chronic phase.
Echocardiography is the indisputable first choice for non-invasive imaging and must be used in all STEMI patients.1 Nevertheless, MRI provides the most accurate measurement of LVEF and its dynamic changes.5, 6 A variety of factors such as availability, expertise, and cost should be considered before generalized use of sequential MRI in STEMI patients can be advocated. It is conceivable that patients at highest risk, namely those with depressed LVEF soon after STEMI, would benefit most from sequential MRI for timely and precise estimation of LVEF oscillations. However, this proposition needs further validation in specifically designed studies and falls beyond the scope of the present study.
Limitations
First, referral bias cannot be excluded due to the observational nature of this study. Second, a centralized assessment of MRI studies would have permitted more homogeneous quantification. Third, several clinical, biochemical, and imaging parameters which have shown prognostic value were not collected in our registry. Finally, information about pharmacological treatment and changes made during follow-up might have permitted greater insight into their impact on patient prognosis and clinical decision-making.
Conclusion
MRI-derived LVEF assessment at any time during follow-up distinguishes the small subset of patients at high risk of subsequent events (those with LVEF < 40%) from those who generally display a benign course (patients with LVEF ≥ 40%).
Acknowledgments
This work was supported by “Instituto de Salud Carlos III,” “Fondos Europeos de Desarrollo Regional FEDER” (grants PI15/00531, PI17/01836, PI20/00637, and CIBERCV16/11/00486), and “Marató TV3” (grant 20153030-31-32), a grant from the Catalonian Society of Cardiology 2015 and a grant from La Caixa Foundation (HR17-00527). David Moratal and Jose Gavara acknowledge financial support from the “Conselleria d'Educació, Investigació, Cultura i Esport, Generalitat Valenciana” (grants AEST/2019/037 and AEST/2020/029), “Agencia Valenciana de la Innovación, Generalitat Valenciana” (ref. INNCAD00/19/085 and INNCAD/2020/84), and “Centro para el Desarrollo Tecnológico Industrial” (Programa Eurostars-2, actuación Interempresas Internacional), Spanish “Ministerio de Ciencia, Innovación y Universidades” (ref. CIIP-20192020).


