Multi-Parametric Evaluation of Cerebral Hemodynamics in Neonatal Piglets Using Non-Contrast-Enhanced Magnetic Resonance Imaging Methods
The first two authors contributed equally to this work.
Abstract
Background
Disruption of brain oxygen delivery and consumption after hypoxic–ischemic injury contributes to neonatal mortality and neurological impairment. Measuring cerebral hemodynamic parameters, including cerebral blood flow (CBF), oxygen extraction fraction (OEF), and cerebral metabolic rate of oxygen (CMRO2), is clinically important.
Purpose
Phase-contrast (PC), velocity-selective arterial spin labeling (VSASL), and T2-relaxation-under-phase-contrast (TRUPC) are magnetic resonance imaging (MRI) techniques that have shown promising results in assessing cerebral hemodynamics in humans. We aimed to test their feasibility in quantifying CBF, OEF, and CMRO2 in piglets.
Study Type
Prospective.
Animal Model
Ten neonatal piglets subacutely recovered from global hypoxia-ischemia (N = 2), excitotoxic brain injury (N = 6), or sham procedure (N = 2).
Field Strength/Sequence
VSASL, TRUPC, and PC MRI acquired at 3.0 T.
Assessment
Regional CBF was measured by VSASL. Global CBF was quantified by both PC and VSASL. TRUPC assessed OEF at the superior sagittal sinus (SSS) and internal cerebral veins (ICVs). CMRO2 was calculated from global CBF and SSS-derived OEF. End-tidal carbon dioxide (EtCO2) levels of the piglets were also measured. Brain damage was assessed in tissue sections postmortem by counting damaged neurons.
Statistical Tests
Spearman correlations were performed to evaluate associations among CBF (by PC or VSASL), OEF, CMRO2, EtCO2, and the pathological neuron counts. Paired t-test was used to compare OEF at SSS with OEF at ICV.
Results
Global CBF was 32.1 ± 14.9 mL/100 g/minute and 30.9 ± 8.3 mL/100 g/minute for PC and VSASL, respectively, showing a significant correlation (r = 0.82, P < 0.05). OEF was 54.9 ± 8.8% at SSS and 46.1 ± 5.6% at ICV, showing a significant difference (P < 0.05). Global CMRO2 was 79.1 ± 26.2 μmol/100 g/minute and 77.2 ± 12.2 μmol/100 g/minute using PC and VSASL-derived CBF, respectively. EtCO2 correlated positively with PC-based CBF (r = 0.81, P < 0.05) but negatively with OEF at SSS (r = −0.84, P < 0.05). Relative CBF of subcortical brain regions and OEF at ICV did not significantly correlate, respectively, with the ratios of degenerating-to-total neurons (P = 0.30, P = 0.10).
Data Conclusion
Non-contrast MRI can quantify cerebral hemodynamic parameters in normal and brain-injured neonatal piglets.
Level of Evidence
1
Technical Efficacy Stage
2
Hypoxic–ischemic encephalopathy (HIE) is a leading cause of neonatal mortality and severe neurological impairment in childhood.1 The hypoxic–ischemic (HI) event leads to abnormally reduced cerebral blood flow (CBF), and the resulting energy failure can cause cellular death; even if CBF is restored, a multifaceted polymodal secondary energy failure often occurs aggravating brain damage.1 Therefore, measuring CBF, oxygen extraction fraction (OEF), and cerebral metabolic rate of oxygen (CMRO2), the three parameters that characterize cerebral oxidative metabolism, is clinically important. Abnormalities in these hemodynamic parameters have been reported in neonates with HIE compared to normal controls.2-4 However, clinical magnetic resonance imaging (MRI) protocols are not tailored to measure cerebral hemodynamic disturbances in neonates, and it is unclear whether or not HI damage to neurons, glia, or their subcellular compartments directly relates to these hemodynamic changes. This uncertainty is further complicated by the knowledge that these hemodynamic parameters are also affected by other factors such as gestational and postnatal age of the neonate.5, 6
Accurate measurement of CBF and OEF relies on appropriate MRI techniques. Phase-contrast (PC) MRI and arterial spin labeling (ASL) have been successfully applied in human neonates to quantify CBF.2-6 PC MRI measures the blood flow in the feeding arteries of the brain to provide a global measurement of CBF and has the advantage of short scan time (1–2 minutes).3, 5 In contrast, ASL provides regional CBF mapping by magnetically labeling water in the arterial blood as an endogenous tracer.2, 4, 6 Brain perfusion mapping in healthy and sick newborns has been conducted by both pulsed ASL (PASL)4, 7 and pseudo-continuous ASL (PCASL).6, 8, 9 Compared to PASL, PCASL provides higher sensitivity to perfusion signal and has been demonstrated with better image quality in neonatal brains.8 However, both PASL and PCASL suffer from low signal-to-noise ratio (SNR) because of the prolonged arterial transit time (ATT) in neonates.9 Alternatively, velocity-selective ASL (VSASL) is insensitive to ATT and has demonstrated improved SNR over conventional ASL methods.10-12
A limited number of MRI-based techniques have been developed to measure OEF in the human neonatal brain without the use of exogenous contrast agents.2, 5, 13, 14 Among them, T2-relaxation-under-phase-contrast (TRUPC) is an MRI technique that can measure OEF in multiple major cerebral veins, such as the superior sagittal sinus (SSS) and internal cerebral veins (ICVs), thereby enabling the assessment of OEF for both cortical and subcortical brain regions.14 If OEF and CBF are both quantified, CMRO2 can then be calculated using the Fick principle.5
Animal models provide the opportunity to develop new metrics to investigate how CBF, OEF, and CMRO2 relate to normal brain structure, function, and brain damage under well-controlled conditions. Piglets have similar brain growth patterns and cerebral anatomical structures as human neonates, and the regional distribution of neuropathology in piglet HIE resembles that in human newborns.15 MRI in piglet models of HI and excitotoxicity, an integral cytotoxic molecular cascade that contributes to neonatal HIE,16 can also provide salient information relevant to human neonatal brain injuries.17, 18 However, so far, neonatal piglets with brain damage have been primarily interrogated using structural imaging, such as T1-weighted, T2-weighted imaging, and diffusion imaging techniques.17, 18 There is a paucity of MRI sequences to assess oxygen delivery and consumption in clinically relevant neonatal piglet models of HIE.
To facilitate future investigations on neonatal encephalopathy with the piglet model, we sought to test the feasibility of PC, VSASL, and TRUPC in quantifying CBF, OEF, and CMRO2 in different brain regions using piglets recovered from focal excitotoxic or global HI brain injuries.
Materials and Methods
The Animal Care and Use Committee approved all protocols, which were in compliance with the United States Public Health Service Policy on the Humane Care and Use of Laboratory Animals and the Guide for the Care and Use of Laboratory Animals. Ten neonatal male piglets were included. Two encephalopathy models were studied: excitotoxic brain injury model and global HI brain injury model.
Piglet Preparation and Brain Injury Models
Prior to imaging, each piglet underwent one of three procedures: excitotoxic brain injury induced by stereotaxic quinolinic acid (QA) injection into the striatum, global HI injury, or sham procedure. The piglet preparation, procedural anesthesia, and brain injury protocols were previously published.17, 18 Briefly, piglets were anesthetized and intubated for mechanical ventilation. The external jugular vein was catheterized for the administration of fentanyl (20 μg/kg bolus + 20 μg/kg/hour, intravenous [IV]). A femoral arterial catheter was placed to monitor heart rate and blood pressure. Piglets were kept on warming blankets to maintain normothermia.
Excitotoxic brain injuries were induced in six anesthetized piglets.17, 18 Bilateral cranial burr holes 2–3 mm in diameter were drilled 10 mm anterior to the bregma suture and 10–12 mm lateral to midline. A sterile needle was advanced 15 mm deep from the cortical surface to target the putamen, which is an area commonly injured in HIE.19 QA in phosphate-buffered saline (PBS, pH 7.4) was injected into the right brain in different doses: one piglet with 240 nmol (4 μL) injection, three with 720 nmol (12 μL), and two with 960 nmol (16 μL). PBS in equal volume was injected into the left putamen as a control. After QA injection, piglets awakened from anesthesia, recovered for 20 to 96 hours, and then underwent a second anesthetic for MRI as described in the next subsection.
Global HI brain injury was induced in two anesthetized piglets, and an additional two anesthetized piglets underwent sham procedure. To induce hypoxia, the inhaled oxygen concentration was decreased to 10% for 45 minutes. Then the piglets received room air for 5 minutes, which is required for cardiac resuscitation in this model. To cause asphyxia, the endotracheal tube was subsequently clamped for 8 minutes. The piglets were resuscitated with chest compressions, 50% oxygen, and epinephrine 100 μg/kg IV. The sham piglets received the same anesthetic and placement of vascular catheters but without hypoxia or asphyxia. Piglets then recovered from anesthesia and were survived for 45 hours to 1 week until the MRI scan.
Anesthesia for MRI
The anesthesia protocol for MRI followed a previously published protocol.17 Immediately before the MRI, the piglets were anesthetized for tracheostomy. A tracheal tube was placed to bypass potential laryngeal swelling caused by the first intubation. The inhaled anesthetic was titrated off as the piglets were transitioned to propofol (7.5 mg/kg/hour IV plus 1–2 mg/kg boluses and infusion increases by 2 mg/kg/hour, as-needed) and fentanyl (100 μg/kg/hour IV plus 12.5mcg/kg boluses and infusion increases by 12.5 mcg/kg/hour, as-needed). To minimize the risk of cerebral hypoperfusion, dopamine was started, when necessary, at 5 mcg/kg/minute and titrated to maintain mean arterial blood pressure (MAP) ≥45 mmHg. During the MRI scan, piglets were mechanically ventilated to maintain normocapnia with inhaled 50%/50% oxygen/air. MAP, heart rate, and end-tidal carbon dioxide (EtCO2) were recorded every 15 minutes. The piglets' hematocrit (Hct) levels were measured prior to the MRI scan.
MRI Sequences
All MRI experiments were performed on a 3 T clinical scanner (Prisma, Siemens Healthineers, Erlangen, Germany) with a 15-channel knee coil.
For structural reference of the piglet brain, a two-dimensional turbo-spin-echo (TSE) T2-weighted image was acquired with following parameters: repetition time (TR) = 5920 msec; echo time (TE) = 92 msec; slice thickness = 1.2 mm; 42 slices; in-plane resolution = 0.4 × 0.4 mm2 with matrix size 256 × 256; coronal in-plane field of view (FOV) = 100 × 100 mm2; GeneRalized-Autocalibrating-Partial-Parallel-Acquisition (GRAPPA) factor = 2; 15 averages; total duration = 15.2 minutes.
Velocity-selective inversion (VSI) prepared VSASL was implemented with three-dimensional gradient-and-spin-echo (GRASE) readout to obtain cerebral perfusion maps of piglets. The details of the pulse sequence, including the slab-selective saturation module, the VSI label and control modules interleaved through the dynamics, the background suppression, and flow-dephasing modules, have been described previously.11 The cutoff velocity for labeling was set as 2.8 cm/s, and the velocity-encoding gradients were applied along the anterior–posterior direction. The delay between slab-selective saturation module and label/control module was 2.5 s. The post-labeling delay (PLD) was chosen as 1.5 s. Parameters for the three-dimensional GRASE readout with coronal orientation were: excitation flip-angle (FA) = 90°; refocusing FA = 120°; acquisition voxel-size = 2.4 × 2.4 × 2.4 mm3 reconstructed to 1.2 × 1.2 × 2.4 mm3; FOV = 158 × 158 × 48 mm3; bandwidth = 2894 Hz/pixel; TE/TR = 17.24/4400 msec; echo-planar-imaging (EPI) factor = 23; TSE factor = 12; four segments were acquired for each image; and a total of four label/control pairs for 5 minutes. A proton density-weighted image (SIPD) was also acquired by disabling labeling and setting the TR to 10.0 s (total scan time = 1 minute).
To measure PC-based CBF, a time-of-flight (TOF) scan was first performed to visualize the major cerebral feeding arteries, i.e., the left and right internal cerebral arteries (ICAs), using the following parameters: FOV = 120 × 120 × 40 mm3, reconstruction voxel-size = 0.2 × 0.2 × 0.5 mm3, TR/TE = 20.0/3.1 msec, 2 averages, scan time = 2.1 minutes. Then, two PC scans were acquired to measure the flow through each ICA and were positioned to be perpendicular to each artery based on the TOF scan. The PC sequence parameters included: FOV = 80 × 80 × 3 mm3, voxel-size = 0.3 × 0.3 × 3 mm3, TR/TE = 22.6/7.2 msec, velocity-encoding (VENC) = 10 or 20 cm/s, 6 averages, scan time = 0.6 minute.
TRUPC was acquired in a coronal plane approximately 10 mm anterior to the sinus confluence, using the following parameters14: FOV = 80 × 80 × 5 mm3, acquisition matrix = 160 × 90, reconstruction voxel-size = 0.5 × 0.5 × 5.0 mm3, VENC = 5 cm/s, TE = 12.3 msec, recovery time = 460 msec, effective echo times (eTEs) = 0, 40, and 80 msec, and scan time = 4.9 minutes.
Image Processing
The T2-weighted images were first co-registered to the VSASL images using rigid body transformation with SPM12 (Statistical Parametric Mapping; Wellcome Department of Imaging Neuroscience, Institute of Neurology, London, UK). Data were then analyzed with Matlab 2019b (The MathWorks, Natick, MA, USA) and ImageJ (Rasband W., National Institutes of Health, USA).

| TRUPC | PC | VSASL | |||||||||
|---|---|---|---|---|---|---|---|---|---|---|---|
| Piglet # | Treatment | Time after injury (hour) | Hct (%) | EtCO2 (mmHg) | OEF (ICV) (%) | OEF (SSS) (%) | CBF (mL/minute/100 g) | CMRO2 (μmol/minute/100 g) | rCBF | CBF (mL/minute/100 g) | CMRO2 (μmol/minute/100 g) |
| 1 | Sham | 168 | 21.6 | 34.5 | 48.1 | 61.2 | 27.3 | 75.9 | N/A | N/A | N/A |
| 2 | Sham | 23 | 22.5 | 38.0 | 52.8 | 55.4 | 19.9 | 51.9 | 1.5 | 35.7 | 93.3 |
| 3 | QA (240 nmol) | 96 | 24.1 | 36.0 | 46.3 | 63.4 | 21.5 | 68.9 | 1.3 | 21.9 | 70.3 |
| 4 | QA (720 nmol) | 96 | 24.3 | 34.0 | N/A | 68.5 | 10.7 | 37.4 | N/A | 22.2 | 77.4 |
| 5 | QA (720 nmol) | 91 | 24.3 | 36.0 | 52.7 | 59.1 | 36.3 | 109.4 | 1.4 | 22.2 | 67.1 |
| 6 | QA (720 nmol) | 20 | 16.8 | 46.5 | 49.1 | 48.5 | 55.4 | 94.8 | 0.9 | 43.3 | 74.2 |
| 7 | QA (960 nmol) | 25 | 23.4 | 77.5 | 21.2 | 21.3 | 279.3 | 292.3 | 0.7 | 64.4 | 67.4 |
| 8 | QA (960 nmol) | 24 | 20.4 | 42.0 | 37.9 | 43.1 | 45.0 | 83.1 | 0.8 | 36.8 | 68.0 |
| 9 | HI | 45 | 23.4 | 43.0 | 41.4 | 49.1 | N/A | N/A | 0.8 | 28.5 | 68.8 |
| 10 | HI | 65 | 28.4 | 39.0 | 40.5 | 45.5 | 41.1 | 111.5 | 0.9 | 36.4 | 98.7 |
| Mean | 22.9 | 38.8 | 46.1 | 54.9 | 32.1 | 79.1 | 1.1 | 30.9 | 77.2 | ||
| SD | 3.2 | 4.3 | 5.6 | 8.8 | 14.9 | 26.2 | 0.3 | 8.3 | 12.2 | ||
| CoV (SD/mean, %) | 14.0 | 11.1 | 12.2 | 16.0 | 46.4 | 33.1 | 28.3 | 26.9 | 15.8 | ||
- Piglet #7 was considered as an outlier due to almost twice-of-average EtCO2, and excluded from the statistical analyses.
- QA = quinolinic acid injection; HI = global hypoxia-ischemia; Hct = hematocrit; EtCO2 = end-tidal carbon dioxide; TRUPC = T2-relaxation-under-phase-contrast; PC = phase contrast; VSASL = velocity-selective arterial spin labeling; OEF = oxygen extraction fraction; SSS = superior sagittal sinus; ICV = internal cerebral vein; CBF = global cerebral blood flow for PC or whole-brain averaged CBF for VSASL; rCBF is the relative CBF of putamen and caudate of right side to the left side; CMRO2 = cerebral metabolic rate of oxygen of the whole brain; CoV = coefficient of variation; N/A = data not acquired.
A neuropathologist and neuroanatomist with 36 years of experience in human and large animal brain (monkey, dog, cat, piglet) neuroanatomy and 20 years of experience in MRI (L.J.M.) and an MRI physicist with 10 years of MRI experience (D.L.) annotated the brain structures on the VSASL-based CBF maps. Regions of interest (ROI) for the whole brain were manually drawn from the final CBF maps (D.L.) to calculate the average CBF. For all piglet brains, ROIs were manually drawn in consensus to encompass the left and separately right putamen and caudate. Relative CBF (rCBF) was defined as the ratio of mean CBF of the right ROI to the left ROI.
The PC data were processed following previously reported methods.5 Briefly, the PC sequence produces three images: an anatomic image, a complex difference (CD) image showing the vessels, and a flow velocity map. For each ICA, an ROI was manually drawn by an MRI physicist with 9 years of MRI experience (D.J.) in the CD image by closely tracing the boundary of the artery. This ROI was then applied to the flow velocity map, and the flow rate (in mL/minute) of the artery was quantified by spatially integrating the velocities within the ROI. The PC based CBF (mL/100 g/minute) was calculated by dividing the sum of the flow rates of the two ICAs by the brain mass (in 100 g), which was estimated from the volumes of ROIs of the whole brain manually drawn from the high-resolution T2-weighted images (D.L.), assuming a brain tissue density of 1.06 g/mL.5 Note that we did not include the vertebral arteries or the basilar artery in the PC CBF calculation because they were not visible in the TOF angiogram and are very small even in juvenile pigs.22


Neuropathology
Neuronal damage was assessed using our published methods.17, 18 Briefly, after the MRI scan, the anesthetized piglets were euthanized and intra-aortically perfused for exsanguination and brain fixation. The heads were submerged in 4% paraformaldehyde for 12–24 hours for further brain fixation. The brain was then removed from the skull and immersed in fresh 4% paraformaldehyde. Finally, the brains were blocked for paraffin processing and sliced into coronal sections (10 μm thick) for hematoxylin and eosin (H&E) staining. H&E tissue sections were identified to anatomically match major structures from the CBF maps by a neuropathologist (L.J.M.) and a MRI physicist (D.L.) in consensus.
One investigator with 10 years of experience in experimental neuropathology (J.K.L.) classified and counted neuronal cell bodies in 9–10 non-overlapping fields in the caudate and 10 non-overlapping fields in the putamen at 400× magnification. Neurons were assigned to one of three categories: 1) normal; 2) degenerating and undergoing irreversible cell death; or 3) injured with uncertain fate and without overt degeneration according to published criteria.17, 18 A second investigator with 36 years of neuropathology experience (L.J.M.) screened the slides to verify that two independent observers would reach the same result without any statistically significant differences between the observers' neuron classifications and counts. Both investigators were blinded to the cerebral hemodynamic data and treatment group.
Brain Regional Mitochondrial Localization
We visualized mitochondria within different brain areas to inspect a surrogate histological marker for regional and cellular metabolic demand.27, 28 Immunohistochemical staining with a primary antibody for the mitochondrial matrix protein superoxide dismutase 2 (SOD2, 1:100, rabbit polyclonal IgG, Enzo Life Sciences, Farmingdale, NY) was conducted using a published immunoperoxidase protocol.25 The slides were then incubated with goat anti-rabbit IgG (1:20, Sigma-Aldrich, St. Louis, MO) secondary antibody and rabbit peroxidase anti-peroxidase soluble complex antibody (1:100, Sigma-Aldrich). Mitochondria were identified as dark brown particles by developing the slides with 3,3′-diaminobenzidine. All slides were stained together for SOD2 immunohistochemistry, and the microscope photographs were taken with the same lighting and imaging software configurations. Post-acquisition image processing for figure construction was identical. Darker brown staining in different brain regions and cells indicates higher mitochondrial SOD2 density (immunoreactivity).
Statistical Analysis
Statistical analyses were performed using Matlab. Results are reported as mean ± SD and coefficient of variation (CoV = SD/mean) unless otherwise noted. Spearman correlations were used to evaluate the associations: 1) between PC-based global CBF and VSASL-based global CBF averaged from the three-dimensional whole-brain CBF map; 2) between these two global CBF values and the OEF obtained from SSS; and 3) between EtCO2 and PC-based global CBF, OEF, and CMRO2. The relationships between the deep-brain hemodynamic measures (i.e., right-to-left rCBF in putamen and caudate and OEF measured at ICV) and the neuropathological cell counts (i.e., the ratio of degenerating-, normal-, and injured-to-total neurons in caudate and putamen) were explored using Spearman correlations. Paired t-test was used to compare OEF measured at SSS with OEF measured at ICV. A two-tailed P < 0.05 was considered statistically significant. The immunohistochemical data for SOD2 were presented descriptively.
Results
Ten neonatal piglets (2–4 days old, 1–2.2 kg) underwent excitotoxic brain injury from QA (N = 6), global HI injury (N = 2), or sham procedure (N = 2). Sham piglets had highly stable physiological parameters, including arterial pH ~7.4, arterial partial pressure of carbon dioxide (PaCO2) ~41 mmHg, arterial partial pressure of oxygen (PaO2) ~140 mmHg, and base excess approximately −3. The physiologic severity of the HI protocol induced similar blood gas physiology at 7 minutes of asphyxia with arterial pH 6.84 and 6.92, PaCO2 115 mmHg and 108 mmHg, PaO2 18 mmHg and 20 mmHg, and base excess −14.3 and −10.9 in the two piglets. Both piglets were resuscitated with the restoration of pH to greater than 7.30, normocarbia, and normoxia, and extubated 3 hours after the HI injury.
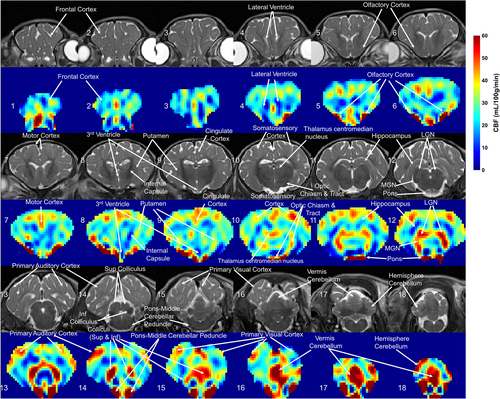
Quantitative regional CBF maps obtained by three-dimensional VSASL from a sham piglet are shown in Fig. 1, with corresponding T2-weighted images. The ROIs of different structures in this sham piglet's brain are delineated in Fig. S1 in the Supplemental Material. The piglet neocortex showed non-uniform cerebral perfusion with higher CBF in the primary sensory cortical areas (auditory, visual, somatosensory, and olfactory: 41.6 ± 5.2, 39.5 ± 5.7, 33.0 ± 8.5, and 67.7 ± 47.7 mL/100 g/minute, respectively) (Fig. 1, slices 5, 6, 10, 13–16). Primary motor cortex had a CBF of 37.5 ± 6.3 mL/100 g/minute (Fig. 1, slice #7). In contrast, the lateral convexity of the frontal cortex showed lower perfusion (20.7 ± 4.5 mL/100 g/minute) (Fig. 1, slice #1–4). The hippocampus had very low apparent perfusion (12.9 ± 5.1 mL/100 g/minute) (Fig. 1, slice #12). In subcortical forebrain gray matter, the caudate nucleus and putamen (33.2 ± 5.3, 31.7 ± 4.1 mL/100 g/minute) were divisible from the central thalamus and globus pallidus by their higher perfusion (Fig. 1, slice #9). Thalamus was also notable because some parts showed low cerebral perfusion while other parts, such as the visual relay lateral geniculate nucleus (LGN) and auditory relay medial geniculate nucleus (MGN), had comparably higher CBF (49.5 ± 6.5, 49.7 ± 6.9 mL/100 g/minute) (Fig. 1, slice #12). The brainstem tectal collicular nuclei visual and auditory relay centers correspondingly showed high CBF (51.2 ± 39.6 mL/100 g/minute) (Fig. 1, slice #14, 15). Moreover, brainstem structures such as the pons and middle cerebellar peduncle, which are known to provide afferents to cerebellum, were delineated by high perfusion (75.8 ± 21.6 mL/100 g/minute) (Fig. 1, slice #14) in a pattern consistent with high perfusion in the cerebellar vermis (49.7 ± 14.5 mL/100 g/minute) (Fig. 1, slice #17).
Different brain levels seen by H&E staining and SOD2 immunohistochemistry are shown next to the CBF maps (Fig. 2). In a descriptive evaluation of SOD2 immunolocalization, different brain regions appeared distinct because they were divisible by varying intensities of mitochondrial positivity. Figure 2a illustrates this finding with a comparison of high SOD2 immunoreactivity in the LGN (Fig. 2a, right) to the much lower SOD2 staining in the nearby hippocampus (Fig. 2a, left) within the same tissue section. In brainstem, the superior and inferior colliculi were identifiable in the H&E section and in the CBF maps (Fig. 2b). Cerebellar cortex showed exquisite distinctions in intracellular mitochondrial loads even within the same cell types but in different cortical subregions. In the lateral cerebellar hemisphere, the neocerebellum, the Purkinje cell bodies were generally SOD2 negative at this age (Fig. 2c, left). In the cerebellar vermis, the medial unpaired component of the cerebellar cortex, Purkinje cells had contrastingly high mitochondrial enrichment (Fig. 2c, right).
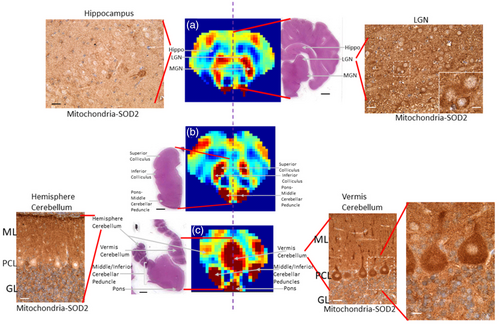
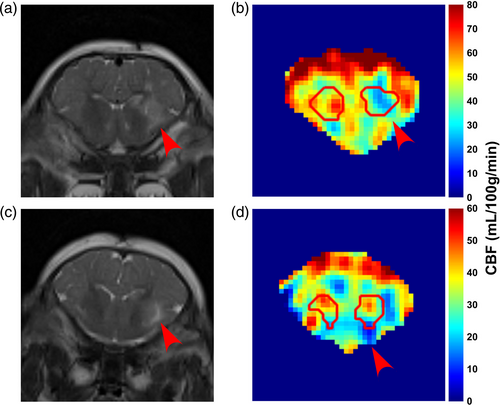
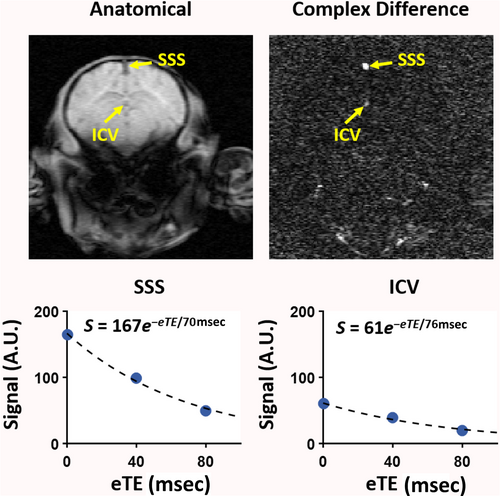
Figure 3 shows two different piglets with 960 nmol QA injection in the right putamen that were scanned ~24 hours after the injury. The T2-weighted images show the unilateral injury as witnessed by the higher signal intensity (Fig. 3a,c, red arrows). Figure 4 shows the TRUPC data of a sham piglet. The physiological values (Hct, EtCO2) and MRI-based hemodynamic parameters (CBF, OEF, and CMRO2) of each piglet are listed in Table 1, along with their group-averaged values. One piglet with 960 nmol QA injection was considered as an outlier due to almost twice-of-average EtCO2 and was excluded from the statistical analyses. The Hct and EtCO2 of the remaining nine piglets were 22.9 ± 3.2% and 38.8 ± 4.3 mmHg with CoV of 14.0% and 11.1%, respectively. With the PC-based method, the global CBF was 32.1 ± 14.9 mL/100 g/minute with a CoV of 46.4%. Using the VSASL-based approach, the CBF averaged from the whole-brain CBF map was 30.9 ± 8.3 mL/100 g/minute with a CoV of 26.9%. The OEF measured at the SSS was 54.9 ± 8.8% with a CoV of 16.0%. In one piglet, the OEF at ICV was excluded due to ΔR2 ≥ 10 Hz. Across the remaining eight piglets, OEF at ICV was 46.1 ± 5.6% with a CoV of 12.2% and was significantly lower than the OEF at SSS (P < 0.05). With the OEF obtained from SSS, the global CMRO2 derived from PC-measured CBF was 79.1 ± 26.2 μmol/100 g/minute with a CoV of 33.1%, and the global CMRO2 derived based on VSASL-measured CBF was 77.2 ± 12.2 μmol/100 g/minute with a CoV of 15.8%.
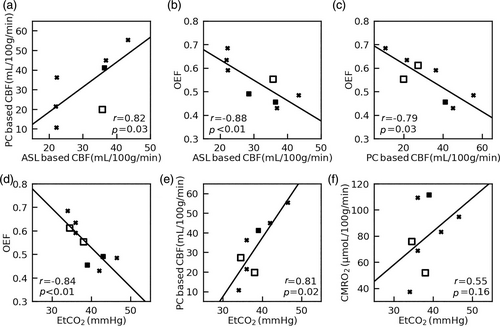
We found a significant positive correlation between PC and VSASL based global CBF values (N = 7, r = 0.82, P < 0.05, Fig. 5a). Negative correlations between OEF at SSS and both VSASL global CBF (N = 8, r = −0.88, P < 0.05, Fig. 5b) and PC global CBF (N = 8, r = −0.79, P < 0.05, Fig. 5c) were observed. EtCO2 was negatively correlated with OEF at SSS (N = 9, r = −0.84, P < 0.05) but positively correlated with PC global CBF (N = 8, r = 0.81, P < 0.05). There was no correlation between EtCO2 and PC-based CMRO2 (N = 8, r = 0.55, P = 0.16) (Fig. 5d–f).
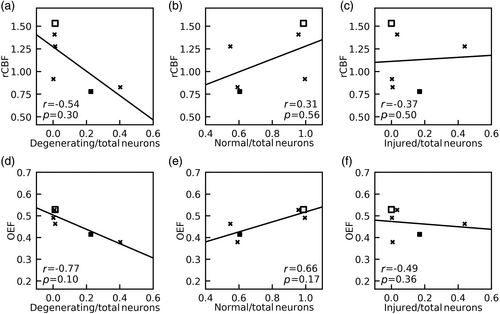
For the analysis of neuron counts to MRI, two piglets (one sham and one HI) without neuropathology cell counts were excluded. A third piglet (with QA 720 nmol) was excluded due to imaging artifact in the deep brain CBF map and unreliable OEF at ICV (ΔR2 ≥ 10 Hz). In the remaining six piglets, rCBF of putamen and caudate and OEF obtained from ICV showed no significant correlations with the ratio of degenerating-to-total neurons (rCBF: r = −0.54, P = 0.30, Fig. 6a; OEF: r = −0.77, P = 0.10, Fig. 6d), the ratio of normal-to-total neurons (rCBF: r = 0.31, P = 0.56, Fig. 6b; OEF: r = 0.66, P = 0.17, Fig. 6e), or the ratio of injured-to-total neurons (rCBF: r = −0.37, P = 0.50, Fig. 6c; OEF: r = −0.49, P = 0.36, Fig. 6f).
Discussion
Our study demonstrated the feasibility of multi-parametric evaluation of cerebral hemodynamics in neonatal piglets with excitotoxic and HI brain injury using non-invasive MRI techniques. CBF was evaluated by PC MRI and VSASL, and OEF was evaluated by TRUPC MRI. VSASL provided a high-resolution neuroanatomical interrogation of regional CBF that appears to be related to gray matter mitochondrial enrichment. When averaged across the whole brain, the VSASL-based CBF values of each piglet showed a significant correlation with PC-based global CBF. EtCO2 was negatively correlated with OEF at SSS. In the striatal areas injured by QA, decreased perfusion signal was revealed in regional CBF maps. We found no significant correlation between neuron counts and rCBF in putamen and caudate or OEF at ICV.
The annotated maps of CBF are salient because they show regional CBF variations in newborn piglet brain within the context of known neuroanatomy. We observed distinct CBF differences in cerebral cortex that match known functional domains. For example, higher perfusion was seen in the primary sensory cortices (olfactory, somatosensory, visual, auditory) compared to the dorsolateral prefrontal cortex. This finding is consistent with advanced maturation in sensory brain regions but not in areas with cognitive and executive functions at this age.26 However, the cingulate cortex also had generally higher CBF than other cortical regions and has executive functions too, but it also has autonomic and limbic functions involved in processing aversive stimuli. The very low perfusion in hippocampus in neonatal piglets reinforces this conclusion. Furthermore, we observed starkly segregated, high perfusion regions within functionally active neural systems and their connectomes. For example, the piglet central visual system, which is an energetically demanding network,27 had high perfusion throughout the brainstem (tectum), diencephalon (LGN), and neocortex (occipital cortex). Thus, mapping CBF in specific brain networks could advance neonatal neurocritical care medicine because metabolism-connectivity could be partially responsible for the neonatal brain's regional vulnerability to HIE.28 Our observation of relatively higher perfusion to thalami, basal ganglia, brainstem, cerebellum, and sensorimotor cortex than other regions agree with results from applying long or multiple-PLD three-dimensional PCASL in human neonate brain.6, 9
The contrast of perfusion in various brain structures was supported by the localization of mitochondria by SOD2 immunohistochemistry. Visual differences in regional CBF suggest that different structures have varying oxidative phosphorylation needs and that regional mitochondrial SOD2 differences might distinguish these structures. In prior work,28, 29 cytochrome c oxidase enzyme histochemistry was used to map in situ metabolic activity in neonatal piglet brain by disclosing the catalytic activity of complex IV. We could not apply this technique in the current study due to limitations in tissue processing. Notwithstanding, the SOD2 pattern generally matches the mitochondrial activity reported by Martin et al.29 The perfusion pattern we observed also resembles the reported cerebral glucose metabolism of human newborns using 18F-fluorodeoxyglucose PET,26 reflecting the metabolic activity at the early stages of brain development. The forebrain perfusion was consistent with olfaction being a dominant primary sense in pig.30
Measuring OEF is traditionally performed by PET imaging with 15O-labeled radiotracers.31 However, the invasive nature of the procedure and exposure to ionizing radiation are major obstacles to its applications in neonates.31 Optical methods such as near-infrared spectroscopy (NIRS) have been widely used to monitor neonatal cerebral oxygenation but have difficulty in probing the deep brain structures due to the limited penetration depth of light.32 In the past decade, several MRI-based techniques have been developed to measure OEF on a global level in neonates.2, 5, 13 However, regional OEF measurement is more desirable because many diseases, such as HIE and stroke, mainly affect specific brain regions.19, 33 In this work, we used the TRUPC MRI technique to quantify OEF in two major cerebral veins: the SSS which drains the majority of cerebral cortical veins, the falx cerebri, meninges, diploic veins, and emissary veins; and the ICV which is formed by the unification of the thalamostriatal, septal, and choroidal veins and drains deep brain regions including thalami and basal ganglia. Among them, OEF at SSS has been shown to be correlated well with whole-brain averaged OEF measured by 15O-PET.34 We found that EtCO2 correlated positively with PC-based CBF but negatively with OEF at SSS, and there existed a negative correlation between OEF at SSS and CBF (both PC-based and ASL-based). These findings are consistent with previous reports on human adults35, 36 and were thought to be related to the well-known vasodilatory effect of blood CO2 content and the balance between blood supply and oxygen extraction. We observed a lower OEF at ICV than OEF at SSS, which was consistent with previous reports on human neonates.14 The lower OEF at ICV may be explained by the higher CBF in deep brain structures like thalami and basal ganglia observed in this study and previous literature.6, 9
In our exploratory study of neuropathology in a small sample size, both the rCBF of putamen and caudate and OEF at ICV exhibited negative trends with the ratio of degenerating-to-total neurons; however, none of the associations were statistically significant. Unlike in stroke, piglet models of encephalopathy have selective and regional vulnerability with asynchronous cellular injury and degeneration. Damaged neural cells are not at the same stage of injury at any given time in vivo. To address this, we examined multiple recovery durations to capture different time points after brain injury to better study the neuropathology. We also specifically counted degenerating neurons that were undergoing irreversible, end-stage cell death.17 It should be noted that our neuronal cell counting was conducted in microscope fields that represented a very small portion of the large putamen and caudate ROI that was used to quantify rCBF. Moreover, the ICV-derived OEF included large brain regions that are drained by ICV but were not examined by microscopic neuropathology, such as the thalami. Therefore, given the small sample size (N = 6), it was not surprising that we did not observe significant associations.
Though we did not observe significant relationships between neuron counts and rCBF or OEF, other reports indicate that such a relationship does exist. Using an HI rat model induced by unilateral common carotid artery ligation and subsequent hypoxia, Vannucci et al found reduced CBF in multiple regions of the ipsilateral cerebral hemisphere and that the extent and spatial distribution of CBF reduction correlated with those of ischemic neuronal necrosis observed in a similar rat model.37 Kurth et al showed that piglets with longer HI duration tended to have more severe neuronal damage and also a higher cerebral oxygen saturation measured by NIRS, which indicated a lower OEF in these piglets.38 In human neonates, it has also been demonstrated that neonates with HIE had lower OEF than normal controls,2 and neonates with severe HIE had even lower OEF than those with moderate HIE.3 Although the relationships between CBF and/or OEF and neuropathology that we observed were statistically insignificant among a small sample size, our findings may support the rationale for larger studies investigating whether MRI can detect depressed tissue oxygen metabolism with neuronal cell death in neonatal brain.
Medications that induce general anesthesia are known to alter CBF, OEF, and CMRO2. Because all piglets in our study received the same anesthetic regimen, we expect similar anesthesia-related effects on these physiologic parameters in all piglets. Additionally, the inhaled oxygen concentration was closely monitored and maintained at 50% for all piglets during their MRIs scans. We did not study differences in cerebral oxygen supply and demand because that was beyond the scope of our study.
Limitations
Our study had several limitations. For CBF determination, the ROIs were delineated on the perfusion maps rather than from the anatomical maps. This was necessary because CBF maps revealed structural sub-compartmentation better than T2 MRI, including in the LGN and vermis. Our sample size was small, and the mitochondrial and neuropathology aspects of the study were exploratory. The goal of the present study was to test the feasibility of non-invasive quantification of cerebral hemodynamics in newborn piglet models using MRI. Due to the lack of significant correlations between CBF or OEF and the pathological neuron counts, it is out of the scope of this study to determine which hemodynamic parameter (CBF, OEF, or CMRO2) has better sensitivity to brain injuries. Nonetheless, future studies with a larger sample size are needed to fully investigate the association of CBF and OEF with mitochondrial localization and neuropathology, and compare the sensitivities to brain injury among the hemodynamic parameters. The TRUPC OEF measurements focused on large veins, i.e., SSS and ICVs, which receive venous blood drainage from large territories in both hemispheres, and due to the limited image resolution, we could not separate the left and right ICVs. These factors reduced the sensitivity of our OEF measurements to injuries induced by unilateral QA injection. Regional OEF measurement techniques that can measure OEF in smaller veins or even provide voxel-wise OEF mapping39, 40 will have better sensitivity and specificity to brain diseases and injuries that mainly affect specific regions. Therefore, future technical development of the TRUPC technique should target on imaging smaller cortical or subcortical veins that are closer to the injury sites. The piglets also had a delay between the acute brain injury and MRI scanning, which renders the observations temporally out of phase. In this regard, real-time MRI interrogation of excitotoxic lesion evolution would be novel and useful in providing needed insight into early sentinel mechanisms and neural consequences of stroke.
Conclusion
We measured hemodynamic parameters (CBF, OEF, and CMRO2) in neonatal piglet brain using non-contrast MRI techniques. VSASL-based CBF maps revealed well-defined regional CBF patterns that corresponded to known functional domains and matched to brain regions with varying mitochondrial enrichments as seen by direct localization of these organelles. CBF and OEF relationships to neuropathology were inconclusive. Our results suggest that these methods may be useful for monitoring perfusion and oxygenation of brain development and neuropathological conditions in human neonates.
Acknowledgments
This study was supported by National Institutes of Health R01 NS109029 (to P.L.), R01 HL144751 (to Q.Q.), R01 NS107417 (to J.K.L. and L.J.M.), and R01 NS113921 (to J.K.L. and L.J.M.).


