Imaging Pulmonary Blood Flow Using Pseudocontinuous Arterial Spin Labeling (PCASL) With Balanced Steady-State Free-Precession (bSSFP) Readout at 1.5T
Abstract
Background
Quantitative assessment of pulmonary blood flow and visualization of its temporal and spatial distribution without contrast media is of clinical significance.
Purpose
To assess the potential of electrocardiogram (ECG)-triggered pseudocontinuous arterial spin labeling (PCASL) imaging with balanced steady-state free-precession (bSSFP) readout to measure lung perfusion under free-breathing (FB) conditions and to study temporal and spatial characteristics of pulmonary blood flow.
Study Type
Prospective, observational.
Subjects
Fourteen volunteers; three patients with pulmonary embolism.
Field Strength/Sequences
1.5T, PCASL-bSSFP.
Assessment
The pulmonary trunk was labeled during systole. The following examinations were performed: 1) FB and timed breath-hold (TBH) examinations with a postlabeling delay (PLD) of 1000 msec, and 2) TBH examinations with multiple PLDs (100–1500 msec). Scan–rescan measurements were performed in four volunteers and one patient. Images were registered and the perfusion was evaluated in large vessels, small vessels, and parenchyma. Mean structural similarity indices (MSSIM) was computed and time-to-peak (TTP) of parenchymal perfusion in multiple PLDs was evaluated. Image quality reading was performed with three independent blinded readers.
Statistical Tests
Wilcoxon test to compare MSSIM, perfusion, and Likert scores. Spearman's correlation to correlate TTP and cardiac cycle duration. The repeatability coefficient (RC) and within-subject coefficient of variation (wCV) for scan–rescan measurements. Intraclass correlation coefficient (ICC) for interreader agreement.
Results
Image registration resulted in a significant (P < 0.05) increase of MSSIM. FB perfusion values were 6% higher than TBH (3.28 ± 1.09 vs. 3.10 ± 0.99 mL/min/mL). TTP was highly correlated with individuals' cardiac cycle duration (Spearman = 0.89, P < 0.001). RC and wCV were better for TBH than FB (0.13–0.19 vs. 0.47–1.54 mL/min/mL; 6–7 vs. 19–60%). Image quality was rated very good, with ICCs 0.71–0.89.
Data Conclusion
ECG-triggered PCASL-bSSFP imaging of the lung at 1.5T can provide very good image quality and quantitative perfusion maps even under FB. The course of labeled blood through the lung shows a strong dependence on the individuals' cardiac cycle duration.
Level of Evidence
2
Technical Efficacy Stage
2 J. MAGN. RESON. IMAGING 2020;52:1767–1782.
QUANTITATIVE ASSESSMENT of pulmonary blood flow and visualization of its spatial distribution can be of clinical significance in diseases affecting the pulmonary vessels (such as vasculitis or pulmonary embolism), the pulmonary interstitium (such as fibrosis), or in bronchial carcinoma.1-3 The current clinical practice in assessing vascular changes utilizes computed tomography (CT) or lung scintigraphy, which requires the use of injected contrast agents or radioactive tracers and exposes the patient to radiation.4, 5 Robust techniques free from side effects are therefore desirable for reliable and spatially resolved measurements of lung perfusion. Magnetic resonance imaging (MRI) also provides contrast-enhanced imaging techniques, eg, based on spoiled gradient-echo sequences.6-8 Considering that diseases affecting pulmonary perfusion tend to be chronic and treatment can be lifelong, the known phenomenon of retained gadolinium in the brain raises the question about the long-term harm of repeated injections.9, 10 Contrast-free imaging techniques such as Fourier decomposition have been introduced to gain quantitative information of regional lung perfusion11, 12; however, these techniques are not yet established in clinical routine and there are only a limited number of studies comparing these techniques to reference standards (eg, SPECT/DCE-MRI).
Arterial spin labeling (ASL) is another functional noninvasive MRI technique that is able to evaluate tissue perfusion by using blood water as an endogenous tracer.13, 14 However, even though the lung receives the whole cardiac output, the relatively low proton density, respiratory movements, complex vessel anatomy, and the highly pulsatile nature of the pulmonary circulation are anatomical and physiological conditions that make ASL imaging of the lung a challenging task. Pulsed ASL techniques have been introduced for perfusion measurements of the lung.15, 16 As compared to pulsed ASL techniques, the pseudocontinuous ASL (PCASL) approach provides, in general, a higher signal-to-noise ratio (SNR) and largely reduced sensitivity of the labeling region to motion.17 Previously, PCASL was used to measure pulmonary perfusion by labeling the inferior vena cava.18 However, the nonlabeled blood from the superior vena cava reduced the labeling efficiency and hindered accurate quantification. Moreover, data acquisition using single-shot turbo spin echo sequences led to strong image blurring. Recently, a combination of PCASL of pulmonary arteries and balanced steady-state free-precession (bSSFP) data acquisition was introduced to provide perfusion images of the lung at 3T.19 Although higher magnetic field strengths lead to a higher SNR in general, in MRI of the lung, the detection of sufficiently high and reproducible signal from the parenchyma is hampered by its short T2* values.20 Therefore, with regard to the application of ASL for measuring lung perfusion, it could be beneficial to image at lower magnetic field strengths.21
Thus, the aim of this work was to assess the potential of electrocardiogram (ECG)-triggered PCASL imaging with a bSSFP readout to measure lung perfusion at 1.5T under free-breathing conditions and to study the temporal and spatial characteristics of pulmonary blood flow.
Materials and Methods
Subjects
The study was approved by our local Ethics Committee. Written informed consent was given by all volunteers and patients regarding the examination and the scientific evaluation of their data. Fourteen healthy volunteers (29.4 ± 7.0 years, two female) and three patients (56, 83, 85 years, two female) were examined using a 1.5T whole body MRI scanner (Magnetom AvantoFit, Siemens Healthcare, Erlangen, Germany). Subjects were placed supine in the scanner and connected to the inbuilt physiological unit of the scanner for cardiac triggering.
Data Acquisition
Signal recording was performed with spine and body multichannel receiver coils. Pulmonary perfusion was measured using a balanced PCASL sequence22 with fast bSSFP data acquisition. In the PCASL sequence, a train of short RF pulses in the presence of a magnetic field gradient was used for flow-driven adiabatic inversion of the blood flowing through the labeling plane. A series of Gaussian shaped RF pulses with a flip angle of 25° and duration of 600 μs separated by a 600-μs delay was applied. The underlying strength of the positive gradients amounted to 7 mT/m, with a slightly larger gradient moment than that of the negative gradient lobe. Thus, inflowing blood is inverted while flowing through the labeling plane. The labeling plane was placed perpendicular to the pulmonary trunk, allowing simultaneous perfusion imaging of the right and left lung and avoiding crossing with the apex of the lung (Fig. 1, left). The labeling pulse train was triggered by the ECG signal and played out only during the systolic period, avoiding unnecessary RF power deposition to the body during the diastole without significant blood flow through the pulmonary trunk. The labeling duration (τ) was set to 300 msec to cover the systolic blood flow time. Following a postlabeling delay (PLD), coronal images were acquired using a fast bSSFP sequence with the following parameters: repetition time (TR) = 2.12 msec; echo time (TE) = 0.9 msec; flip angle = 70°; slice thickness = 10 mm; in-plane resolution = 3.3 × 2.5 mm2; partial-Fourier = 0.75; acquisition matrix = 144 × 192; readout bandwidth = 1260 Hz/pixel.
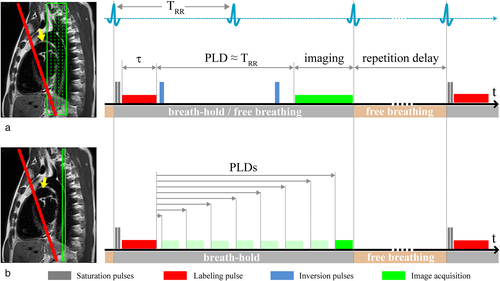
In 10 healthy subjects, two examination strategies were carried out: (Exam I) PCASL images were acquired at a single predefined PLD to evaluate a free-breathing (FB) examination scheme in comparison to a timed breath-hold (TBH) scheme and (Exam II) PCASL images with multiple PLDs were acquired to study the temporal and spatial characteristics of pulmonary blood flow using a TBH protocol.
Exam I: Free-Breathing and Timed Breath-Hold Examinations
Ten volunteers were examined with FB and TBH schemes. The measurements were performed with 20 label/control image pairs with a repetition delay of ≥5 sec. In FB, subjects were asked to breathe normally. In TBH, volunteers were asked to hold their breath (~ 2 sec) at the end of normal expiration while PCASL spin preparation and data recording were performed. During the repetition delay between image acquisition and consecutive measurement, the volunteers breathed freely (Fig. 1a). A series of four coronal slices with a gap of 2 mm was acquired sequentially from anterior to posterior, starting in diastole of the next cardiac cycle using a PLD of 1000 msec (for the first slice). Assuming a time delay between recordings of consecutive slices of ~230 msec, the PLD of the last slice was ~1690 msec.
To improve the quality of perfusion images, a background suppression (BS) scheme was utilized using a double inversion approach.23, 24 The BS scheme included saturation of the imaging plane, consisting of two slice-selective saturation RF pulses acting on the recorded slice and two global (nonselective) inversion pulses. Slice-selective pulses were applied prior to the start of the labeling experiment, whereas nonselective pulses for background suppression were applied after labeling of blood and prior to slice selective imaging (Fig. 1a). The BS pulse timing was adjusted to nearly cancel signal contributions from lung tissue.
A proton-density weighted (PDw) bSSFP image was acquired at the start of each sequence to estimate the initial longitudinal magnetization of the blood (S0b). To this end, inversion and saturation RF pulses of the BS scheme as well as of the labeling pulse train were switched off. Each FB and TBH measurement dataset, consisting of 20 label/control image pairs and a PDw image of all four slices, was acquired within ~5 minutes.
Exam II: Kinetics of Arterial Blood Transport in the Lung
In the same 10 volunteers as in the first part of our study (Exam I), eight measurements with PLDs 100, 300, 500, 700, 900, 1100, 1300, and 1500 msec were performed (Fig.1b). To be able to realize short PLDs, no background suppression inversion pulses were applied. Ten label/control image pairs and a PDw bSSFP image were acquired by employing the TBH protocol as described previously. Images of a single coronal slice were acquired using the fast bSSFP sequence as described above. Due to specific heart rates and with increasing PLD from 100 msec to 1500 msec, the measuring time varied between ~2:02 minutes and 2:40 minutes. The overall scan time for all eight measurements was ~18 minutes.
Scan–Rescan Examinations
Scan–rescan examinations of FB and TBH PCASL measurements with a single PLD (Exam I) were performed in three additional healthy volunteers. In one additional healthy subject the repeatability of multiple PLD measurements was evaluated (Exam II). Each volunteer was examined twice with a short walk between the two scans to have new scanner adjustment settings and to reposition the imaging and labeling planes. All other sequence parameters were identical to those in Exam I and Exam II.
Patient Examinations
To demonstrate the feasibility of the PCASL technique for imaging lung perfusion in clinical routine, three patients with pulmonary embolism were examined using an FB examination protocol with a single PLD. Shorter examination times were achieved in patients (~2–3 minutes) by reducing the number of label/control scans (10–15) and by using a shorter delay between repetitions (4 sec). Moreover, a shorter PLD of 800 msec was used to match the patients' shorter cardiac cycle duration. The remaining acquisition parameters were identical to those in the volunteer study. In one patient, the PCASL measurement was repeated after a short time delay, but without a repositioning in between (as the 83-year-old patient was short of breath). PCASL perfusion images of all three patients were compared to CT images acquired 0–4 days before the MR examinations. Pulmonary embolism in CT was diagnosed by a senior radiologist. In patients 1 and 3, thrombosis of the vena femoralis communis/superficialis was diagnosed by ultrasound. Patient 2 suffered from pancreas carcinoma, and pulmonary embolism occurred under chemotherapy.
Image Registration
Due to respiratory motion, the lungs were nonrigidly deformed during FB image acquisition. Moreover, small displacements of the diaphragm occurred between expiratory states in the TBH image series. Therefore, to reduce the motion effects and to improve the accuracy of perfusion values, ASL images were registered prior to further evaluation. All image registration steps were conducted by the open-source toolbox “elastix” (http://elastix.isi.uu.nl)25, 26 using an in-house developed MatLab (MathWorks, Natick, MA) script. Registration was performed by a cubic B-spline-based multiresolution nonrigid registration with mutual information27 as the similarity metric and a Quasi-Newton optimization algorithm over four resolution levels. A 2D slice-wise image registration was applied in consequence of the slice distance between neighboring images (12 mm). An overview of the registration steps for FB and TBH data measured at a single PLD (Exam I) and for data measured with multiple PLDs (Exam II) is given in Fig. S1 in the Supplemental Material. In the first step, all control/label images of each dataset were coregistered to the first control/label image within the image series and a mean label/control image was computed. In the second step, the mean label image and the PDw image were registered to the mean control image in order to achieve overall accordance within FB and TBH data (Exam I) or between data with different PLDs (Exam II). In the third step, to provide overall image agreement between ASL data acquired with FB and TBH protocols as well as between different PLDs, PDw images of both datasets were registered and the deformation fields from these registration tasks were used to transform label and control images. To assess the quality of image registration, the mean structural similarity (MSSIM) index28 was calculated for all three registration steps.
Image Segmentation
For an operator-independent comparison of the lung tissue perfusion measured in FB and TBH studies (Exam I) as well as for the evaluation of the temporal and spatial characteristics of pulmonary blood flow (Exam II), the lung was segmented in three components: 1) parenchyma, 2) large, and 3) small vessels using a Gaussian mixture model (GMM) with an expectation maximization algorithm.29 Masks of the left and right lung were selected manually. In Exam I, the clustering was based on the PDw images. For segmentation of Exam II data, the subtraction images with shortest PLD were additionally used due to the high contrast between lung parenchyma and pulmonary vessels, ie, the PDw images and subtraction images with the shortest PLD were processed separately with the GMM algorithm and the segmentation masks were subsequently combined.
Perfusion Analysis
For quantification of the lung perfusion, we followed an earlier model for analysis of ASL for lung perfusion measurements, which accounts for high pulsatile pulmonary flow and an ECG-gated acquisition scheme.16 Our model assumes a constant blood flow value, fsys, during systole in the pulmonary trunk and no blood flow in diastole. Under this assumption, the general kinetic model for the ASL signal can be adapted for calculation of pulmonary perfusion from PCASL data.30-33 A derivation of the PCASL perfusion signal is included in the Appendix. Systolic lung perfusion values, fsys, and average lung perfusion values per cardiac cycle, favg, were calculated for TBH and FB breathing schemes using Eqs. (A1) and (A2) in the Appendix.
Time Course Evaluation of Perfusion Signal
For the temporal and spatial evaluation of pulmonary blood flow, S0b-normalized perfusion-weighted images (Sctrl – Slab)/S0b were calculated for all PLDs, where Sctrl and Slab are signal intensities in control and label images, respectively, and S0b is the signal intensity of blood in the PDw SSFP images. The time course of the perfusion signal was assessed for the three tissue components in each volunteer dependent on the trigger delay TD, which was defined as τ + PLDi, where i = 1, 2, … 8. Time-to-peak (TTP) was determined as the TD of the maximum perfusion-related signal: TTP = τ + PLDSmax.
Image Quality Reading
To assess the subjective image quality, we performed a reading with three blinded and independent readers (senior radiologists) with at least 5 years of experience in MRI: F.S., A.O., and M.K. The perfusion-weighted images were rated using a 5-point Likert scale regarding (I) the contours of vessels and lung parenchyma, (II) artifacts, (III) homogeneity of perfusion signal in parenchyma, and (IV) overall image quality. Likert scale: 1 = poor, 2 = fair, 3 = good, 4 = very good, 5 = excellent for (I), (III), and (IV); for (II): 1 = strong artifacts, 5 = no artifacts. Same rating was performed for scan–rescan analysis. For patients with pulmonary embolism, the location of perfusion defects was noted (right/left lung and lobe) and the delineation was rated additionally using a Likert scale.
Statistical Analysis
 (1)
(1)
Results
Image Registration
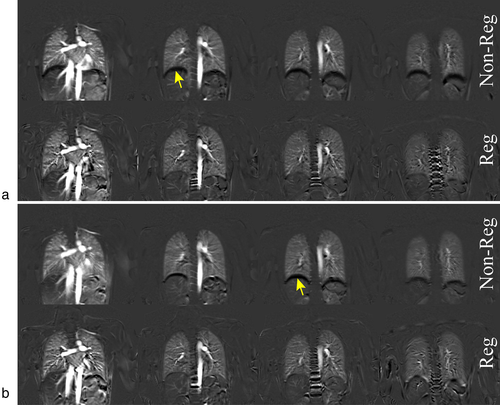
Image registration of FB and TBH data in Exam I resulted in an increase of MSSIM and achieved statistical significance (P < 0.05) in all steps except for registration step 1 of TBH data (Table 1). In Exam II, image registration led to a significant increase (P < 0.05) of MSSIM values in all registration steps (Table 2). Perfusion-weighted images of a volunteer acquired with TBH and FB protocols are shown in Fig. 2a,b, respectively. Respiratory artifacts are clearly visible on the nonregistered images (top rows).
| Registration step 1 | ||||||
|---|---|---|---|---|---|---|
| MSSIM Lab-&-Ctrl: TBH | MSSIM Lab-&-Ctrl: FB | |||||
| Slice # | Original | Registered | P-value | Original | Registered | P-value |
| 1 | 0.88 ± 0.11 | 0.91 ± 0.06 | 0.575 | 0.85 ± 0.05 | 0.91 ± 0.04 | 0.047* |
| 2 | 0.91 ± 0.08 | 0.93 ± 0.06 | 0.386 | 0.87 ± 0.05 | 0.94 ± 0.03 | 0.009* |
| 3 | 0.90 ± 0.08 | 0.94 ± 0.05 | 0.074 | 0.86 ± 0.06 | 0.95 ± 0.04 | 0.005* |
| 4 | 0.90 ± 0.08 | 0.94 ± 0.05 | 0.074 | 0.85 ± 0.06 | 0.95 ± 0.03 | 0.005* |
| Registration step 2 | ||||||
|---|---|---|---|---|---|---|
| MSSIM Lab-to-Ctrl: TBH | MSSIM Lab-to-Ctrl: FB | |||||
| Original | Registered | P-value | Original | Registered | P-value | |
| 1 | 0.92 ± 0.056 | 0.94 ± 0.065 | 0.017* | 0.92 ± 0.07 | 0.94 ± 0.07 | 0.005* |
| 2 | 0.98 ± 0.008 | 0.98 ± 0.009 | 0.007* | 0.97 ± 0.02 | 0.98 ± 0.02 | 0.005* |
| 3 | 0.99 ± 0.004 | 0.99 ± 0.004 | 0.009* | 0.99 ± 0.008 | 0.99 ± 0.01 | 0.017* |
| 4 | 0.96 ± 0.002 | 0.99 ± 0.005 | 0.959 | 0.99 ± 0.005 | 0.99 ± 0.01 | 0.878 |
| Registration step 3 | ||||||
|---|---|---|---|---|---|---|
| MSSIM FB-to-TBH | ||||||
| Non-registered | Registered | P-value | ||||
| 1 | 0.81 ± 0.14 | 0.97 ± 0.02 | 0.005* | |||
| 2 | 0.83 ± 0.10 | 0.96 ± 0.03 | 0.005* | |||
| 3 | 0.81 ± 0.13 | 0.96 ± 0.03 | 0.005* | |||
| 4 | 0.82 ± 0.12 | 0.93 ± 0.06 | 0.013* | |||
- MSSIM: mean structural similarity; Lab: labeling; Ctrl: control; TBH: timed breath-hold; FB: free breathing;
- * Indicates statistical significance.
| Registration step | Original | Registered | P-value | |
|---|---|---|---|---|
| 1 | MSSIM Lab-&-Ctrl | 0.95 ± 0.06 | 0.98 ± 0.02 | < 0.001* |
| 2 | MSSIM Lab-to-Ctrl | 0.94 ± 0.05 | 0.94 ± 0.05 | < 0.001* |
| 3 | MSSIM PLDs | 0.92 ± 0.06 | 0.94 ± 0.04 | < 0.001* |
- MSSIM: mean structural similarity; Lab: labeling; Ctrl: control; PLDs: postlabeling delays.
- * Indicates statistical significance.
Exam I: FB and TBH Examinations
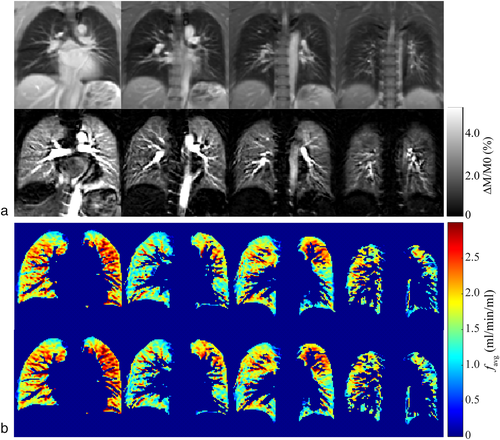
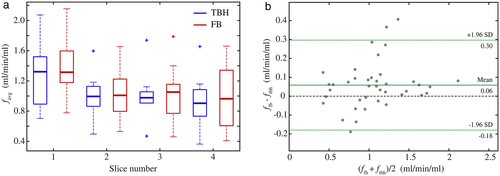
FB and TBH examinations were successfully performed and perfusion maps could be calculated in all volunteers. Figure 3a shows representative PCASL-bSSFP PDw and perfusion-weighted images of a volunteer. The sequence provided perfusion signal of the entire parenchyma in all four slices recorded, without relevant banding artifacts or signal voids in the lung parenchyma. It is noteworthy that the perfusion signal decreases in later acquired (ie, more dorsal) slices. Perfusion maps of the lung parenchyma calculated from TBH and registered FB data of the same subject show comparable spatial distribution in each slice (Fig. 3b). Table 3 compares systolic perfusion values, fsys, and average perfusion values per cardiac cycle, favg, obtained from TBH and FB parenchyma data of each slice. The mean perfusion values over all subjects and slices, fsys and favg, obtained from FB data (3.28 ± 1.09 and 1.10 ± 0.41 mL/min/mL) were ~6% higher (P < 0.05) as measured with the TBH protocol (3.10 ± 0.99 and 1.04 ± 0.39 mL/min/mL). The boxplot diagram in Fig. 4a shows a relatively large SD and some outliers of perfusion values in both the TBH and the FB examinations. The Bland–Altman plot in Fig. 4b visualizes the differences between perfusion values resulting from THB vs. FB data. Measured perfusion data for all subjects and slices is summarized in Table S1 in the Supplemental Material.
| fsys (mL/min/mL) | favg (mL/min/mL) | |||||
|---|---|---|---|---|---|---|
| Slice # | TBH | FB | P-value | TBH | FB | P-value |
| 1 | 3.86 ± 0.98 | 4.06 ± 0.90 | < 0.05* | 1.30 ± 0.43 | 1.36 ± 0.41 | < 0.05* |
| 2 | 2.91 ± 0.77 | 3.00 ± 0.82 | > 0.05 | 0.97 ± 0.32 | 1.00 ± 0.34 | > 0.05 |
| 3 | 2.90 ± 0.89 | 3.08 ± 1.04 | > 0.05 | 0.97 ± 0.36 | 1.03 ± 0.39 | > 0.05 |
| 4 | 2.72 ± 1.01 | 2.97 ± 1.30 | > 0.05 | 0.91 ± 0.37 | 0.99 ± 0.45 | > 0.05 |
- TBH: timed breath-hold; FB: free breathing.
- * Indicates statistical significance.
Exam II: Kinetics of Arterial Blood Transport in the Lung
PCASL measurements of the lung with multiple PLDs were successfully performed in all volunteers. Perfusion images at different PLDs for subjects 1, 5, and 10 (with cardiac cycle duration, TRR, of 964, 744, and 1094 msec, respectively) are representatively demonstrated in Videos SV1, SV2, and SV3 in the Supplemental Material. Perfusion images of subject 1 are also shown in Fig. 5a. Using tissue masks (Fig. 5b), normalized perfusion signal curves (Fig. 5c) in large and small pulmonary arteries as well as in the lung parenchyma were calculated. In the first four perfusion images recorded during the first diastole after the labeling (TDs from 400 to 1000 msec), the signal in the large pulmonary arteries slowly and continuously decreases, with the highest signal at the shortest TD of 400 msec. In small arteries, a slightly delayed perfusion signal curve can be observed with a peak at TD 600 msec. In contrast, a low perfusion signal was measured in lung parenchyma for short TDs. After the next systole (TRR of the subject was approx. 964 msec), a signal increase of the lung parenchyma can be observed reaching a maximum in the second diastole at TD 1400 msec, while the signal in the large and small arteries rapidly decreases.
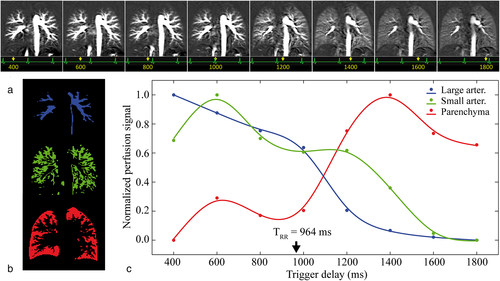
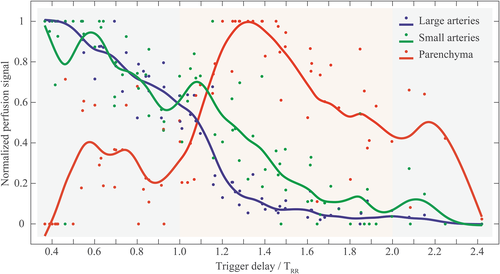
Table 4 summarizes the perfusion-weighted signal of the lung parenchyma obtained at different TDs for all subjects. TTP values were highly correlated (Spearman rho = 0.89, P < 0.001) with the individuals' TRR. The parenchymal perfusion reached its maximum value at a PLD nearly equally to TRR in all subjects (see last column in Table 4). For a better visualization of this observation (Fig. 6), the different TDs were set in relationship to the cardiac cycle duration of each subject (TD/TRR) and the perfusion-related signals of three tissue components were normalized. In all subjects, an increase in perfusion signal in the lung parenchyma is clearly identified early after the second systole (TD/TRR approximately between 1.2–1.5), while a washout can be observed in large and small arteries at the same time.
| Trigger delay (msec) | |||||||||||
|---|---|---|---|---|---|---|---|---|---|---|---|
| Subj. | 400 | 600 | 800 | 1000 | 1200 | 1400 | 1600 | 1800 | TRR (msec) | TTP (msec) | PLDSmax/TRR |
| 1 | 0.0043 | 0.0083 | 0.0066 | 0.0071 | 0.0146 | 0.0180 | 0.0144 | 0.0133 | 964 | 1400 | 1.141 |
| 2 | 0.0185 | 0.0248 | 0.0240 | 0.0294 | 0.0288 | 0.0247 | 0.0229 | 0.0231 | 801 | 1000 | 0.874 |
| 3 | 0.0060 | 0.0099 | 0.0105 | 0.0087 | 0.0127 | 0.0116 | 0.0096 | 0.0075 | 999 | 1200 | 0.901 |
| 4 | 0.0076 | 0.0120 | 0.0132 | 0.0151 | 0.0193 | 0.0164 | 0.0177 | 0.0153 | 866 | 1200 | 1.039 |
| 5 | 0.0159 | 0.0143 | 0.0200 | 0.0234 | 0.0221 | 0.0177 | 0.0201 | 0.0145 | 744 | 1000 | 0.941 |
| 6 | 0.0046 | 0.0067 | 0.0070 | 0.0071 | 0.0160 | 0.0146 | 0.0136 | 0.0112 | 936 | 1200 | 0.962 |
| 7 | 0.0207 | 0.0135 | 0.0110 | 0.0211 | 0.0246 | 0.0218 | 0.0184 | 0.0121 | 864 | 1200 | 1.042 |
| 8* | 0.0069 | 0.0123 | 0.0104 | 0.0080 | 0.0089 | 0.0145 | 0.0165 | 0.0128 | 1287 | 1700 | 1.010 |
| 9 | 0.0094 | 0.0130 | 0.0118 | 0.0137 | 0.0202 | 0.0185 | 0.0158 | 0.0136 | 952 | 1200 | 0.945 |
| 10 | 0.0060 | 0.0080 | 0.0072 | 0.0066 | 0.0082 | 0.0092 | 0.0091 | 0.0064 | 1094 | 1400 | 1.005 |
- Trigger delays are defined as PLDs + labeling duration with PLDs of 100, 300, 500, 700, 900, 1100, 1300, and 1500 msec. Maximum signal values, Smax, are highlighted in bold italics.
- TTP: time-to-peak; TRR: cardiac cycle duration; PLDs: postlabeling delays, PLDSmax: postlabeling delay at the maximum signal.
- * TTP of subject 8 is 1700 msec because of longer labeling duration (400 msec instead of 300 msec in all other subjects). Since the cardiac cycle of this subject was relatively long (1287 msec), a longer labeling duration was used to adapt the prolonged systolic period.
Patient Examinations
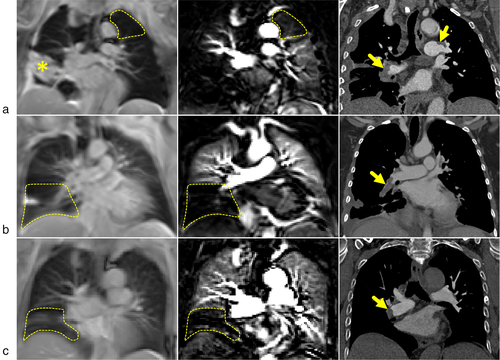
PCASL examinations under FB were successfully performed in all three patients. PCASL perfusion-weighted images of patients show regions of perfusion dropouts (Fig. 7, dashed lines), which visually correspond with embolisms in the left and right pulmonary arteries as detected in CT examinations. It should be mentioned here that scan–rescan PCASL measurements that were performed in one patient show relatively good agreement of lung regions with perfusion dropouts between corresponding perfusion-weighted images (see Fig. S2 in the Supplemental Material).
Scan–Rescan Examinations
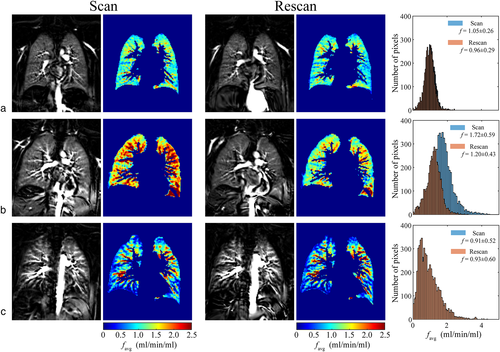
Scan–rescan examinations using TBH and FB protocols (Exam I) as well as with multiple PLDs (Exam II) were successfully completed. Results of TBH and FB scan–rescan measurements are summarized in Table S2 in the Supplemental Material. Our results show a relatively good agreement between TBH scan–rescan measurements with RC in the range 0.13–0.19 mL/min/mL and wCV of ~6–7%. However, the agreement between scan–rescan FB measurements was poor, with RC values of 0.47–1.54 mL/min/mL and wCV of 19–60%. Perfusion maps from FB scan and rescan data (first slice) and corresponding histograms of all three volunteers are shown in Fig. 8. The difference in perfusion values between scan and rescan measurements in one of three volunteers (Fig. 8b, subject 12) is the reason for the overall poor agreement of FB examinations. The Bland–Altman plots visualize the differences between perfusion values resulting from scan–rescan measurements in both THB and FB examinations (Fig. S3 in the Supplemental Material).
Perfusion-weighted images obtained in scan–rescan examinations with multiple PLDs are shown in Fig. 9a and time courses of perfusion-related signal in the different tissue components are depicted in Fig. 9b. Similar kinetics of blood flow transport can be observed in scan–rescan measurements and perfusion-related signal values in different tissue components showed a high correlation with Spearman's rho ≥ 0.93 (P < 0.001, see Table S3 in the Supplemental Material).
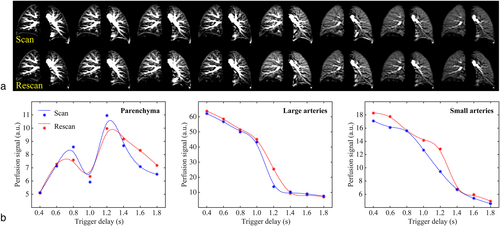
Image Quality Reading
The results of the image quality reading are shown in Table 5. In TBH and FB examinations, all parameters were rated very good or excellent except for artifacts under FB (median scores 3.5 or 3 in readers 1 and 2, respectively). Stronger artifacts were found in FB examinations as compared with the TBH examinations. The interreader agreement was good for all parameters under FB and TBH conditions except for the contours of lung and vessels under FB (ICC 0.71, moderate). No significant differences were found in Likert scores of scan–rescan examinations (P > 0.05). All readers correctly identified perfusion defects in patients with pulmonary embolism; the delineation of perfusion defects was rated as very good or excellent, respectively; ICCs were good or excellent, respectively. For scan–rescan examinations in one patient, the agreement of the parameters was excellent in all readers (perfect agreement; no statistical test was performed).
| Reader 1 | Reader 2 | Reader 3 | |||||||
|---|---|---|---|---|---|---|---|---|---|
| Score | P-value | Score | P-value | Score | P-value | ||||
| Volunteers (n = 10) | TBH vs. FB | TBH vs. FB | TBH vs. FB | ICC (95% CI) | P-value | ||||
| Contour | TBH | 4.5 | > 0.05 | 4.5 | > 0.05 | 4.5 | > 0.05 | 0.78 (0.55–0.78) | 0.003* |
| FB | 4.0 | 4.0 | 4.0 | 0.71 (0.15–0.92) | 0.012* | ||||
| Artifact | TBH | 4.0 | > 0.05 | 4.0 | > 0.05 | 5.0 | > 0.05 | 0.79 (0.38–0.94) | 0.002* |
| FB | 3.5 | 3.0 | 4.0 | 0.77 (0.31–0.94) | 0.004* | ||||
| Signal | TBH | 4.0 | > 0.05 | 4.0 | > 0.05 | 5.0 | > 0.05 | 0.87 (0.62–0.97) | < 0.001* |
| FB | 5.0 | 5.0 | 4.0 | 0.81 (0.45–0.95) | 0.001* | ||||
| Overall | TBH | 4.0 | > 0.05 | 4.0 | > 0.05 | 4.5 | > 0.05 | 0.88 (0.65–0.97) | < 0.001* |
| FB | 4.0 | 4.0 | 4.0 | 0.89 (0.70–0.97) | < 0.001* | ||||
| Reader 1 | Reader 2 | Reader 3 | ||||||||
|---|---|---|---|---|---|---|---|---|---|---|
| Volunteers scan–rescan (n = 3) | Scan | Rescan | P-value | Scan | Rescan | P-value | Scan | Rescan | P-value | |
| Contour | TBH | 4.0 | 4.0 | > 0.05 | 4.0 | 4.0 | > 0.05 | 5.0 | 4.0 | > 0.05 |
| FB | 5.0 | 5.0 | > 0.05 | 4.0 | 5.0 | > 0.05 | 4.0 | 4.0 | > 0.05 | |
| Artifact | TBH | 4.0 | 4.0 | > 0.05 | 4.0 | 4.0 | > 0.05 | 4.0 | 4.0 | > 0.05 |
| FB | 4.0 | 4.0 | > 0.05 | 5.0 | 5.0 | > 0.05 | 4.0 | 4.0 | > 0.05 | |
| Signal | TBH | 4.0 | 4.0 | > 0.05 | 5.0 | 5.0 | > 0.05 | 5.0 | 5.0 | > 0.05 |
| FB | 4.0 | 4.0 | > 0.05 | 4.0 | 4.0 | > 0.05 | 4.0 | 4.0 | > 0.05 | |
| Overall | TBH | 4.0 | 4.0 | > 0.05 | 4.0 | 4.0 | > 0.05 | 5.0 | 4.0 | > 0.05 |
| FB | 4.0 | 5.0 | > 0.05 | 4.0 | 4.0 | > 0.05 | 4.0 | 4.0 | > 0.05 | |
| Patients (n = 3) | Reader 1 | Reader 2 | Reader 3 | ICC |
|---|---|---|---|---|
| Contour | 5.0 | 4.0 | 5.0 | 0.81 |
| Artifact | 3.0 | 4.0 | 4.0 | 0.86 |
| Signal | 4.0 | 5.0 | 4.0 | 0.95 |
| Overall | 4.0 | 4.0 | 5.0 | 0.81 |
| Delineation | 5.0 | 5.0 | 5.0 | 0.94 |
| Reader 1 | Reader 2 | Reader 3 | ||||
|---|---|---|---|---|---|---|
| Patient scan–rescan (n = 1) | Scan | Rescan | Scan | Rescan | Scan | Rescan |
| Contour | 5.0 | 5.0 | 4.0 | 4.0 | 5.0 | 5.0 |
| Artifact | 3.0 | 3.0 | 4.0 | 4.0 | 4.0 | 4.0 |
| Signal | 5.0 | 5.0 | 5.0 | 5.0 | 5.0 | 5.0 |
| Overall | 4.0 | 4.0 | 4.0 | 4.0 | 5.0 | 5.0 |
| Delineation | 5.0 | 5.0 | 5.0 | 5.0 | 5.0 | 5.0 |
- Median values for the image quality ratings of three independent readers are given for perfusion-weighted images separately for 1) TBH and FB examinations in 10 volunteers; 2) scan–rescan measurements in three volunteers; 3) FB examinations in three patients; 4) scan–rescan measurements in one patient. P-values for the comparison between TBH and FB as well as between scan and rescan measurements in volunteers using a Wilcoxon-Test are given.
- TBH: timed breath-hold; FB: free breathing; ICC: intraclass correlation coefficient; CI: confidential interval.
- * Indicates statistical significance.
Discussion
The presented work demonstrates that ECG-triggered PCASL-bSSFP imaging of the lung at 1.5T can provide perfusion images of good visual quality. Using nonrigid image registration, quantitative perfusion maps can be achieved even from FB acquisitions. Using PCASL-bSSFP imaging with multiple PLDs, the kinetics of a labeled blood bolus in the lung can be monitored.
The lung is one of the best-perfused human organs, considering that the entire cardiac output of ~5 liters per minute passes through it.35 Therefore, in principle, the lung is suitable for ASL imaging. However, respiratory motion hinders pulsed ASL sequences being acquired under FB conditions due to strong artifacts caused by interferences between imaging and labeling regions. Moreover, pulsed ASL sequences have not clearly revealed homogeneous perfusion signals of capillary blood flow in lung parenchyma, as the sensitivity of the applied techniques was not high enough.16, 36, 37 In PCASL imaging, the labeling plane is separated from the image acquisition plane and the sensitivity of the labeling region to the motion of the lung is therefore largely reduced.17 Therefore, with the possibility of multiple signal acquisitions, the inherently higher SNR of PCASL as compared to pulsed ASL30 and the high labeling efficiency achieved by labeling the pulmonary trunk during systole, high-quality perfusion images may be generated.
We performed image registration to reduce motion and displacement artifacts and to enable an operator-independent perfusion evaluation of different tissue components by GMM clustering. Image registration led to a significant increase of MSSIM in most of the registration steps. After image registration, the image quality of all evaluated parameters was at least very good for TBH examinations and the ICCs were good. For FB examinations, stronger artifacts were found and ICC was moderate for contours of lung and vessels. However, the contours of lung and vessels, the perfusion signal of lung parenchyma, and the overall image quality was rated very good to excellent, even under FB conditions. In the first part of our study (Exam I), we quantitatively evaluated the perfusion of lung parenchyma and found an overall good agreement between FB and TBH measurements. The measured perfusion values of lung parenchyma are comparable to those reported in the literature: using the density value of the lung parenchyma of 0.28 g/mL,38 a comparable value of 461 ± 154 mL/min/100 g for pulmonary perfusion could be obtained for our average perfusion of 1.29 ± 0.43 mL/min/mL for the first slice. Slightly but significantly higher perfusion values were found under FB conditions. An explanation might be the higher level of oxygenation under free-breathing conditions, which may result in slightly higher perfusion values.39 The highest flow values were found in the first (most anterior) slice, with a decreasing trend towards the last slice, which is mainly caused by the pulsatile nature of pulmonary circulation, which was evaluated further in the second part of our study (Exam II). By using multiple PLDs, we found that the perfusion-related signal in large arteries, small arteries, and lung parenchyma was highly related to the specific cardiac cycle duration of the subjects. Immediately after the labeling in the first systole, a large amount of tagged blood was found in the large arteries, with a slow decrease of signal, while the peak in the small arteries and the lung parenchyma during the first diastole was found to be slightly delayed. The second systole led to an accelerated signal decrease in the large arteries (ie, a washout) and a pronounced increase of perfusion signal in the lung parenchyma. Therefore, if PCASL-bSSFP imaging is applied to measure parenchymal perfusion at a single PLD, perfusion images should be acquired in the second diastole after labeling. Our results show that—as a rule of thumb—the optimal PLD value may be obtained by using the TRR time of the subject (assuming a labeling duration, τ, of 300 msec). In contrast, for a high perfusion signal in the large pulmonary arteries, images should be acquired in the first diastole.
Dynamic contrast-enhanced MRI is a well-established technique to measure parenchymal lung perfusion using intravenous injection of contrast agent and, eg, spoiled gradient-echo MR sequences for imaging.7, 8, 40 Aside from the side effects of gadolinium-based contrast agents, such as depositions in the brain and nephrogenic systemic fibrosis, there are further limitations when it comes to evaluating the kinetics of the blood bolus ejected from the right ventricle to the lung circulation: The shape of the signal curve in the arteries and the lung parenchyma is influenced by the systemic circulation, the amount of contrast agent, and the injection rate. In PCASL, ECG-triggered labeling of the pulmonary trunk allows independent imaging the kinetics of the blood bolus ejected during systole to the pulmonary circulation. We chose a time interval of 200 msec between the different imaging trigger delays, which allows a relatively high temporal resolution as compared with contrast-enhanced techniques with an image update rate of about 1.0–1.5 seconds.
Slight variations in cardiac cycle duration might explain why the observed perfusion peak in the lung parenchyma is not as sharp as that described by Bolar et al.16 In order to achieve the highest possible temporal resolution, we acquired only one coronal slice to monitor the kinetics of pulmonary blood flow. The relatively long image acquisition time per slice (~230 msec) in bSSFP imaging hampers multislice imaging with a comparable temporal resolution. An accelerated image acquisition technique (eg, compressed sensing and/or simultaneous multislice) might enable simultaneous monitoring of blood flow kinetics in larger volumes of the lung.
It is demonstrated that PCASL-bSSFP sequences can provide useful perfusion images of the lung in patients with pulmonary embolism, even when applied under FB: in the three patients studied here perfusion defects in circumscribed regions were observed in good visual agreement with the involved areas seen in contrast-enhanced CT. The subjective image quality reading revealed a very good or excellent rating for most of the evaluated parameters and the delineation of the perfusion defects was also rated very good or excellent. This is noteworthy, since patients were up to 85 years old and—as compared to healthy volunteers—short of breath due to the underling pathology. The scan–rescan measurement in one patient (83 years old) also showed a convincing result.
Overall, the scan–rescan measurements in three volunteers showed a relatively good agreement both for lung perfusion values and for kinetics of blood transport in the lung. However, in one volunteer we found a significant discrepancy between the scan and rescan measurements under FB conditions, while the agreement under TBH was good. Visually, no obvious image artifact was seen, but we found a bias in all slices with lower perfusion values in the rescan measurement. A possible explanation for this observation might be an inefficient labeling of the pulmonary trunk, maybe due to displacements of the subject (the labeling plane was not moved between the FB and THB measurements). A higher number of repetitions and a larger cohort of subjects are required in order to reliably estimate the repeatability of PCASL-bSSFP perfusion imaging of the lung. However, in the subjective image quality reading, no significant difference was observed between the scan and rescan perfusion-weighted images.
Limitations
The highly pulsatile nature of the pulmonary circulation is challenging for the computation of the pulmonary perfusion for the following reasons: 1) The average absolute pulmonary perfusion per cardiac cycle, favg, was computed from fsys by approximating systolic duration, Tsys, to labeling duration τ (Eq. A2). While τ of 300 msec as approximately one-third TRR is suitable for the purposes of choosing Tsys, it is not exact enough to accurately calculate blood flow. Although this problem could be avoided by a more precise measurement of Tsys using flow quantification MRI, it would necessitate additional scans. 2) The S0b value of the blood in the aorta was used for calculation of pulmonary perfusion maps. The coil sensitivity profile was not measured and the coil inhomogeneity effect, although expected to be low, was not corrected.41 Nevertheless, the coil sensitivity profile might not be significantly influenced by the respiration pattern; therefore, the relative changes between TBH and FB measurements in the pulmonary perfusion distribution would not be affected. 3) Choosing the pulmonary trunk for blood labeling allowed a high labeling efficiency, but not all blood flowing towards the lung is labeled due to the relatively short labeling duration. The labeling duration should, in an optimal situation, be adapted to the individual systole for each subject. Moreover, the labeling plane position also leads to a labeling of the anterior basal parts of the lung, which can therefore not be examined by this method. To image perfusion of the entire lung, a further approach is to label the right and left pulmonary artery separately with a sagittal labeling plane.19 It should be noted that—in contrast to dynamic contrast-enhanced MRI—the perfusion of the entire lung cannot currently be imaged with PCASL in a single measurement. 4) To standardize the PCASL measurements in the first part of our study, the PLD value was set to 1000 msec for all volunteers, regardless of the individual cardiac cycle duration. This was a suitable choice in most volunteers with a TRR time of ~1000 msec. However, in subject 8 with a long TRR of ~1300 msec, a PLD of 1000 msec was clearly too short. Thus, the labeled blood reached the lung parenchyma at the acquisition time of the second slice. 5) Complete monitoring of the kinetics of the labeled blood using PCASL is limited by the duration of the labeling pulse train. Using τ of 300 msec and assuming a blood velocity of >50 cm/s in pulmonary arteries, almost all labeled blood has arrived in large and small pulmonary arteries before the start of imaging at the shortest PLD of 100 msec (TD = 400 msec). Measurements at earlier timepoints may be realized by shortening of the labeling duration, but at the expense of the amount of labeled blood. 6) A reduction of perfusion signal was observed in the more dorsally located slices in the lung. This finding is expected to be mainly caused by the pulsatile nature of pulmonary circulation, resulting in a decrease of perfusion signal in the later (with longer delay to the R wave in the ECG) acquired slices. In our case, these slices were situated in the posterior parts of the lung. Faster imaging techniques, eg, compressed sensing and/or simultaneous multislice, could help to reduce this effect by shortening the image acquisition time. Measurements at 3T could also be advantageous for the ASL signal (due to longer T1 values of the blood) in more distal parts of the lungs, which are reached after longer time delays.
Besides technical points, there are further limitations in the study design such as the small number of patients, subjects, and scan–rescan measurements as well as the lack of a reference standard. Further studies with larger cohorts of healthy volunteers and patients are needed to assess the value of this approach for clinical application.
Conclusion
ECG-triggered PCASL-bSSFP imaging of the lung at 1.5T might be able to provide very good image quality and quantitative perfusion maps within ~5 minutes of acquisition even under free-breathing conditions. The course of labeled blood through pulmonary arteries and parenchyma can be monitored and the spatial distribution shows a strong dependence on the individual cardiac cycle duration. These findings, together with promising results from scan–rescan measurements and the successful application in patients, encourage the further use of PCASL-bSSFP imaging in clinical studies.
APPENDIX
Quantification of Pulmonary Blood Flow from PCASL Data
 (A1)
(A1)where, Sctrl and Slab are signal intensities in control and label images, respectively, S0b is the signal intensity of blood in a PDw image, T1b is the longitudinal relaxation of blood, α is the labeling efficiency, and τ is the labeling duration. In our study a T1b value of 1.48 sec and α value of 0.95 was used.22, 33
 (A2)
(A2)where TRR is the cardiac cycle duration. To compute the systolic flow from Eq. (A1), the signal intensity of the blood S0b in a PDw image is required. An estimation of S0b based on a direct measurement of the blood signal in the PDw bSSFP image at the start of the PCASL sequence might be imprecise due to possible inflow effects. Therefore, a flow-compensated PDw FLASH image (TR, 10 msec; TE, 5.6 msec; flip angle, 7°; voxel size, 1.9 × 1.9 × 10 mm3) was acquired at the same slice positions as the ASL imaging. Assuming the liver parenchyma as an organ without inflow effects, the ratio of the signal intensity of blood, S0bFLASH, and liver, S0LiverFLASH, in the flow-compensated PDw FLASH image are expected to be the same as in the PDw bSSFP images (S0b and S0Liver, respectively). Thus, S0b in a PDw bSSFP image could be computed as follows: S0b = S0Liver (S0bFLASH/S0LiverFLASH).


