Quantifying response to intracranial pressure normalization in idiopathic intracranial hypertension via dynamic neuroimaging
Abstract
Background
Idiopathic intracranial hypertension (IIH) is characterized by elevated intracranial pressure without a clear cause.
Purpose
To investigate dynamic imaging findings in IIH and their relation to mechanisms underlying intracranial pressure normalization.
Study Type
Prospective.
Population
Eighteen IIH patients and 30 healthy controls.
Field Strength/Sequence
T1-weighted, venography, fluid attenuation inversion recovery, and apparent diffusion coefficients were acquired on 1.5T scanner.
Assessment
The dural sinus was measured before and after lumbar puncture (LP). The degree of sinus occlusion was evaluated, based on 95% confidence intervals of controls. We studied a number of neuroimaging biomarkers associated with IIH (sinus occlusion; optic nerve; distribution of cerebrospinal fluid into the subarachnoid space, sulci and lateral ventricles (LVs); Meckel's caves; arachnoid granulation; pituitary and choroid plexus), before and after LP, using a set of specially developed quantification techniques.
Statistical Tests
Relationships among various biomarkers were investigated (Pearson correlation coefficient) and linked to long-term disease outcomes (logistic regression). The t-test and the Wilcoxon rank test were used to compare between controls and before and after LP data.
Results
As a result of LP, the following were found to be in good accordance with the opening pressure: relative compression of cerebrospinal fluid (R = –0.857, P < 0.001) and brain volumes (R = –0.576, P = 0.012), LV expansion (R = 0.772, P < 0.001) and venous volume (R = 0.696, P = 0.001), enlargement of the pituitary (R = 0.640, P = 0.023), and shrinkage of subarachnoid space (R = –0.887, P < 0.001). The only parameter that had an impact on long-term prognosis was cross-sectional size of supplemental drainage veins after LP (sensitivity of 92%, specificity of 20%, and area under the curve of 0.845, P < 0.001).
Data Conclusion
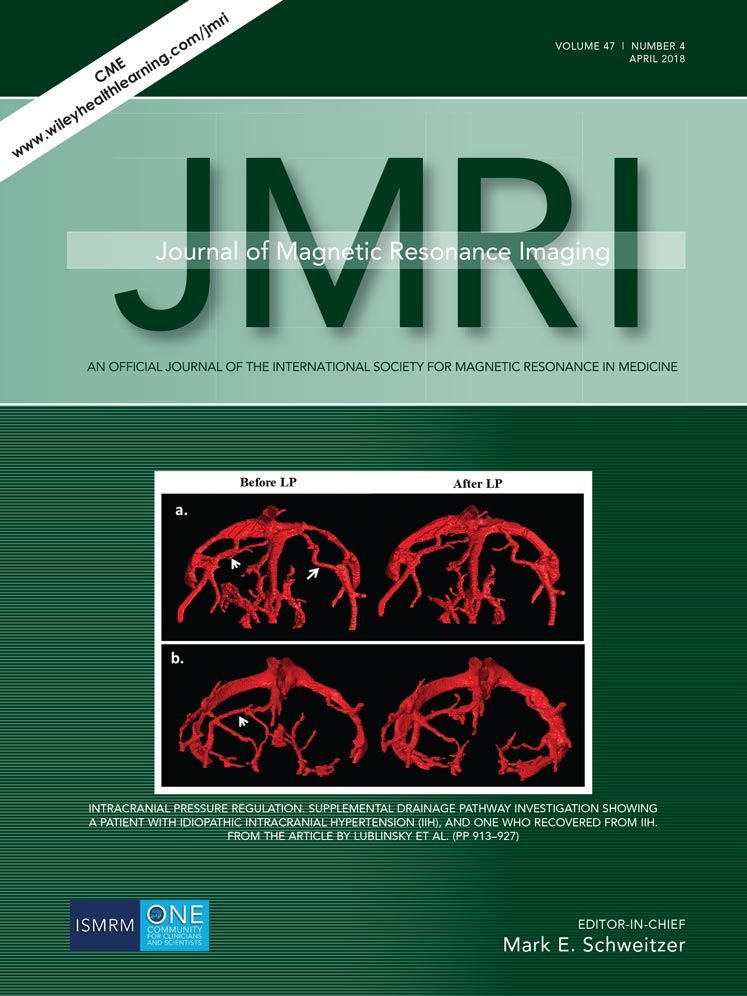
We present an approach for quantitative characterization of the intracranial venous system and its implementation as a diagnostic assistance tool. We conclude that formation of supplementary drainage veins might serve as a long-lasting compensatory mechanism.
Level of Evidence: 2
Technical Efficacy: Stage 3
J. Magn. Reson. Imaging 2018;47:913–927.