GC-MS analysis of ethyl carbamate in distilled sugar cane spirits from the northern and southern regions of Minas Gerais
Abstract
Ethyl carbamate, also known as urethane, is the ethyl ester of carbamic acid. Animal studies with this compound have demonstrated its carcinogenic potential. In this study, gas chromatography coupled to mass spectrometry (GC-MS) was applied for the determination of ethyl carbamate in sugar cane spirits in the northern and southern regions of the state of Minas Gerais in Brazil. The samples were collected from distillates from small- and medium-scale stills. The concentrations determined for ethyl carbamate in the samples ranged from 23 to 980 µg L−1. All of the samples analysed from the southern region of Minas Gerais had an ethyl carbamate content below the limit set by the Brazilian legislation for ethyl carbamate of 150 µg L−1, while a number of samples from northern Minas Gerais exceeded this limit. No correlations were observed between the levels of ethyl carbamate and the alcohol content, acidity or copper concentrations in the samples. Copyright © 2014 The Institute of Brewing & Distilling
Introduction
Ethyl carbamate (EC), known as urethane, is found in fermented foods, such as bread, yogurt, wine and beer, and in distilled spirits such as whisky, sugar cane spirits, rum, vodka, grappa and tiquira 1, 2. The Ministry of Agriculture, Livestock and Supply, the organ that determines the standards and official methods for analysis of substances present in distilled sugar cane beverage, sets a limit of 150 µg L−1 for EC 3.
The literature describes several techniques for the analysis of EC in alcoholic beverages. Gas chromatography coupled to mass spectrometry using capillary columns and selective detection systems is the most common technique 4. The mass detectors have several advantages over other detectors such as fluorescence detectors, because they present a high selectivity and sensibility, in addition to specific mass information about eluted compounds. This advantage makes the identification of most important compounds possible, especially when the selective ion monitoring mode is utilized 5, 6.
There are several possible pathways for the formation of EC in distilled beverages, generally involving the reaction between ethanol and nitrogen precursors such as urea, carbamyl phosphate and cyanide. Cyanide is considered to be a precursor of EC during and after the distillation process 1, 5, 7.
This study aimed to analyse the EC in distilled sugar cane spirits produced in the northern (NM) and southern (SM) regions of the state of Minas Gerais by GC-MS. Furthermore, the correlations of EC with the acidity, alcohol and copper concentrations of the spirit were investigated.
Materials and methods
Sample collection
Seventy-one samples of distilled sugar cane beverage were randomly collected in the northern and southern regions of the state of Minas Gerais. They were obtained directly from small and medium-size stills, 33 being from the northern region and 38 from the southern region. Of these, 63 samples were distilled in copper alambics, three in stainless steel stills and five in stills constructed of half copper and half stainless steel (nave and coil). The still types and numbers of samples are described in Table 1.
| Type of alambic (distillation equipment) | Number of samples |
|---|---|
| Copper alambic with a head and a coil with plates (ALP) | 47 |
| Simple copper alambic with a copper coil (ALS) | 11 |
| Cowl-type copper still with no coil (ALCSS) | 5 |
| Stainless steel stills having a coil with plates (ALPI) | 3 |
| Simple stainless steel still with a copper coil (ALISC) | 2 |
| Simple copper still with a stainless steel coil (ALSSI) | 1 |
| Cowl-type copper still with a stainless steel coil (ALCSI) | 1 |
| Cowl-type copper still with a copper coil (ALCSC) | 1 |
Reagents and standard
All of the reagents used were of analytical grade. Ethyl carbamate was obtained from Acros Organics, ethanol was obtained from Merck, and the water used was purified using a Milli-Q (Millipore) system.
Qualitative and quantitative analysis
The physical–chemical analyses were performed according to the official methods of analyses for distilled sugar cane spirits 8. The alcohol content was determined by densitometry, and the result was expressed in percentage volume. The samples were redistilled, and the alcohol content was obtained from measurements at 20°C using a Mat Gibertini digital densimeter (Milan Italy).
The volatile acidity was determined by volumetric titration with base. The acids were steam distilled from the beverage using an Enochimico Gibertini electronic distiller (Milan, Italy). The distillates were titrated with 0.10 mol L−1 sodium hydroxide. The results obtained were expressed in mg 100 mL−1 of acetic acid in anhydrous alcohol.
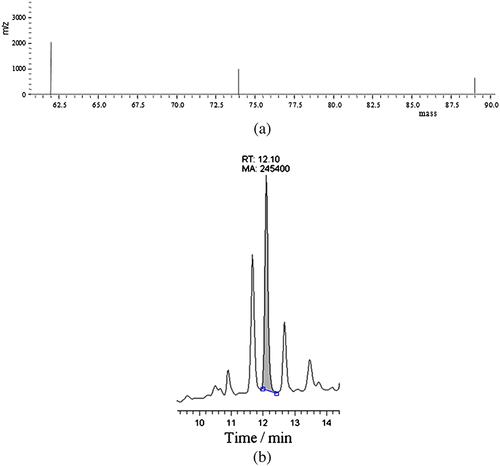
The copper content was determined by absorption spectrometry at 324.80 nm using the Varian model 17A spectrometer equipped with a 4 mA intensity hollow cathode lamp and an air–acetylene flame. The standard solutions (0–10 mg L−1) were prepared from the stock copper solution (1000 mg L−1 in water). The calibration curves were obtained by linear regression (y = 0.044x + 0.003) of a plot of absorption vs concentration. The correlation coefficient was 0.9998. For the analysis of samples, 50 mL sugar cane spirit was heated in a water bath until the volume of 10 mL in a volumetric flask, then diluted to 50 mL using doubly distilled water. The EC was analysed by gas chromatography combined with mass spectrometry (CG-MS) using a Shimadzu GC 17-A chromatograph equipped with a Shimadzu QP-5050A mass detector, operating in the electron impact mode at 70 eV with selective íon monitoring (m/z 62). The mass spectra of the EC and the chromatogram of a sample of distilled sugar cane spirits are presented in Fig. 1(a) and (b), respectively. The capillary chromatographic column (60 m × 0.25 mm × 0.50 µm film thickness) had a DBWAX (esterified polyethylene glycol) polar stationary phase. The temperature of the injector and the detector interface was 220°C, the initial column temperature was 90°C (2 min), followed by an increase of 10°C min−1 to 150°C; then it was increased at 40°C min−1 to 220°C. The volume injected (automatic injection) was 2 μL of the sample without prior treatment with a split ratio of 1:10. Helium was the carrier gas with a flow rate of 1.5 mL min−1.
The standard solutions of EC were prepared (50–750 µg L−1) in 40% ethanol from the stock solution (1000 µg L−1 in 40% ethanol) in an attempt to reproduce the alcoholic conditions of the samples, whose medium was 41.66% v/v ethanol. The calibration curves were obtained by linear regression (y = 973309.04x + 2955.02) of a plot of the peak areas vs concentration. The correlation coefficient was 0.9996. The limits of detection (LOD) and quantification (LOQ) were estimated by means of the parameters for the analytical curves, calculated by the respective mathematical relationships: LOD = 3.3 SD/m and LOQ = 10 SD/m (where SD = estimate of the standard deviation from the regression line and m = the slope of the calibration line) 9. The calculated LOD and LOQ were 0.01 and 0.05 µg L−1, respectively.
Statistical analysis
All of the analyses were performed in triplicate. The results obtained were grouped per region of origin and production process and submitted to analysis of variance using the Sisvar® software, comparing them through the Shott–Knott test at a 0.05 confidence level and descriptive analysis 10.
Results and discussion
Comparison of EC and copper concentrations between northern and southern regions of the state of Minas Gerais
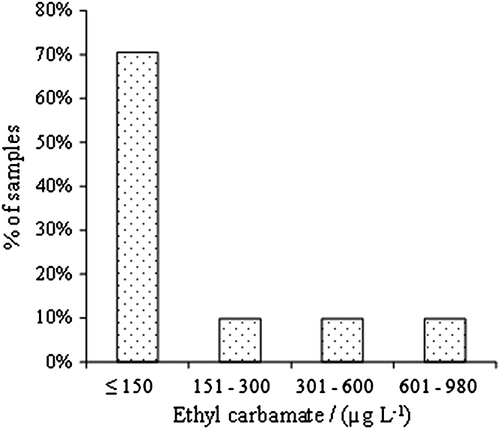
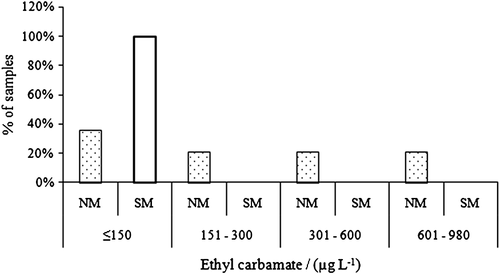
According to the values presented in Fig. 2, the EC concentrations for the samples presented variations amongst the samples and the sample groups. Fifty samples (70.43%) presented concentrations equal to or below the maximum legal limit (150.00 µg L−1). According to the descriptive statistical analysis, the EC concentrations varied from 22.60 to 980 µg L−1, with a mean of 191.19 µg L−1. Of the 33 samples from the northern region, only 12 (36.36%) distilled sugar cane beverages had an EC level equal to or below the maximum legal limit. All the samples from the southern region presented concentrations below this limit (Fig. 3).
The means of the results for EC, volatile acidity, copper and alcohol concentrations of the samples from the southern and northern regions of Minas Gerais are presented in Table 2.
| Region | EC (µg L−1) | Volatile acidity (mg 100 mL−1 of ethanol) | Copper (mg L−1 of ethanol) | Alcohol concentration (% v/v of ethanol) |
|---|---|---|---|---|
| SM | 53.34a | 89.96a | 4.64b | 39.80a |
| NM | 350.60b | 79.12a | 3.01a | 43.82b |
- Means in the same column followed by different letters differ by the Scott–Knott test at 0.05%.
The mean concentration observed for EC was higher in the samples from the northern region, some being much higher than the maximum legal limit (150 µg L−1); the opposite occurred for the mean concentration of the samples produced in the southern region of Minas Gerais. Andrade-Sobrinho et al. 11 in 2002, researching this contaminant in several samples of distilled sugar cane spirits from Minas, they encountered mean contents of approximately 1000 µg L−1, while Barcelos et al. 12 found mean values of 243 µg L−1 for distilled sugar cane from the southern region, Zona da Mata and the Vale do Jequitinhonha of Minas Gerais in 2007.
Labanca et al. 13, in a similar study in 2008, observed mean contents of 893 µg L−1 for distilled sugar cane spirits produced or bottled in Minas Gerais. In this work, the mean content found was 191 µg L−1. Thus, a greater degree of control of the production process has been exerted with respect to the contamination by EC.
Ethyl carbamate is more soluble in ethanol than in water and is mainly found in the head fraction. The median values for EC concentrations were 65, 26 and 24 µg L−1 for the head, heart and tail fractions, respectively. The results suggest that a tuning in the first cut could be used to reduce the concentration of this unwanted compound in the heart fraction 14.
The mean copper content was higher in the distilled sugar cane spirits produced in the south of Minas Gerais, although these beverages presented lower values for EC. This result was the opposite of that obtained for the distilled sugar cane from the north of Minas Gerais. These results indicate that there was no correlation between the copper and EC concentrations in the beverage, especially after bottling. These data are in accord with those of Labanca et al. 13, who observed no significant correlations at a level of 5% among the pH and the EC, alcohol and copper content. Barcelos et al. 12 encountered higher EC concentrations in distilled sugar cane beverages having a lower copper content.
The distilled sugar cane beverages from the NM region presented a mean alcohol content of 43.82%, with a variation from 35.38 to 52.21% in ethanol concentration at 20°C. The beverages from the SM region had a mean ethanol content of 39.82%, with concentrations varying from 32.62 to 48.28% at 20°C. Of the samples from the SM, 23.68% presented ethanol contents below the minimum limit established by the Brazilian legislation (38–54% v/v), while 3.03% from the NM contained ethanol concentrations below the minimum limit.
The mean content for volatile acidity (as acetic acid) was 79.12 mg 100 mL−1 of ethanol for the samples from the NM and 89.96 mg 100 mL−1 of ethanol for those from the SM region. Of the total, 9.85% of the samples presented a content over the maximum legal limit of 150 mg 100 mL−1 of ethanol.
Influence of the type of still on the EC concentration in the beverage
The samples of sugar cane beverages distilled in simple stills (ALS) had the lowest EC contents, with a minimum of 25.10 µg L−1 and a maximum of 63 µg L−1. For the 47 samples distilled in copper stills containing plates in the head (ALP), 70.21% of the EC contents were below the limit of 150 µg L−1, with a variation from 30.90 to 980 µg L−1. For the five samples from the cowl or elephant's trunk type of still (ALCSS) (stills characterized by distillation with a low temperature and flow rate), four were within the limits, with concentrations lower than 150 µg L−1, and only one sample presented a value of 360 µg L−1. In Fig. 4, the mean EC and copper concentrations in distilled sugar cane beverages were compared with respect to the type of still in which they were distilled.
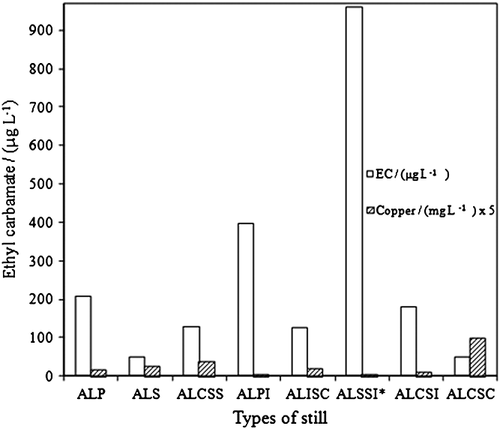
As can be seen, it is possible to produce distilled sugar cane spirits with acceptable levels of EC in different types of stills; however, for some authors, the high content of this contaminant can be directly influenced by the distillation process. Bruno et al. 15 observed a high probability of formation of EC in distilled sugar cane beverages that depended on the configuration of the distillation system and the distillation process. For these workers, the formation of EC was favoured by the nitrogen precursors during the distillation and by the high temperatures resulting from poor distillation, that is, systems with an improper design or operating with excessive reflux rates. Andrade-Sobrinho et al. 11 encountered a higher mean EC concentration in sugar cane beverages obtained from several Brazilian states and distilled through columns, with mean contents of 630 µg L−1 (alambic) and 930 µg L−1 (column).
There was no correlation between the EC and the copper concentrations in the samples of distilled sugar cane beverages. Riffkin et al. 16 observed that 20% of the EC in recently distilled spirits was produced during the first hour of reaction. In a similar work, Bruno et al. 17 observed reductions in the levels of EC from 272 to 50 µg L−1 (around 80%) after treating samples of distilled sugar cane beverages with a selective resin within an hour after distillation. It was observed that approximately 0.80 mg L−1 of copper was sufficient to catalyse the complete formation of EC, and it did not cause any additional catalytic effects at higher concentrations.
Conclusions
The EC concentrations in samples of distilled sugar cane spirits produced in the northern and southern regions of the state of Minas Gerais varied from 22.60 to 980 µg L−1, and 63.63% of the samples analysed from the north of Minas Gerais had concentrations above the limit of 150 µg L−1. On the other hand, all of the samples analysed from the southern region had an EC content below this limit. A significant correlation between the concentrations of EC and copper in the samples analysed was not observed. Also, no influence of the type of still on the formation of EC was observed.
Acknowledgements
The authors are grateful for the financial support and fellowship provided by the foundations Conselho Nacional de Desenvolvimento Científico e Tecnológico, Coordenação de Aperfeiçoamento de Pessoal de Nível Superior (CAPES – PIQDTEC and PVNS programs), and the Fundação de Amparo e Pesquisa do Estado de Minas Gerais. The authors also acknowledge the producers for providing the samples, the Departments of Chemistry and Food Science at Federal University of Lavras, and the Federal Institute of Mato Grosso for the support with the chemical analyses.


