Live-cell imaging reveals redox metabolic reprogramming during zygotic genome activation
Hao Sun, Zhuo Zhang, and Tianda Li contributed equally to this study.
Abstract
Metabolic programming is deeply intertwined with early embryonic development including zygotic genome activation (ZGA), the polarization of zygotic cells, and cell fate commitment. It is crucial to establish a noninvasive imaging technology that spatiotemporally illuminates the cellular metabolism pathways in embryos to track developmental metabolism in situ. In this study, we used two high-quality genetically encoded fluorescent biosensors, SoNar for NADH/NAD+ and iNap1 for NADPH, to characterize the dynamic regulation of energy metabolism and redox homeostasis during early zygotic cleavage. Our imaging results showed that NADH/NAD+ levels decreased from the early to the late two-cell stage, whereas the levels of the reducing equivalent NADPH increased. Mechanistically, transcriptome profiling suggested that during the two-cell stage, zygotic cells downregulated the expression of genes involved in glucose uptake and glycolysis, and upregulated the expression of genes for pyruvate metabolism in mitochondria and oxidative phosphorylation, with a decline in the expression of two peroxiredoxin genes, Prdx1 and Prdx2. Collectively, with the establishment of in situ metabolic monitoring technology, our study revealed the programming of redox metabolism during ZGA.
1 INTRODUCTION
Metabolic activity plays a vital role in preimplantation embryonic development (Brinster, 1967a, b; Leese, 2012; Sharpley et al., 2021). Mouse embryos rarely develop beyond the two-cell stage if only pyruvate is used as a nutrient (Brown & Whittingham, 1991; Lane & Gardner, 2005; Nagaraj et al., 2017). Energy derived from oxidation of glucose is limited before the morula stage (Barbehenn et al., 1978; Brinster, 1969). A study on nutrient prerequisites during early embryonic development, which revealed that early embryos use pyruvate and then glucose, has made the transformation process feasible and promoted further optimization of the in vitro culture system and its application in clinically assisted reproduction (Chronopoulou & Harper, 2015; Conaghan et al., 1993; Gardner, 1998; Gardner & Lane, 1997).
However, many of the metabolic processes that occur during early embryonic development remain unknown. Several methods have been developed for studying the metabolism of early embryos to address this problem. Biochemical methods based on enzyme cycling and physical methods based on mass spectrometry and chromatography are the mainstream means of embryonic metabolite detection (Chen et al., 2016; Sharpley et al., 2021; Zhao et al., 2021). An important issue with these methods is that they usually require embryo lysis to harvest the metabolome, which makes real-time tracking of development difficult (Bustamante et al., 2017; Jang et al., 2018; Zerez et al., 1987). Moreover, these methods often require a relatively large number of embryos, which is not only labor-intensive but also masks the heterogeneity of embryonic development. Thus, the technical means to develop a new metabolic model with small sample size is indispensable.
Two pyridine dinucleotide redox systems, which are the core coenzyme I (NAD+ and NADH) and the core coenzyme II (NADP+ and NADPH), play vital roles in the redox reactions of cellular metabolism and in maintaining the redox homeostasis of mammalian cells (Ying, 2008). Coenzyme I plays a central role in energy metabolism, and the ratio of NADH/NAD+ is an important biochemical index of the redox state of cells. Coenzyme II is primarily involved in anabolic reactions and antioxidant defense mechanisms, with NADPH as the fundamental reducing power. In previous studies, we developed a series of biosensors to detect the dynamic activities of these metabolites (Tao et al., 2017; Zhao et al., 2011, 2015, 2016; Zou et al., 2018, 2020), including the NADH/NAD+ sensor SoNar and the NADPH sensor iNap family, and dissected their functions in hematopoiesis, tumors, aging, and other physiological and pathological conditions (Chen et al., 2021; Gu et al., 2020; Hao et al., 2019; Li et al., 2023; Ma et al., 2021).
In this study, we evaluated the safety and efficiency of fluorescent biosensors for early embryo research both in vivo and in vitro. We then traced the dynamic changes in NADH/NAD+ and NADPH at zygotic genome activation (ZGA) and found opposite patterns of these molecules from the embryo to the two-cell stage. Finally, we performed transcriptome profiling to analyze the genes coordinating NADH and NADPH metabolic changes during ZGA.
2 MATERIALS AND METHODS
2.1 Experimental model and subject details
All experimental procedures were performed in accordance with the Guidelines for the Use of Animals in Research issued by the Institute of Zoology of the Chinese Academy of Sciences. CD-1 (Stock No. 201) background mice were purchased from the Beijing Vital River Laboratory. They were maintained on a 12-h light and 12-h dark cycle. CD-1 background mice were used to generate fertilized embryos and pseudopregnant surrogates.
2.2 Zygote collection
CD-1 female mice (6–8 weeks old) were superovulated by consecutive injections of 7.5 IU pregnant mare serum gonadotropin and 7.5 IU human chorionic gonadotropin (hCG) (Ningbo Second Hormone Factory). All superovulated female mice were mated with CD-1 male mice (8 weeks old) overnight after hCG injection. Zygotes were collected from the oviduct 18 h after the hCG injection. The derived zygotes were washed with HEPES-CZB and cultured in M16 medium (Sigma), as previously reported (Dai et al., 2009). All zygotes were released with hyaluronidase (ICN Pharmaceuticals) to remove the cumulus cells. Before micromanipulation, the zygotes were cultured in M16 medium at 37°C, 5% CO2.
2.3 In vitro culture of mouse embryos
For culturing embryos, all zygotes were identified based on the size and the conformation of their pronuclei and cultured in a 50 μL drop of M16 medium (Sigma) in mineral oil (Sigma) at 37°C, 5% CO2, and 100% humidity. Embryos at different stages of preimplantation development were collected at defined time points after the injection of hCG: late one-cell stage (phCG 30 h), late two-cell stage (phCG 48 h), late four-cell stage (phCG 62 h), late eight-cell stage (phCG 74 h), morula stage (phCG 80 h), and late blastocyst stage (phCG 114 h).
2.4 Microinjection of sensor mRNAs
The sensor mRNAs microinjection procedure was modified from a reported protocol (Li et al., 2018). All the sensor mRNAs were provided by the Optogenetics and Synthetic Biology Interdisciplinary Research Center at the State Key Laboratory of Bioreactor Engineering, East China University of Science and Technology (Tao et al., 2017; Zhao et al., 2015). Zygotes were selected as receptors before the PN3 stage. 400 ng/μL sensor mRNA was injected into the cytoplasm of the zygote using an Eppendorf microinjector and micromanipulators. Injected embryos were washed and cultured in M16 (Sigma) at 37°C, 5% CO2, and 100% humidity. Generally, 6–8 h would be needed for the expression and maturation of SoNar and iNap sensors. Sensor-expressing embryos were collected at specific time points for imaging.
2.5 Fluorescence microscopy imaging of mouse embryos
For imaging, mouse embryos were plated in a 96-well glass-bottom plate (In Vitro Scientific). Images were acquired using a Leica DMi8 confocal laser microscope system in Figure 1. Images were acquired using a Yokogawa CSU-W1 SoRa spinning disk confocal microscope attached to an inverted Nikon (TI-E) microscope, a PL APO VC ×40/1.25-NA water objective, and a photometric Prime 95 B sCMOS camera using 405-nm laser excitation and 488-nm excitation in Figure 2. Before imaging process, 100 μL M16 or KSOM medium and 20 μL mineral oil were incubated in plates for 1 h at 37°C, 5% CO2, and 100% humidity. Embryos were transferred to the medium using a micropipette. The Z-axis interval between scans is 2 μm. Each embryo was scanned for approximately 50–70 layers. Fluorescent images of embryos were used to pseudo-color the images in the HSB color space as previously described (Zhao et al., 2015).
2.6 Real-time dynamic imaging of living mouse embryos
The embryos used for real-time dynamic imaging were cultured in 96-well flat-bottomed plates (Corning). Imaging and culturing were accomplished using a Lionheart FX live-cell imaging analysis system equipped with a 400-nm and 469-nm LED light source, in addition to an environment control cover, including a CO2 controller and humidity chamber. An Olympus Plan Fluorite 10 mm 0.3 NA objective was used. For dual-excitation ratio imaging, 400-BP 40-nm or 469-BP 35-nm band-pass excitation filters and a 550-BP 49-nm or 525-BP 39-nm emission filter fixed by a filter cube were used. Gen5™ 3.0 Imaging Prime software was used to automatically capture the images. The culture condition was 37°C, 5% CO2, and 100% humidity. The imaging interval was 1 h.
2.7 Image processing and analysis
Images captured by DMi8 do not require color depth adjustment. Raw data acquired from the Yokogawa CSU-W1 SoRa microscope and Lionheart FX were exported to ImageJ software as 8-bit TIF for analysis. Ratio data was calculated as previously published (Zou et al., 2018).
2.8 Embryo transfer
Microinjected embryos in the blastocyst stage were transferred into the uterus of E2.5 pseudopregnant CD-1 surrogate mothers. Pregnant recipients were euthanized at E19.5, and all full-term pups were gestated with CD-1 surrogate mothers.
2.9 RNA-Seq library preparation and data analysis
Two-cell embryos used for RNA-seq were collected at two-time points. Three hours after the PN5 stage was identified as the early stage; 21 h after the PN5 stage was identified as the late stage. Each sample consisted of five biological replicates. Embryos were collected in 0.2 mL Smartseq. 2 tubes with a micropipette. Sequencing was performed on an Illumina HiSeq. 4000 sequencer with a 150 bp paired-end sequencing reaction accomplished by Geek Gene. RNA-seq data analysis was performed with HISAT2 (version 2.1.0) and Cufflinks (version 2.2.1) using UCSC mm10 annotation with default settings, as previously published (Wang et al., 2020). We searched for links between highly expressed metabolic genes in early two-cell embryos and late two-cell embryos using STRING (https://string-db.org/cgi/input.pl).
2.10 Quantification and statistical analysis
Statistical analyses were performed using R. Levels of significance were calculated using a two-tailed Student's t-test. Three or more groups were analyzed using ANOVA. In all analyses, values of p < 0.05 were considered statistically significant (*p < 0.05, **p < 0.01, ***p < 0.001, and ****p < 0.0001). The statistical parameters have been listed in the figures and figure legends. Statistical analyses were performed with GraphPad Prism (version 8.0) software.
3 RESULTS
3.1 Microinjection of metabolic sensors does not influence mouse embryo development
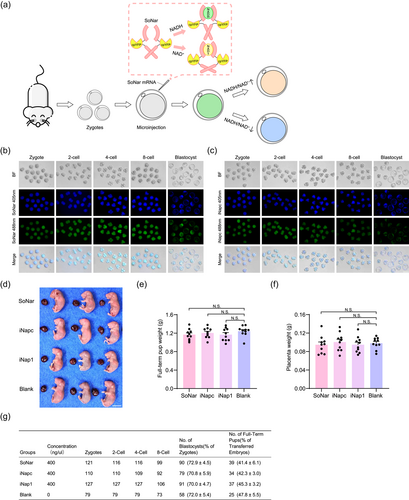
The levels of NADH/NAD+ and NADPH play important roles in somatic cells and embryos (Sharpley et al., 2021). SoNar and iNap1 were designed to detect NADH/NAD+ and NADPH levels, respectively (Tao et al., 2017; Zhao et al., 2015). We injected mRNA encoding the fluorescence sensors for NADH (SoNar), NADPH (iNap1), and the control (iNapc) into the zygote to confirm the influence of the sensors on mouse embryo development (Figure 1a and Supporting Information: Figure S1a). Fluorescence results indicated that the injected mRNA was translated, and the sensors could be detected at the expected excitation wavelength (Figure 1b,c; Supporting Information: Figure S1b,S1c). Meanwhile, the fluorescent intensity gradually decreased as cell division progressed but remained at an observable level until the blastocyst stage.
Next, the embryos injected with the sensors were transplanted into the uterus at the E2.5 stage or cultured in vitro. Live pups were recovered from embryos with different sensor injections at E19.5 after cesarean section (Figure 1d). No significant differences were detected in fetal or placental weights between the fluorescence sensor injection and control groups (Figure 1e,f).
In addition to the full-term offspring, we also checked the developmental efficiency in vitro and birth ratio in vivo of embryos injected with different sensors (Figure 1g). There were no differences in blastocyst development efficiency or birth ratio in vivo among the four groups. In summary, we constructed a metabolic detection system for early embryo development using fluorescence sensor injection and demonstrated that sensor injection did not influence the developmental efficiency of embryos, both in vivo and in vitro. It is also the first time to produce full-term offspring for embryos with metabolic sensor injection.
3.2 Fluorescence sensors report the metabolic dynamic changes of early embryos
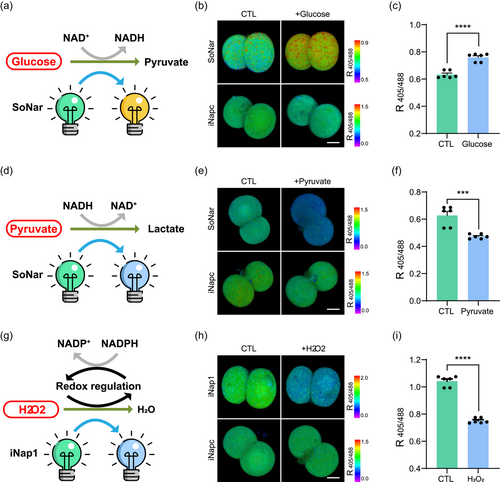
After confirming the safety of the fluorescent biosensors, we verified their reliability in detecting metabolic changes during early mouse embryo development. Glucose is important for embryonic development and lineage differentiation (Zhao et al., 2021). During glycolysis, NAD+ is reduced to NADH catalyzed by glyceraldehyde-3-phosphate dehydrogenase (Figure 2a). The NADH/NAD+ in two-cell embryos increased dramatically after the addition of glucose to the culture medium. We precisely captured this ratio change using SoNar, a fluorescence sensor for detecting the NADH/NAD+ ratio, when excited at 405 and 488 nm (Figure 2b,c and Supporting Information: Figure S2a). Conversely, when pyruvate, another important metabolite, was added to the culture medium, the fluorescent state changes in SoNar tracked the expected reduction in the NADH/NAD+ ratio (Figure 2d–f and Supporting Information: Figure S2b). As a control, iNapc, a pH sensor, was not detected with distinct fluorescent changes (Figure 2b,e and Supporting Information: Figure S2d-e,S2g–h). Next, we used H2O2 to simulate oxidative stress in embryos. As expected, downregulated levels of the coenzyme factor NADPH were detected using the iNap1 sensor, which was also excited at 405 and 488 nm (Figure 2g–i and Supporting Information: Figure S2c,S2f,S2i). Taken together, we validated the sensor efficiency to reflect the levels of metabolites, and the results indicated that the sensor could be used for metabolic monitoring of live embryos at single-cell resolution.
3.3 Tracing dynamic of NADH/NAD+ and NADPH levels in ZGA stage
After demonstrating the safety and reliability of the fluorescent biosensors for metabolic monitoring during early embryo development, we applied the system to the ZGA process, which is the first major developmental transition in vertebrate embryos. With these single-cell and live-cell-based biosensors, we designed a continuous imaging system for mouse embryos from the zygote PN5 stage to the four-cell stage at 1 h intervals using sensors for NADH/NAD+ and NADPH detection (Figure 3a–c; Supporting Information: Figure S3a–S3f). The results showed that the embryos developed normally with different sensor injections under continuous imaging conditions. Furthermore, we recorded the blastomere division process using these live cell-based biosensors (Figure 3d). Interestingly, compared to maintaining a stable pH, which was detected by iNapc, the ratio of NADH/NAD+ showed a continuing downward trend, as measured by SoNar, from approximately 0.5–0.42, with a change range of approximately 15% (Figure 3e,f; Supporting Information: Figure S4a,S4b,S4c,S4d).
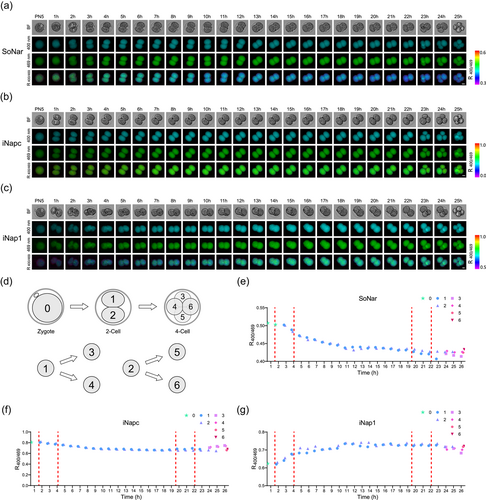
Another key coenzyme, NADPH, is involved in reductive biosynthesis and has antioxidant functions (Farr & Kogoma, 1991; Juhnke et al., 1996; Pomposiello et al., 2001). We then used the same imaging system to track NADPH dynamics in ZGA using the iNap1 sensor (Figure 3c; Supporting Information: Figure S3e,S3f). Contrary to the changes at the NADH/NAD+ level, the NADPH level increased with the iNap1′s ratio R405/488 by approximately 13% from approximately 0.62 to approximately 0.7 (Figure 3g; Supporting Information: Figure S4e,S4f). These results indicated the accumulation of NADPH during the two-cell cycle. Unlike SoNar, we found some differences in NADPH levels between blastomeres detected at the early two-cell stage. We suspected that NADPH levels may participate in cell fate-determined events at the two-cell stage (Zhang et al., 2018; Zhao et al., 2021). Thus, we detected dynamic changes in two core coenzymes, NADH/NAD+ and NADPH, at the ZGA in a single blastomere and at the live-cell level for the first time. And we found they showed the opposite patterns during the embryo to two-cell stage.
3.4 Expression analysis of genes coordinating with NADH and NADPH metabolism, as determined using transcriptome profiling
To explore the mechanism underlying the metabolic alteration, we conducted transcriptome analysis of the early and late two-cell stage embryos (Figure 3g). We then examined 2872 metabolism-associated genes, including NADH and NADPH metabolic enzymes (Birsoy et al., 2015), and identified genes with differential expression between the early and late two-cell stage. Seventy-one metabolic genes were expressed in both the early and late stages of the two cell lines and were significantly higher in the early stage (Supporting Information: Figure S5a). In addition, the expression of 75 genes that was visibly downregulated in the early mouse two-cell embryos were selected (Supporting Information: Figure S5b). Next, we focused on the genes involved in NADH and NADPH metabolism (Birsoy et al., 2015) (Figure 4a,b). Among them, SLC2A1, which encodes one of the major glucose transporters, decreased in expression with cell cycle progression from the early to the late stage (Figure 4c). A few genes encoding glycolytic enzymes, including the NADH-generating enzyme GAPDH and the NAD+-recycling enzyme lactate dehydrogenase (LDH), also showed a significant decline in expression, particularly a more than 40-fold decrease in LDHB (Figure 4c). In contrast, genes involved in pyruvate metabolism, including those involved in mitochondrial transport and oxidation, were upregulated (Figure 4d). Meanwhile, many oxidative phosphorylation genes encoded by both nuclear and mitochondrial genomes showed an increase in expression; cytochrome c oxidase cox7c expression increased more than 140-fold (Figure 4e). Taken together, this expression pattern alteration implies that cells heavily depend on glycolysis for energy production at the early two-cell stage and then switch to an efficient mitochondrial ATP-synthesis mechanism (Figure 4g).
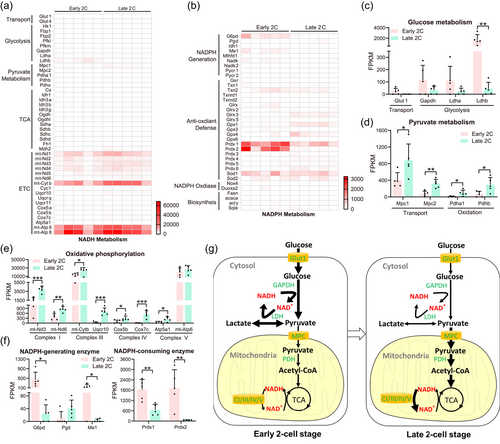
NADPH is primarily generated by the pentose phosphate pathway and other enzymes, including isocitrate dehydrogenase, malic enzyme, and methylenetetrahydrofolate dehydrogenase, whereas it is consumed in both antioxidant defense and biosynthesis. Two NADPH-generating enzymes, glucose-6-phosphate dehydrogenase and malic enzyme 1, showed decreased expression during the two-cell stage (Figure 4f). No other NADPH generation mechanisms showed significant changes in expression (Figure 4b). The biosynthetic pathways that consume NADPH, including the anabolism of fatty acids, cholesterol, and nucleotides, remain unchanged. However, although many enzymes critical for redox homeostasis showed little or no change in expression, the expression of Prdx1 and Prdx2, which encode two H2O2 scavengers, was considerably decreased; in particular, there was a more than 40-fold decrease in Prdx2 expression (Figure 4f). Gene expression analysis suggested that a change in the redox state occurs during the two-cell stage and is possibly associated with an increase in NADPH levels (Figure 4g).
4 DISCUSSION AND CONCLUSIONS
Metabolic regulation plays a critical role in embryonic development (Zhang et al., 2018), including in cell growth and proliferation during ZGA and compaction (Chi et al., 2020; Nagaraj et al., 2017). However, current mainstream methods for metabolic analysis, including chromatography and mass spectrometry-based technology, usually require cell lysis for the preparation of metabolite samples leading to invasive disruption of embryonic development and subsequently lost of a large spatiotemporal information, posing a substantial technological challenge. Single-cell metabolic monitoring technology is highly desirable because of the single-cell nature of fertilized eggs. Genetically encoded fluorescence sensors can be used to real-time measure metabolites in vivo, allowing them to be the powerful tools for solving unmet challenges. Here, we chose to analyze the core coenzymes I (NADH and NAD+) and II (NADPH) because they participate in hundreds of redox, catabolic, and anabolic reactions. Tracking NADH/NAD+ and NADPH levels may shed light on the paramount view of metabolic activity. We established two biosensors, the NADH/NAD+ sensor SoNar, and the NADPH sensor iNap1, with high performance in aspects of responsiveness, specificity and sensitivity. These sensors have been utilized for the in vivo imaging of zebrafish embryos and larvae, and adult mice but not mouse embryos (Tao et al., 2017; Zhao et al., 2015, 2016; Zou et al., 2018).
Several issues are associated with biosensor-based assays in early mouse embryos. One is whether the sensors can be efficiently delivered and expressed in embryos, and the other is whether they impact the embryonic development. We observed homogenous and soluble expression of SoNar, iNap1, and the control sensor iNapc, and the results showed that routine expression of the metabolite sensors SoNar and iNap1 did not affect the blastocyst development efficiency and birth rate of mouse embryos. In general, it takes 6–8 h for the expression and maturation of biosensors. For the metabolic analysis in earlier stage, taking the fertilization stage as an example, alternative ways such as transgene-mediated expression seem to be a choice. The fluorescence signal was able to be detected until implantation, which means the fluorescence of sensors last more than 72 h.
Our imaging data showed that cytosolic NADH/NAD+ decreased with progression from the early to late two-cell stage. Using transcriptome analysis, we gained insights into the metabolic switch mechanisms that might be responsible for the observed metabolic alterations. At the early two-cell stage, glycolysis is likely highly active, and less pyruvate is transported into the mitochondria for oxidation to produce energy. During the late two-cell stage, glucose utilization is expected to decline, and oxidative phosphorylation becomes active. This finding is consistent with observations from a recent metabolomics study (Zhao et al., 2021).
Redox hemostasis is critical for reproduction and embryonic development, with reactive oxygen species causing the permanent arrest of embryonic development at high levels while functioning as signaling messengers in embryonic stem cells (Sinenko et al., 2021). NADPH provides fundamental reducing power for the two principal antioxidant defense systems, the thioredoxin and glutathione systems (Ren et al., 2017), thus it represents the central metabolite for redox balance. Interestingly, we observed an increase in NADPH levels and downregulation of some NADPH generating enzymes during the transition from the early to the late two-cell stage, opening the possibility of reduced consumption of NADPH. Further inspection of the NADPH-consuming pathways revealed that the expression of some antioxidant enzymes, but not biosynthetic enzymes, was changed. This evidence implies that a transition of the redox state may occur in the two-cell stage, and further efforts should be made to investigate the biological significance and the underlying mechanisms. Taken together, this study not only developed a biosensor-based metabolic monitoring technology for mouse blastocysts but also provided novel insights into energy and redox metabolism in early embryonic development.
AUTHOR CONTRIBUTIONS
Yuzheng Zhao, Qi Zhou, Wei Li, Guihai Feng, and Leyun Wang conceived and designed the study. Yuzheng Zhao and Qi Zhou supervised the project. Hao Sun, Zhuo Zhang, Tianda Li, Ting Li, and Weicai Chen performed the experiments. Hao Sun, Zhuo Zhang, and Tianshi Pan analyzed the sequencing data. Sen Fang and Chao Liu were involved in the methodology. Hao Sun, Zhuo Zhang, Yuzheng Zhao, and Qi Zhou wrote the manuscript. Ying Zhang was involved in the manuscript preparation. All authors read and approved the final version of the manuscript.
ACKNOWLEDGMENTS
This research is supported by National Key Research and Development Program of China (2018YFE0201100 to Leyun Wang, 2019YFA0904800 to Yuzheng Zhao, 2019YFA0110100 to Tianda Li, 2021YFA0719300 to Tianda Li., and 2022YFA1104300 to Chao Liu), NSFC (32150030, 32030065, 32121005, 92049304 to Yuzheng Zhao), the international cooperation project of China Manned Space Program to Wei Li, Shanghai Frontiers Science Center of Optogenetic Techniques for Cell Metabolism (Yuzheng Zhao). Research Unit of New Techniques for Live-cell Metabolic Imaging (Chinese Academy of Medical Sciences, 2019RU01, 2019-I2M-5-013 to Yuzheng Zhao), the State Key Laboratory of Bioreactor Engineering, the Fundamental Research Funds for the Central Universities.
CONFLICT OF INTEREST STATEMENT
The authors declare no conflict of interest.


