Regulation of Spermatogenic Cell T-Type Ca2+ Currents by Zn2+: Implications in Male Reproductive Physiology
Abstract
Zn2+ is a trace metal which is important for spermatogenesis progression; its deficiency causes atrophy or malignant growth of the testis. Although testis, epididymis, and prostate contain high Zn2+ concentrations, the molecular entities which are modulated by this metal are still under study. Interestingly, spermatogenic cells mainly express CaV3.2-encoded T-type Ca2+ currents (ICaT) which are positively or negatively modulated by Zn2+ in other tissues. To explore whether ICaT could be regulated by Zn2+ and albumin, its main physiological carrier, we performed whole cell electrophysiological recordings of spermatogenic cell ICaT in the absence or presence of different Zn2+ concentrations. Zn2+ decreased ICaT in a concentration-dependent manner (IC50 = 2 μM) and this inhibition could only be completely removed in presence of albumin. Differently to previous reports, ICaT did not show a tonic inhibition by Zn2+. Further analysis showed that Zn2+ did not affect the voltage dependency or the kinetics of current activation, but right shifted the steady-state inactivation curve and slowed inactivation and deactivation kinetics. Recovery from inactivation was also altered. However, these apparent alterations in gating properties are not enough to explain the strong ICaT reduction. Using non-stationary fluctuation analysis, we found that Zn2+ mainly reduced the number of available Ca2+ channels without changing the single channel current amplitude. ICaT modulation by Zn2+ could be relevant for spontaneous Ca2+ oscillations during spermatogenesis and in pathophysiological conditions such as diabetes. J. Cell. Physiol. 231: 659–667, 2016. © 2015 Wiley Periodicals, Inc.
Essential trace metals (Cu2+, Zn2+, etc.) are important nutrients for healthy physiological functions, they play key regulatory and structural roles in all mammalian cells. In particular, Zn2+ was found to be important in the male reproductive organ under normal or pathological conditions. In vertebrates, the major Zn2+ carrier is serum albumin which contains 9–14 mM of bound Zn2+ (∼75–85% of all plasma Zn2+) (Kiilerich et al., 1980; Lu et al., 2008). Although essential trace metals are required in mammalian reproduction for both genders, the free concentration of Zn2+ is 9% higher in male (15.3 μM) than in female serum; even when they contain the same amount of serum albumin (Kiilerich et al., 1980). Interestingly, in the female genital tract, the vaginal fluid contains 0.018 g/L of albumin (Owen and Katz, 1999), and this protein has been shown to accelerate Zn2+ release ratio from artificial Zn2+ sources in contraceptive assays using a simulated uterine solution (Yang and Xie, 2006). These findings suggest that one of albumin's physiological roles could be the reduction of excessive Zn2+ in seminal fluid of ejaculated sperm to promote fertilization. Furthermore, male reproductive organs (testis, epididymis, prostate) accumulate high Zn2+ concentrations. For example, adult testis contain ∼20–200 μg/g dry weight whereas the prostate ∼800–3000 μg/g dry weight; the latter has the highest Zn2+ concentration in the body (Vallee and Falchuk, 1993; Bedwal and Bahuguna, 1994). In rats, the epididymal Zn2+ concentration is twice the amount in testis (Bedwal and Bahuguna, 1994). Testicular Zn2+ is required for the maintenance of germ cells, the progression of spermatogenesis (Yamaguchi et al., 2009; Zhao et al., 2012), and also for the regulation of sperm motility [7]. Considering its antioxidant properties, Zn2+ has been proposed to be involved in the protection of testis from oxidative stress and damage (Celino et al., 2011; Zhao et al., 2013). As previously reported, Zn2+ deficiency has been related to genital immaturity (review in Kiilerich et al., 1980). In rats, the absence of Zn2+ induces atrophy of the seminiferous tubules and spermatogenesis arrest, especially of the last stages when the Zn2+ content of maturing sperm increases (Vallee and Falchuk, 1993; Celino et al., 2011). Moreover, sperm accumulate fourfold higher Zn2+ concentration in the cytoplasm (Bedwal and Bahuguna, 1994) as they travel from the testis to the urethra as a consequence of their exposure to seminal fluid which is rich in this trace metal (Westmoreland et al., 1967). In addition, it is known that this metal stabilizes the quaternary structure of chromatin to preserve genomic integrity, and contributes to the attachment of the sperm head to flagella; Zn2+ removal induces head-tail detachment (reviewed in (Vallee and Falchuk, 1993)).
Sperm cells are terminally differentiated and are thought to be transcriptionally and translationally silent; therefore, spermatozoa are unable to synthesize new mRNA or translate it into new polypeptides (reviewed in Miller et al., 2014). During spermatogenesis, germinal cells synthesize all the proteins that will end up in mature sperm, including ion channels. Transcripts and immunodetection of different voltage dependent Ca2+ channels were reported in pachytene spermatocytes and in round spermatids (CaV1.2 (α1C); CaV2.1 (α1A); CaV2.3 (α1E); and CaV3 subunits (α1G, α1H, and α1I) (Liévano et al., 1996; Benoff, 1998; Treviño et al., 2004). Despite this high diversity in Ca2+ channel α subunits, pachytene spermatocytes and round spermatids only display macroscopic T-type Ca2+ currents (Arnoult et al., 1996; Santi et al., 1996) which are mainly encoded by CaV3.2 (α1H) subunits (Stamboulian et al., 2004; Treviño et al., 2004; Escoffier et al., 2007). T-type Ca2+ currents (ICaT) from spermatogenic cells have been widely characterized, they are blocked by Ni2+, dihydropyridines, and amiloride, at concentrations that inhibit the zona pellucida (ZP)-induced sperm Ca2+ uptake and the subsequent acrosome reaction, an exocytotic event triggered when sperm contact the extracellular layers of the oocyte which allows sperm to penetrate and fuse with the egg (Darszon and Hernández-Cruz, 2014). On the other hand, the physiological role of CaV channels during spermatogenesis is not clear. It has been proposed that they are required for normal testicular maturation in mice. Pharmacological disruption of CaV1 and CaV3 Ca2+ channels causes sterility by arresting round spermatids and diminishing the Leydig cell population (Lee et al., 2011). Interestingly, the macroscopic ICaT amplitude is reduced as spermatogenesis progresses; ICaT can be detected from spermatocytes until testicular sperm (reviewed in Darszon et al., 2006) but are not detectable on epididymal sperm (Xia and Ren, 2009). The physiological process responsible for ICaT down regulation is not known.
Previous reports indicate that Zn2+ differentially affects the biophysical parameters of ICaT from different neurons with inconsistent and even contradictory results (reviewed in Noh et al., 2010). In some cases, Zn2+ induces a negative shift of both activation and inactivation curves of recombinant CaV3.1 (α1G) and CaV3.3 (α1I) Ca2+ channels (Traboulsie et al., 2007); whereas Noh (2003) (Noh and Chung, 2003) reported in rat thalamic neurons, a positive shift for both activation and inactivation curves of ICaT, potentially encoded by CaV3.1 (α1G) subunits. Similar inconsistencies were described regarding ICaT kinetics, Cataldi and coworkers (Cataldi et al., 2007) but not in the study by Traboulsie and collaborators (Traboulsie et al., 2007) found that Zn2+ slows the activation rate of ICaT. ICaT amplitude also shows a differential response to Zn2+ addition, for example, in neuroblastoma (NG 108-15) the CaV3.3-encoded Ca2+ current amplitude was dramatically increased (Traboulsie et al., 2007), but not in HEK-293 expressing the same α subunit (Cataldi et al., 2007).
In the present report, we explored the potential regulation by Zn2+ and serum albumin, its chelator, of spermatogenic cell ICaT, considering the prominent role of this metal in spermatogenesis. The participation of ICaT in this process is poorly understood, but its regulation by Zn2+ could influence basal Ca2+ concentrations in spermatogenic cells. In addition, the albumin present in the female genital tract could remove the excessive Zn2+ present in ejaculated sperm, releasing ICaT inhibition by this trace metal.
Materials and Methods
Reagents
Disodium ethylenediaminetetraacetate (EDTA) was purchased from J.T. Baker (J.T. Baker, Mexico). Bovine serum albumin (BSA) and N,N,N,N-Tetrakis(2-pyridylmethyl)-1,2-ethylenediamine (TPEN) were acquired from Sigma–Aldrich (St. Louis, MO). TPEN was dissolved in ethanol (10%) and stored frozen until use. Other reagents and salts were from the highest quality commercially available.
Electrophysiology
CD1 mouse spermatogenic cells were prepared as described previously (Castillo et al., 2007). Disaggregated spermatogenic cells were placed on the stage of an inverted microscope (Diaphot 300, Nikon), and membrane currents were recorded with an Axopatch 200B amplifier (Molecular Devices, Sunnyvale, CA) and filtered at 5 kHz (four-pole Bessel filter). Ion currents were digitized using a Digidata 1440A interface (Molecular Devices) and analyzed with the pCLAMP 10.5 and SigmaPlot 12.3 software suites. Linear capacitative currents were minimized analogically using the capacitative transient cancellation feature of the amplifier. All experiments were carried out at room temperature (∼22°C) and the holding potential (HP) was −120 mV. The recording extracellular solution contained (in mM): 125 TEACl, 5 CaCl2, 10 n-2-hydroxyethylpiperazine-w-2- ethanesulfonic acid (HEPES) and 10 d-glucose; pH was 7.3 adjusted with TEAOH. Intracellular solution contained (in mM): 120 CsMeSO4, 10 EGTA, 5 MgCl2, 10 HEPES, 10 d-glucose and 60 glutamic acid. pH was adjusted to 7.4 with CsOH. The osmolality of the external and internal solutions were 290 and 265 mOsmol/kg, respectively. Patch pipettes were made from borosilicate glass and were pulled with a laser micropipette puller P-2000 (Sutter Instruments Co., Novato, CA). The typical micropipette electrical resistance was 3–8 MΩ when filled with internal solutions.
T-type Ca2+ current recordings
 (1)
(1) (2)
(2) (3)
(3) (4)
(4) (5)
(5)Statistical data analysis
Statistical analysis was performed using the Sigmaplot 12.3 software (Systat Software, Inc). Data were expressed as the mean ± standard error of the mean (SEM). Statistical significance was determined using Student paired t test or Analysis of variance (ANOVA) and Tukey's test for multiple comparisons. A P < 0.05 was considered significant. All the experiments were repeated at least three times.
Results
Serum albumin (BSA) completely recovered the fraction of spermatogenic cells ICaT inhibited by Zn2+
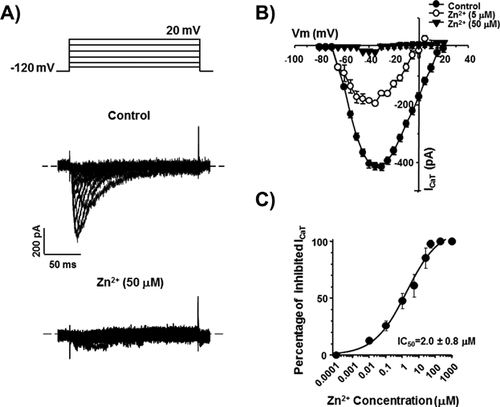
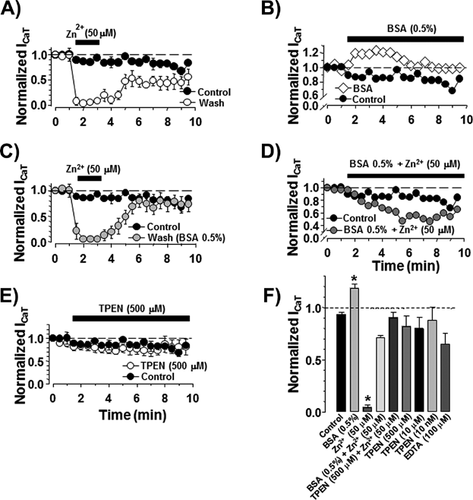
As previously demonstrated, ICaT from spermatogenic cells can be evoked using a voltage protocol of 200 ms pulses from −80 up to +20 mV with 5 mV steps, from a holding potential (Vh) of −120 mV. Representative Ca2+ current traces show the transitory Ca2+ current with the classical criss–cross pattern for ICaT (Fig. 1A, control upper traces). Consistently, the ICaT activation threshold was −70 mV and the maximum current amplitude was reached around −40 mV (Fig. 1B, closed circles). Addition of Zn2+ (50 μM) almost completely inhibited the ICaT of spermatogenic cells evoked by the same voltage protocol (Fig. 1A, lower traces; Fig. 1B closed triangles); whereas Zn2+ (5 μM) decreased ICaT amplitude around 60% (Fig. 1B, open circles). Zn2+ inhibition of ICaT was clearly concentration dependent with an IC50 = 2.0 ± 0.8 μM and a Hill constant (nHill) = 0.44 ± 0.07 (Fig. 1C). The IC50 value for the ICaT inhibition by Zn2+ in spermatogenic cells is statistically similar to the IC50 (3 μM) reported for the CaV3.2 (α1H) encoded-Ca2+ currents, confirming that ICaT of these cells are mainly encoded by CaV3.2 subunits (Stamboulian et al., 2004; Treviño et al., 2004; Escoffier et al., 2007), with a nHill value indicating two potential binding sites for Zn2+ on T-type channels. The inhibitory effect of Zn2+ on ICaT was partially reversible after washing (∼50%; Fig. 2A, open circles), suggesting the presence of a Zn2+ high affinity binding site on spermatogenic cells T-type Ca2+ channels as described for CaV3.2 (α1H) pore subunits (Nelson et al., 2007; Kang et al., 2010). In neurons, such a Zn2+ high affinity binding to T-type Ca2+ channels is responsible for long lasting inhibition of an important fraction of the total Ca2+ current expressed in these cells, a phenomenon known as tonic inhibition (Nelson et al., 2007). A previous report showed that BSA (0.5%) increases ICaT amplitude of spermatogenic cells (Espinosa et al., 2000). Consistently, we observed that perfusing spermatogenic cells with a BSA (0.5%) solution increased the ICaT amplitude by 20% and abolished the rundown observed in control conditions (Fig. 2B, open diamonds vs. closed circles). Considering that BSA is an excellent Zn2+ carrier and chelator (Yang and Xie, 2006; Lu et al., 2008), it is possible that this protein increases ICaT amplitude by removing Zn2+ ions previously bound to T-type Ca2+ channels in spermatogenic cells, as described for C-type nociceptors (Nelson et al., 2007). As a first approach to explore this possibility, we used BSA (0.5%) as a Zn2+ chelator, to further remove all the Zn2+ bound to spermatogenic cells Ca2+ channels and we were able to completely recover ICaT confirming the high affinity binding of Zn2+ on T-type channels (Fig. 2C, gray circles). Furthermore, adding Zn2+ (50 μM) to the BSA (0.5%) solution eliminated the ICaT amplitude increase and produced a partial ICaT inhibition (around 40%) probably due to the presence of free Zn2+ in the solution (Fig. 2D, dark gray circles). To determine whether BSA (0.5%) increases ICaT amplitude by removing Zn2+ ions previously bound to T-type Ca2+ channels releasing them from a putative tonic inhibition caused by Zn2+, we used two different high affinity Zn2+ chelators, namely TPEN and EDTA. Addition of TPEN at different concentrations (0.01–500 μM) did not induce the observed ICaT amplitude increase (Fig. 2E, open circles; and F). Consistent with the previous results, TPEN (500 μM) also abolished the ICaT inhibition by Zn2+ (50 μM) showing it was properly chelating this trace metal (Fig. 2F). EDTA (100 μM) addition suggests that the BSA (0.5%)-induced ICaT increase is not due to a removal of tonic inhibition by Zn2+ from CaV3.2, as it happens in neurons (Fig. 2F).
Extracellular Zn2+ modifies the voltage dependence of inactivation and the inactivation and deactivation kinetics of spermatogenic cell ICaT
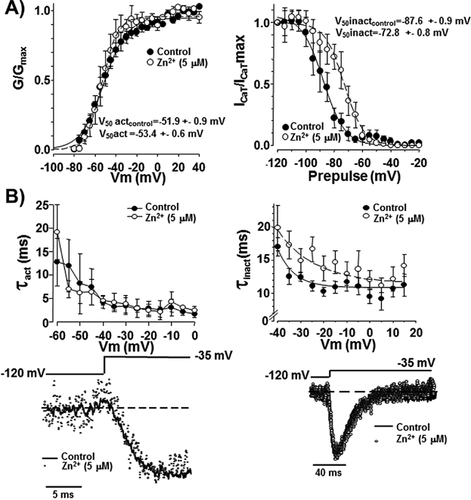
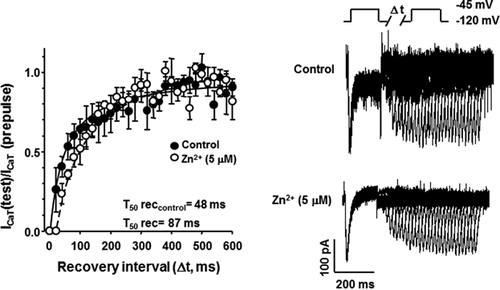
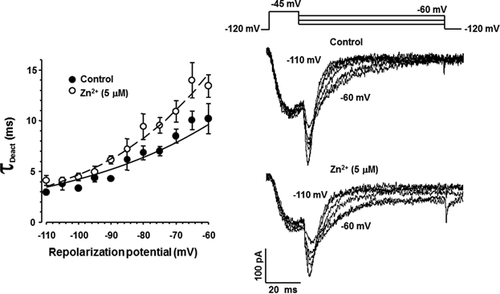
As previously mentioned, several reports indicate that Zn2+ differentially affects the biophysical parameters of T-type Ca2+ channels, expressed either endogenous or heterologously. However, the results are inconsistent and even contradictory (reviewed in Noh et al., 2010). In order to characterize the molecular mechanisms involved in the Zn2+ inhibitory effect on ICaT from spermatogenic cells, we examined whether Zn2+ exposure could modify the steady-state activation and/or inactivation parameters of such Ca2+ currents. Addition of Zn2+ (5 μM) did not affect neither the activation curve (Fig. 3A left panel) nor the activation time constant (τact) values of ICaT (Fig. 3B left panel). Half activation voltages (V50 act) values were −52 ± 0.9 and −53 ± 0.6 mV in the absence (control, closed circles Fig. 3A) or presence of Zn2+ (open circles, Fig. 3A), respectively. However, this Zn2+ concentration shifted the steady-state inactivation curve to more positive voltages from a half inactivation voltage (V50 inact) of −88 ± 0.9 to −73 ± 0.8 mV in presence of Zn2+ (Fig. 3A, right panel). In addition, Zn2+ significantly increased the inactivation time constant (τinact) compared to control conditions (Fig. 3B right panel, closed circles). Considering that inactivation but not activation parameters of ICaT were altered by Zn2+, we wondered if recovery from inactivation of ICaT could be also sensitive to Zn2+. Indeed, extracellular Zn2+ (5 μM) slowed the recovery from inactivation of ICaT from a half time of recovery (T50 rec) value of 48 for control (Fig. 4A, closed circles) to 87 ms in the presence of Zn2+ (Fig. 4A, open circles). A previous report indicates the increased deactivation rate of ICaT as a novel mechanism for Zn2+ inhibition at least in thalamic neurons (Noh et al., 2010). To elucidate whether this mechanism also operates in spermatogenic cells, we applied a deactivation protocol in the absence or presence of Zn2+ (5 μM). Deactivation time constant (τDeact) values of ICaT were larger in the presence of Zn2+ (Fig. 5 left panel, open circles) with respect to control condition (Fig. 5 left panel, closed circles) indicating that in spermatogenic cells a different mechanism is responsible for Zn2+ inhibition of ICaT. Altogether, the Zn2+-induced modifications on the ICaT steady-state and kinetics parameters described above are not enough to explain the reduction of ICaT amplitude here reported.
Zn2+ acts as a pore blocker without affecting single channel current amplitude of spermatogenic cells ICaT
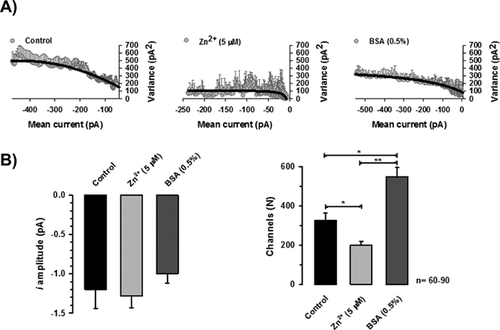
Reduction in ICaT of spermatogenic cells could be explained if the single channel unitary current (i) and/or the number of available channels (N) of spermatogenic cells were affected by Zn2+ addition. To evaluate both possibilities, we performed a non-stationary fluctuation analysis of ICaT tails. Our results showed that single channel current amplitude (i) was statistically similar in the three different experimental conditions: control, Zn2+ (5 μM) or BSA (0.5%), with values of −1.2 ± 0.2, −1.3 ± 0.2, and −1.0 ± 0.2 pA, respectively (Fig. 6B, left panel). The calculated single channel conductance for these single current amplitudes in our experimental conditions ranged between 6 and 10 pS, similar to the single channel conductance reported for T-type channels (5–7 pS) (Cribbs et al., 1998; Perez-Reyes et al., 1998). However, the number of available Ca2+ channels dramatically changed in each experimental condition. The total number of available ion channels (N) in control condition was 326 ± 36 per spermatogenic cell (Fig. 6B, right panel closed bar), whereas in the presence of Zn2+ (5 μM), the N mean value was 200 ± 20 channels per cell (around 39% less; Fig. 6B right panel, gray bar). Consistently, BSA (0.5%) treatment of spermatogenic cells, an experimental control condition that induced larger amplitude of Ca2+ currents by itself and without any previous exposition of these cells to Zn2+, produced an increased N value of 546 ± 48 channels per cell (Fig. 6 right panel, dark gray bar).
Discussion
Extracellular Zn2+ in male reproductive organs could regulate ICaT in spermatogenic cells
The regulation of ICaT from different neuronal cell types by Zn2+ has been widely reported (Noh and Chung, 2003; Nelson et al., 2007; Kang et al., 2010; Noh et al., 2010; Mor et al., 2012). However, despite the Zn2+ relevance for spermatogenesis progression and male fertility, how this trace metal regulates spermatogenic cell ICaT has been poorly explored (Bedwal and Bahuguna, 1994). As previously mentioned, the male reproductive organs contains a high Zn2+ concentration (Bedwal and Bahuguna, 1994) and spermatogenic cells accumulate increasing Zn2+ concentrations through spermatogenesis (Vallee and Falchuk, 1993; Celino et al., 2011). Considering that the Zn2+ IC50 for spermatogenic cell T-type Ca2+ channels that we found (2.0 ± 0.8 μM; Fig. 1C) is close to the one reported in heterologous expressed CaV3.2 α subunit (3.0 ± 0.2 μM) but different from the obtained IC50 value for CaV3.1 α subunit (82.2 ± 6.9 µM) (Kang et al., 2010), this observation is consistent with the proposal that the main component of ICaT in spermatogenic cells is encoded by CaV3.2, as previously reported (Stamboulian et al., 2004; Treviño et al., 2004; Escoffier et al., 2007). Our findings indicate that testis physiological Zn2+ concentrations (∼20–200 μg/g dry weight) could influence Ca2+ influx via CaV3.2 in these cells. Partial reversibility of ICaT inhibition by Zn2+ after washing can be explained considering that CaV3.2 Ca2+ channels possess a high affinity binding site for Zn2+ (Fig. 2A). The fast ICaT inhibition by Zn2+ and the partial rapid recovery of ICaT after washing suggest a direct Zn2+ interaction rather than an indirect regulation of this Ca2+ current. However, these observations do not exclude a potential intracellular regulation of ICaT by Zn2+. On the other hand, the need to use a BSA (0.5%) solution to recover the remaining current indicates that Zn2+ is strongly bound to spermatogenic cell T-type channels, and is removed by this Zn2+ chelator (Fig. 2C). BSA has only one high-affinity binding site for Zn2+ named site A, and its dissociation constant is 1 μM (Lu et al., 2008). The ICaT partial inhibition observed in a BSA (0.5%) solution preincubated with Zn2+ (50 μM) is probably caused by the remaining free Zn2+ in this experimental condition (Fig. 2D). To explore a potential tonic inhibition by Zn2+ of spermatogenic cell ICaT as the molecular mechanism behind the BSA-induced ICaT amplitude increase, we used two additional Zn2+ chelators named TPEN and EDTA. Our results indicated that contrary to previous observations on neuronal ICaT (Nelson et al., 2007), spermatogenic cell ICaT do not present a tonic inhibition by Zn2+ in our experimental conditions (Fig. 2F). However, they do not disprove that tonic ICaT inhibition by Zn2+ could occur after sperm transit through the epididymis and/or in the presence of seminal fluid. Alternatively, the BSA-induced ICaT amplitude increase could be due to this protein's interaction with β-estradiol (Espinosa et al., 2000) and/or with membrane long-chain fatty acids (Lu et al., 2008). Interestingly, the long-chain fatty acid binding site (FA2) and the Zn2+ binding site (site A) on BSA are mutually exclusive (Lu et al., 2008).
Zn2+ effects on the biophysical parameters of ICaT in spermatogenic cells are different than in neuronal cells
In contrast to previous reports in neurons (Cataldi et al., 2007; Traboulsie et al., 2007), Zn2+ did not affect the steady-state activation curve nor the activation kinetics of spermatogenic cell ICaT. However, the presence of Zn2+ modified the steady-state inactivation curve and inactivation and deactivation kinetics of spermatogenic cell ICaT. Altogether, these observations suggest that, at least in male germinal cells, the Zn2+ binding site(s) could be only accessible in the open configuration of Ca2+ channels, but this hypothesis deserves further investigation. Furthermore, the strong ICaT inhibition by Zn2+ cannot be explained by the Zn2+ effects on the biophysical parameters on these Ca2+ currents: a positive shift in the steady-state inactivation curve and slower inactivation and deactivation kinetics. In addition, the recovery from inactivation was also slowed in the presence of Zn2+. Regarding deactivation, the effect of Zn2+on this process seems to depend on the CaV3 isoform. A previous study in thalamic neurons indicates an increased deactivation rate for CaV3.1-encoded ICaT as a novel mechanism for Zn2+ inhibition (Noh et al., 2010); however, Zn2+ slows down the deactivation kinetics of ICaT generated by CaV3.3 (Cataldi et al., 2007) or CaV3.2 subunits (this work, Fig. 5). Most of these Zn2+-induced alterations of ICaT biophysical parameters would not contribute to the ICaT amplitude reduction by this trace metal. Nevertheless, the Hill coefficient obtained for Zn2+ inhibition (0.44 ± 0.07) suggests, at least, two different Zn2+ binding sites with a negative cooperative binding. One of these metal binding sites is constituted by an Asp-Gly-His motif on the transmembrane segments IS3-IS4 plus one Asp residue in IS2 transmembrane segments of CaV3.2 Ca2+ channels, (Kang et al., 2010). Zn2+ occupancy of this metal binding site could be responsible for its effects as a gating modifier and it would be independent of the binding site inside the channel pore where Zn2+ directly blocks CaV3 Ca2+ channels (Kang et al., 2010). The ability of Zn2+ to decrease gating charge movement (Kang et al., 2010) could explain the slowing in T-type channel transitions among different channel states (from open to inactive or closed channel states, a less effective recovery from inactivation, etc.; Figs. 3-5). Certainly, this hypothesis deserves to be further tested. In addition, it is quite possible that the interaction of Zn2+ with the most external Zn2+ binding site (IS3-IS4 and IS2 transmembrane segments) precludes Zn2+ blocking of spermatogenic cell ICaT in a negative cooperative binding mode. As reported by different groups, the main effect of Zn2+ on T-type Ca2+ channels is reducing Ca2+ flux due to its role as a pore blocker (Noh and Chung, 2003; Nelson et al., 2007; Kang et al., 2010; Noh et al., 2010). Consistently, our results indicated that Zn2+ reduces the total number of available Ca2+ channels of spermatogenic cells without affecting single channel current amplitude (Fig. 6). This effect is the main cause of ICaT reduction in spermatogenic cells.
Zn2+and the ICaT of male germinal cell line
In the sperm physiological context, increasing Zn2+ concentrations in the germ cell line could contribute to silence T-type Ca2+ channels and, as a consequence, reducing ICaT in late spermatogenesis stages. Interestingly, in vivo chelator-induced or diabetes-caused Zn2+ deficiency, increases spermatogenic cell apoptosis in rat testis, suggesting a physiological relevant role of Zn2+ in spermatogenesis (Zhao et al., 2012, 2013). Recently, it has been reported that subpopulations of spermatogenic cells display spontaneous Ca2+ oscillations which involved Ca2+ influx through CaV3 channels (Sánchez-Cárdenas et al., 2012). However, the role of Ca2+ signaling in spermatogenesis is poorly understood. The increase of intracellular Ca2+ concentration in Sertoli cells in response to testosterone and follicle-stimulating hormone is associated to cell migration and proliferation during spermatogenesis (Loss et al., 2011). Considering the above mentioned information, in a pathological condition such as diabetes, spermatogenic cell ICaT could be larger than in physiological conditions due to Zn2+ deficiency and it could contribute to spermatogenic cell apoptosis. Interestingly, testicular mitochondrial Ca2+ buffering capacity is diminished in diabetic organisms (Amaral et al., 2009), which could exacerbate phenotypes associated to dysregulation of Ca2+ homeostasis in male germinal cells. Lastly, maximal ICaT inhibition could be reached at the stage of ejaculated sperm when mixed with seminal fluid, where Zn2+ concentration is 800 up to 3000 μg/g dry weight (Vallee and Falchuk, 1993; Bedwal and Bahuguna, 1994). The presence and functionality of CaV3.2 channels in mature and capacitated sperm was previously demonstrated using a CaV3.2 deficient mouse line, where the Ca2+ influx amplitude in CaV3.2−/− sperm in response to a membrane depolarization was 30% smaller compared to wild-type sperm (Escoffier et al., 2007). In contrast, no macroscopic ICaT currents but CatSper Ca2+ currents were found in epididymal sperm (Xia and Ren, 2009), highlighting the down regulation of ICaT currents during sperm maturation. The fraction of other voltage activated Ca2+ channels which could be functional in mature sperm is not known, but at least it could include CaV3.2 and CaV2.3 Ca2+ channels (Escoffier et al., 2007; Cohen et al., 2014). In a speculative way, once in the female genital tract, ejaculated sperm would be in the presence of a physiologically relevant amount of albumin which could release the remaining fraction of T-type Ca2+ channels from their inhibition by the Zn2+ present in seminal fluid. While the physiological relevance of macroscopic CatSper Ca2+ currents is clear in regulating sperm hyperactivation, a particular form of motility which generates a more powerful swimming force required for successful fertilization; their potential contribution to the acrosome reaction requires further examination. Catsper knockout mice maintain intact spermatogenic cell ICaT (Ren et al., 2001), and the ability of their spermatozoa to undergo the acrosome reaction is similar to that of those from wild-type mice (Xia and Ren, 2009; Singh and Rajender, 2015). Spermatozoa from CatSper1 null mice show a delayed ZP-induced Ca2+ rise that leads to acrosome reaction therefore, the potential contribution of CaV2.3 or CaV3.2 channels in this phenomenon should be further studied.
Acknowledgements
The authors thank Jose Luis De la Vega, Yoloxóchitl Sánchez, Shirley Ainsworth, Paulina Torres-Rodríguez, Elizabeth Mata, and Gabriela Cabeza for technical assistance. We thank Juan Manuel Hurtado, Roberto Rodríguez, and Arturo Ocádiz for computer services.
Author's Contribution
ILG contributed substantially to the acquisition and analysis of data, drafting the article and the final version to be submitted. ILG, CLT, and AD substantially contributed to the study design, critically reviewing the article for intellectual content, and final version to be submitted.


