Finance research over 40 years: What can we learn from machine learning?
Abstract
We apply machine learning models to a universe of 20,185 finance articles published between 1976 and 2015 on 17 finance journals, and objectively identify 38 research topics. The financial crisis, hedge/mutual fund, social network, and culture were the fastest growing topics, while market microstructure, initial public offering, and option pricing shrank most from 2006 to 2015. We also list each topic's most cited papers, and present the fastest-growing topics among the universe of 130,547 SSRN working papers. Moreover, we find a bibliometric regularity: the number of researchers covering n topics is about twice the number of researchers covering n + 1 topics.
1 INTRODUCTION
Finance researchers are interested in knowing what other finance researchers work on, but many finance researchers, especially the junior ones, are not perfectly familiar with the big picture of this profession' all research topics and their history. Given the large amount of time it takes from project start to publication, research topic selection is an important choice made by academic researchers. Better informed topic choice carries personal benefits for the researcher and their career. But perhaps more important from a welfare perspective is that it may help avoid wasted energy spent on dead topics that generate little interest. Therefore, an analysis of all academic works in finance may be beneficial to the finance researchers who desire to have a bird's-eye view of this academic profession and inspire more cross-topic research.
This paper has two main goals: to objectively classify the topics that prior finance literature covers and to explore the evolution and patterns of this profession. How did the finance research topics evolve in the past 40 years? Were there any topics popular decades ago but are unattractive today? Which topics attracted the most attention in the recent decade? To answer these questions, we (1) construct a comprehensive sample that contains most of the published finance articles in the last 40 years by collecting information of 20,185 academic articles published on 17 finance journals between 1976 and 2015 and (2) determine which topic each article belongs to by employing two popular unsupervised machine learning-based textual analysis to process the literature texts.1
We apply latent Dirichlet allocation2 (LDA) on all abstracts3 and shows that published research can be categorized into 38 topics.4 The largest topics include “Option Pricing,” “Commercial Banking,” “CEO, Board, Director,” “Market Microstructure,” “Central Bank, Monetary Policy,” and “Mergers and Acquisitions.” Besides traditional asset pricing and corporate finance topics, we also identify topics such as “Social Network and Cultural Effect” and “Venture Capital, Entrepreneurship.” We plot each topic's historical publication number and show the rise and fall over time. Publications on “Financial System, Banking Crisis” and “Hedge Fund, Mutual Fund” increased the fastest in the past decade.
We also apply the LDA model trained from published papers on 130,547 working paper abstracts that we obtained from the SSRN Financial Economics Network. We find that working papers on “Social Network and Cultural Effect,” “News, Analyst Report, Earnings Announcement,” and “International Capital Markets” grew fastest from 2006 to 2015. “Market Microstructure,” “Macro Finance,” and “Statistical Estimation Methodology” experienced the greatest contraction during the same period.
Using dynamic topic model (DTM), we present how specific research interests evolve. For example, within the topic of “Determinants of Stock Return,” there were many publications on the January effect of stock prices5 before 1990. Since 2000, the January effect has not been on the top list of researchers and research of momentum strategies and cross-sectional analysis had become more popular.
Based on the topic classification, we conduct extension analyses. First, we examine how topics are related to each other. We plot a citation network between topics and show that the research topics can be largely grouped into five “territories”: asset pricing, corporate finance, market microstructure, banking and macrofinance, and “mixed areas.” From the network figure, we easily see that the research of “Mergers and Acquisitions” is closer to “CEO, Board, Director” compared to “Commercial Banking.” Second, we find a strong bibliometric regularity: the number of researchers covering n topics is about twice the number of researchers covering n + 1 topics. Third, we find that on average a published finance article covers fewer research topics over the years, which indicates that the published articles tend to become more focused than being broad.
It is natural to think of JEL classification codes to identify an article's topic. However, there are three reasons that JEL codes are not enough for our analysis. First, some journals, including the top ones, do not provide JEL codes, such as The Journal of Finance (JF) and Journal of Financial and Quantitative Analysis (JFQA). Second, although some journals provide JEL codes today, they did not provide them in the early years. For example, Review of Financial Studies (RFS) had its first volume in 1988 but started providing JEL codes in 2007.6 Therefore, it is difficult to analyze the early articles and historical trend. After searching over Web of Science, ScienceDirect, JSTOR, every journal's official website, and each published article's working paper record, there are still 65.2% of all articles without JEL codes. The phenomenon of missing JEL codes was more common in the early years. 79.6% (or 87.1%, 98.2%) of all articles on Journal of Financial Economics (JFE), JF, and RFS before 2005 (or 2000, 1995) do not have JEL codes.7 JFE is the earliest providing JEL codes among the above three journals, starting from 1994.
Third, the JEL codes are self-reported, and they often change. By comparing the JEL codes of published articles and their last version of working paper before publication, we find that 31.14% of articles changed JEL codes at least once. When we consider the different versions of working papers, the percentage of change is even higher. The JEL codes are subjective, and there is little research discussing whether the authors' classification is accurate. In this research, we provide another way to obtain an objective classification by using the unsupervised machine learning that minimizes the human input of prior knowledge. We find our algorithm-computed topics of the articles comparable to and more comprehensive than their self-reported JEL codes. Therefore, we are able to apply the machine learning algorithm on the articles without JEL codes to determine their topics.
We choose unsupervised machine learning over supervised machine learning models in this research for several reasons. First, it is not perfectly correct to use the articles with JEL codes to train a supervised machine learning model, and then apply it on the articles without JEL codes. The major problem is that the articles with JEL codes are usually more recent, and the research topics and specific words used may be different from early articles without JEL codes. Moreover, the current JEL codes system on finance research is somewhat too general and therefore does not convey detailed topic information. For example, initial public offering (IPO), one of the most important research topics in finance, is missing from the JEL system. Therefore, using supervised machine learning would misclassify all IPO papers. Second, the number of topics would be fixed by the number of JEL codes if we employed supervised machine learning models. However, the LDA along with Gibbs sampling that we use determine the optimal number of topics by the algorithm.8
In the rapidly evolving field of financial research, the proliferation of large language models (LLMs) has given rise to various commercial websites offering customized literature review services for academic research. One notable example is Elicit.9 Given the primary objective is to provide finance researchers with a comprehensive overview of the profession through topic modeling, our research offers several distinct advantages that enhance its value for finance researchers.
The commercial websites focus primarily on keyword matching and content summarization based on LLM's powerful capability to understand semantic associations. They typically require researchers to input a broad or specific topic to generate literature reviews, and they do not inherently provide insights into the most popular research topics in recent years. In contrast, we identify the fastest-growing and shrinking topics in finance research using LDA and DTM, going beyond basic keyword matching. By analyzing the historical evolution of topics' popularity, we help researchers identify current hotspots, emerging trends, and research interconnections. One innovative practice is that our research can be used in conjunction with commercial AI services. Researchers can use our findings to identify trending topics and then utilize websites like Elicit to explore and brainstorm research questions, quickly locate relevant papers, and summarize evidence from top-cited papers on those topics.
There is a substantial literature on the academic profession for several decades. Prior research has studied the ranking of academic journals and institutions (Alexander & Mabry, 1994; Chan et al., 2013; Froman, 1952; Klemkosky & Tuttle, 1977; Niemi, 1987), influence of academic journals and institutions (Borokhovich et al., 1994, 1995), ranking of academic conferences (Reinartz & Urban, 2017), design of doctoral education (Corrado & Ferris, 1997), tenure system (Zivney & Bertin, 1992), publishing process (Ellison, 2002), economic gains from publishing (Swidler & Goldreyer, 1998), bibliometric patterns between authors and publications (Chung & Cox, 1990; Cox & Chung, 1991), citation (Ellison, 2013), referee reports (Welch, 2014), author network (Azoulay et al., 2010), connections with editors (Brogaard et al., 2014; Colussi, 2018) and more. Yet the research on research topics itself was rare. The only similar research that we are aware of is the recent study of Angrist et al. (2017) on the topics of economics, but our classification of finance topics is more detailed and informative.10 We believe that our research is among the first to study the evolution of research topics in finance.
The rest of this article is organized as follows. Section 2 reviews the prior research on the academic profession. Section 3 discusses the sources and how we clean the textual data. Section 4 explains methodologies, mainly the two machine learning models—LDA and DTM. Section 5 presents our results and Section 6 concludes.
2 LITERATURE REVIEW ON RESEARCH OF ACADEMIC PROFESSION
The earliest works on the academic profession include Froman (1952), Cleary and Edwards (1960), Henry and Burch (1974), and Klemkosky and Tuttle (1977). Though methodologically simple, they provided important insights. For example, Froman (1952) generated summary statistics of graduate students in economics before the 1950s, presenting the institutions that granted the most degrees. Klemkosky and Tuttle (1977) found that the University of Chicago, the University of Pennsylvania, Stanford, and UCLA contributed most to financial research and journal publication from 1966 to 1975.
This field of research continued to emerge in the 1990s. Chung and Cox (1990) found that in an academic journal, the number of researchers who published n articles is equal to of the number of researchers who publish just one article in this journal. They estimated that c is approximately two for JF and JFE. Zivney and Bertin (1992) found that many researchers who became productive later in their careers were incorrectly screened from tenure, while many researchers who passed the mechanical screens ceased to publish following tenure. They argued that simply knowing the number of publications and where the articles appeared is insufficient for reliably predicting future research productivity. Alexander and Mabry (1994) ranked journals according to the number of citations.
Borokhovich et al. (1994) found that JF and JFE were the core influences in finance research, most journals published in a variety of research areas but were influential in a smaller number during their sample period. Borokhovich et al. (1995) found a skewed distribution of academic institutions' influence; a relatively small number of institutions contributed a majority of top journal publications and citation.
Corrado and Ferris (1997) investigated what kind of articles were used in doctoral education. Swidler and Goldreyer (1998) concluded that the top journal publication helps researchers with promotion and salary increase. They estimated that the first top finance journal publication provided the author with a then present value of between $19,493 and $33,754.
In more recent publications, Azoulay et al. (2010) found a decline of collaborators' productivity following the premature death of an academic “superstar.” Brogaard et al. (2014) showed that editors' personal connections help them screen articles in the reviewing process. Welch (2014) finds that the referees: (1) differ in their scales as some referees were intrinsically more generous than others and (2) differ in their opinions of what a good paper was as they often disagreed about the relative ordering of papers.
3 DATA
As shown in Table 1, our sample consists of 20,185 articles published on 17 academic finance journals from 1976 to 2015. We obtain each article's title, authors, affiliations, abstract, full text, references, citations and publishing date from Web of Science, supplemented with ScienceDirect,11 JSTOR, and manual search. Table 1 lists the journals and their summary statistics, including the first years that the abstracts start to exist in our sample. In this research, we only use the articles' abstracts in our models.12 We have data of RFS from 1988, the year of its first volume. JF was founded in 1946 and JFE had its first publication in 1974, but Web of Science started storing these two journals' data only from 1976. Moreover, Web of Science stores the article abstracts of JF from 1991 and the article abstracts of JFQA from 1992. We supplement the missing abstracts of JF between 1976 and 1990 and those of JFQA between 1984 and 1991 from JSTOR and manual search. Journal of Banking and Finance, Journal of International Money and Finance, Journal of Money Credit and Banking, and JFQA are also the largest contributors of articles in our sample.
| Journal | First year of abstract | Last year of abstract | Total number | Annual median | % |
|---|---|---|---|---|---|
| Journal of Banking and Finance | 1977 | 2015 | 4104 | 75 | 20.3 |
| The Journal of Finance | 1976 | 2015 | 2465 | 69 | 12.2 |
| Journal of Financial Economics | 1976 | 2015 | 2304 | 47 | 11.4 |
| Journal of International Money and Finance | 1982 | 2015 | 1627 | 49 | 8.1 |
| Review of Financial Studies | 1988 | 2015 | 1505 | 37 | 7.5 |
| Journal of Money Credit and Banking | 1997 | 2015 | 1246 | 77 | 6.2 |
| Journal of Financial and Quantitative Analysis | 1984 | 2015 | 1168 | 35 | 5.8 |
| Quantitative Finance | 2001 | 2015 | 998 | 62 | 4.9 |
| Journal of Portfolio Management | 1992 | 2015 | 908 | 39 | 4.5 |
| Journal of Futures Markets | 1981 | 2015 | 870 | 50 | 4.3 |
| Journal of Corporate Finance | 1994 | 2015 | 833 | 46 | 4.1 |
| Journal of Business Finance and Accounting | 1976 | 2015 | 558 | 47 | 2.8 |
| Journal of Empirical Finance | 1993 | 2015 | 476 | 60 | 2.4 |
| Journal of Financial Intermediation | 1990 | 2015 | 416 | 18 | 2.1 |
| Journal of Financial Markets | 1998 | 2015 | 308 | 19 | 1.5 |
| Review of Finance | 1997 | 2015 | 289 | 27 | 1.4 |
| Journal of Financial Research | 1978 | 2015 | 110 | 30 | 0.5 |
| Total | 1976 | 2015 | 20,185 | 358 | 100.0 |
- Note: Summary statistics of 20,185 articles published on 17 finance journals between 1976 and 2015. We obtain each article's title, authors, affiliations, abstract, full text, references, citations and publishing date from Web of Science, supplemented with ScienceDirect, JSTOR, and manual search. We exclude articles without abstracts in our sample. For example, The Journal of Finance (JF) and Journal of Financial Economics (JFE) in our sample starts from 1976, the year when it had abstracts in our sample for the first time. We report the first and last year that each journal started to have abstracts in our sample. We have Review of Financial Studies' data from 1988, the year of its first volume. JF was founded in 1946 and JFE had its first publication in 1974, but Web of Science started storing these two journals' data only from 1976. Moreover, Web of Science stores the article abstracts of JF from 1991 and the article abstracts of Journal of Financial and Quantitative Analysis (JFQA) from 1992. We supplement the missing abstracts of JF between 1976 and 1990 and those of JFQA between 1984 and 1991 from JSTOR and manual search. We also report the total and median number of articles published on each journal in our sample.
Our sample does not contain the finance articles published on economics or accounting journals. Many articles on these journals are not finance research. We do not selectively choose some finance articles published in economics or accounting journals to supplement our sample to avoid our subjective intervention in the algorithm's analysis. But when we input all articles published on economics or accounting journals, the algorithm generates many nonfinance topics because these journals have many nonfinance articles. Therefore, we only use the articles published on finance journals.
3.1 Textual data cleaning
This section describes the process of cleaning textual data and determining the parameters of the models in a general way.
- (1)
Tokenize the text into words, or tokens, with word tokenizer in the Natural Language Toolkit (NLTK).13
- (2)
Remove tokens that are numbers or punctuation.
- (3)
Remove tokens with length 1 such as “I,” “a,” “&,” and so forth.
- (4)
Convert all tokens to lower case.
- (5)
Remove stop words,14 which are mainly English pronouns and auxiliary verbs such as “you,” “your,” “yours,” “am,” “is,” “are,” “isn't,” and so forth.
- (6)
Stem the tokens with Porter Stemmer,15 a popular stemming algorithm in the Python library NLTK. Stemmers bring words with similar meanings to a common linguistic root. For example, “manage,” “manager,” and “management” all become “manag” after stemming. We group words with similar meanings together by stemming, which makes the final results more interpretable to humans.
- (7)
Remove tokens appearing less than five times.
- (8)
Combine the words that appear in a phrase at high frequency as one unit to process. Table A1 lists 53 phrases that we use. The most frequently appeared phrases in our textual data are “interest rate,” “United States” and “exchange rate.”
4 METHODOLOGIES
We apply unsupervised machine learning models on the textual data to categorize unobserved topics. We first obtain each abstract's probability distribution over topics and each topic's probability distribution over words using LDA (Blei et al., 2003). Compared to LDA, DTM (Blei & Lafferty, 2006) considers an additional dimension—time. We then observe how each topic's probability distribution over words evolves over time from DTM, and furthermore the evolution of word usage in each topic.
Intuitively speaking, LDA categorizes all abstracts into a number of topics. Moreover, it can analyze an abstract's quantitative distribution on different topics. For example, LDA may find that an abstract, for instance, Laeven and Levine (2009), is 12.7% on “Systematic Risk and Risk Premium,” 11% on “Shareholder Right, Ownership Structure,” 10.3% on “Commercial Banking” and 10.1% on “Financial Regulation.” The rest of percentages are distributed over other topics. Within a topic, DTM can analyze the evolution of specific interests over time.
The following subsections address the basic concepts of LDA and DTM and how we apply them to the textual data.
4.1 LDA
A collection of M abstracts is denoted by , and each abstract d with words is denoted by . The model assumes that text is generated by unobserved variables and that are to be estimated. Let V denote the number of unique words across all abstracts, and K denote the number of topics. is a V-dimension vector over V words for topic k. , the vth element in , represents the appearing probability of word v given topic k. is a K-dimension vector of probabilities over K topics for abstract d. , the kth element in , represents the percentage distribution of topic k in abstract d.
For , , and . For now assign our parameters' numerical values. We assign 's value matrix as follows:
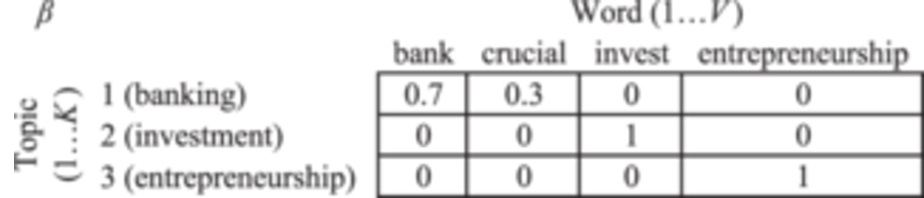
The value , or , is the probability of the word conditional on the topic. Here we set the number of topics to be 3, so is 3; we have a dictionary of 4 unique words, so is 4. The topic names are not the direct output of LDA. When we implement the machine learning strategy, the algorithm only returns the key word list for each topic. We assign topic names to facilitate the readability. For example, under the condition that the topic is 1 (banking), the word “bank” appears with probability 0.7, and “crucial” appears with probability 0.3. We could also arrange the matrix into a different representation
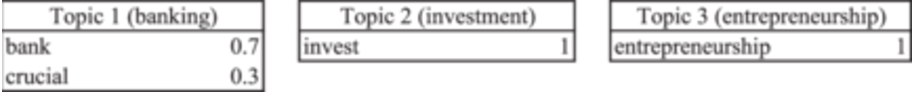
where each topic is associated with a list of words and their probabilities. We then proceed to assume as
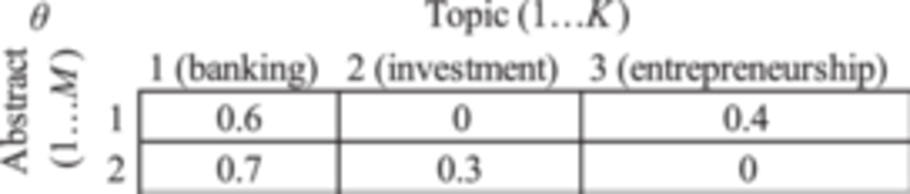
The value , or , is the percentage distribution of the topic in the abstract. We could see that abstract 1 bank crucial entrepreneurship consists of 0.6 of topic 1 (banking) and 0.4 of topic (entrepreneurship), and abstract 2 bank crucial invest consists of 0.7 of topic 1 (banking) and 0.3 of topic 2 (investment).
By adjusting the values of and , we would obtain different probability values. The goal of topic modeling and LDA is to find an optimized set of and so that the computed probability is maximized.
With the conjugation property between Dirichlet distribution and categorical distribution, this optimization of the probability of a corpus becomes tractable, and we are able to estimate the latent variables by maximum likelihood/minimum perplexity methods. and are hyperparameters of this model, and they can be tuned for different model behaviors. For example, abstracts contain fewer topics with lower and they contain more topics with higher . Following Griffiths and Steyvers (2004) and Steyvers and Griffiths (2007), we choose , and in our analysis.
Various properties of LDA are worth noting. LDA is a bag-of-words language model, where each abstract is modeled as the occurrence frequency of each word inside the abstract. This approach ignores word order and simplifies the computation complexity. Hansen et al. (2018) argue that the resulting information loss has little impact on our goal of determining the topic coverage. In addition, LDA is an “unsupervised” machine learning algorithm. This means that the algorithm requires no pre-assigned labels—it is enough to simply feed the textual data into the algorithm. This unsupervised property significantly reduces workload when processing big data.
4.2 DTM
In our experiment, we set t as the publishing year of an abstract. Therefore, each year we obtain a different , the probability of each word that appears in each topic. Then we can observe the evolution of word usage of every topic.
Apart from the discrete time DTM described above, continuous time DTM is proposed by Wang et al. (2012). Rather than being discrete, t can take on any point on a continuous timeline. While continuous time DTM is useful for high-frequency textual data, such as tweets from Twitter, it is hardly applicable in our project that mainly uses yearly data.
5 RESULTS
We apply LDA and DTM to the abstracts in 17 finance academic journals. The data set contains 20,185 abstracts and 12,046 unique words and phrases. After the cleaning process as in Section 3.1, we are left with 5332 unique words and phrases. Summary statistics of the 17 journals are listed in Table 1, including each journal's time horizon and number of articles with abstracts. For example, JF in our sample starts from 1976, the year when Web of Science started storing its data.16 Figure A1 plots the number of active journals and articles every year.
5.1 Appropriate number of topics
To determine the appropriate number of topics, we run LDA and maximize the log-likelihood and minimize the perplexity of the data from the models trained for different numbers of topics. We use Gibbs sampling to estimate the model parameters under a different number of topics, and we choose the model with the highest log-likelihood/lowest perplexity as our model in this paper. We compute the probability of a set of abstracts unseen to the estimated model at the end of the machine learning process to avoid the caveat of overfitting. The optimal number of topics should be accompanied by the highest computed probability. Figure 1 reports the log-likelihood of the data from the trained model of different numbers of topics. The number of topics with the highest likelihood is approximately 40. In implementing this approach, we find that there are topics that represent general sentences and do not indicate specific research interest. For example, a topic with keywords “relat,” “posit,” “neg,” “associ,” and “evid” may simply represent an often used general sentence “we provide evidence on a positive/negative relation/association.” Therefore, we finally choose 50 topics when implementing LDA and exclude 12 general sentence topics from them. A full list of general sentence topics is presented in Table A2.

5.2 Naming the topics
Table 2 presents each topic's top 10 keywords generated by LDA, that is, the 10 words with the highest appearing probability in each topic. We name each topic by reading the keywords and the articles that belong to it. For example, if we observe that “bank,” “loan,” “borrow,” “lend,” “commerce,” and “deposit” appear in one topic, after reading the articles belonging to this topic, we name it as “Commercial Banking”; if we observe that “ceo,” “manag,” “board,” “compens,” “incent,” “director” appear in one topic, we name it as “CEO, Board, Director.” The abstracts are categorized into 38 research topics and 12 general sentence topics.
| No. | Topic | No. of papers | 1 | 2 | 3 | 4 | 5 | 6 | 7 | 8 | 9 | 10 |
|---|---|---|---|---|---|---|---|---|---|---|---|---|
| 1 | Option Pricing | 890 | option | process | jump | stochast | underli | exercis | diffus | american | european | black schole |
| 2 | Commercial Banking | 812 | bank | loan | borrow | lend | commerci | deposit | credit | busi | securit | branch |
| 3 | CEO, Board, Director | 717 | ceo | manag | board | compens | incent | director | perform | independ | monitor | execut |
| 4 | Market Microstructure | 677 | trade | order | spread | exchang | stock | quot | bid ask | dealer | nyse | limit order |
| 5 | Central Bank, Monetary Policy | 650 | exchang rate | shock | respons | monetari polici | economi | central bank | interest rate | intervent | reserv | stabil |
| 6 | Mergers and Acquisitions | 623 | target | acquisit | merger | acquir | takeov | bid | deal | auction | announc | sharehold |
| 7 | Return Distribution and Value-at-Risk (VaR) | 599 | distribut | method | estim | var | normal | extrem | skew | tail | paramet | simul |
| 8 | News, Analyst Report, Earnings Announcement | 572 | earn | announc | news | analyst | event | report | reaction | stock | abnorm return | surpris |
| 9 | Hedge Fund, Mutual Fund | 560 | fund | manag | perform | activ | mutual fund | hedg fund | strategi | invest | fee | alpha |
| 10 | Shareholder Right, Ownership Structure | 556 | control | ownership | govern | sharehold | compani | right | protect | structur | vote | corpor |
| 11 | International Capital Markets | 521 | countri | intern | foreign | develop | domest | unit state | global | integr | region | emerg market |
| 12 | IPO | 511 | issu | ipo | offer | equiti | underwrit | initi | public | share | underpr | season |
| 13 | Capital Structure, Bankruptcy, Leverage | 487 | debt | equiti | leverag | bankruptci | capit structur | corpor | convert | claim | distress | creditor |
| 14 | Macro Finance | 484 | inflat | real | output | suppli | incom | labor | busi cycl | consum | growth | macroeconom |
| 15 | Volatility | 460 | volatil | condit | correl | dynam | varianc | regim | process | depend | garch | switch |
| 16 | Default and CDS | 448 | rate | credit | default | spread | probabl | swap | mortgag | agenc | structur | collater |
| 17 | Commodities, Futures | 436 | futur | index | hedg | contract | forward | commod | spot | deriv | oil | underli |
| 18 | Trader Behavior | 402 | trade | liquid | volum | day | trader | open | pattern | close | intraday | specul |
| 19 | Bond Term Structure | 401 | bond | term | interest rate | yield | matur | short term | term structur | call | rate | treasuri |
| 20 | Determinants of Stock Return | 384 | return | stock | excess | predict | momentum | januari | revers | anomali | cross section | season |
| 21 | Asset and Portfolio Allocation | 380 | asset | portfolio | return | diversif | varianc | alloc | mean | correl | riski | covari |
| 22 | Asset Pricing Model | 380 | expect | equilibrium | gener | uncertainti | agent | prefer | consumpt | ration | risk avers | belief |
| 23 | Financial Regulation | 380 | capit | requir | regul | insur | liabil | limit | act | deposit insur | failur | polici |
| 24 | Statistical Estimation Methodology | 375 | estim | forecast | error | predict | regress | statist | bias | paramet | variabl | coeffici |
| 25 | International Asset Pricing and Foreign Exchange | 350 | unit state | currenc | dollar | european | euro | uk | area | spillov | exchang rate | japanes |
| 26 | Venture Capital, Entrepreneurship | 336 | invest | financ | capit | decis | extern | constraint | project | opportun | ventur | entrepreneur |
| 27 | Industry Competition and Market Efficiency | 328 | effici | industri | product | profit | competit | innov | technolog | improv | cost | structur |
| 28 | Tax | 316 | tax | short | sell | loss | interest | sale | arbitrag | margin | restrict | incom |
| 29 | Financial System, Banking Crisis | 314 | financi | crisi | system | import | contagion | stabil | intermediari | global | stress | failur |
| 30 | Multifactor Model | 291 | factor | variabl | explain | variat | compon | cross section | common | specif | power | signific |
| 31 | Dividend Policy | 269 | growth | dividend | ratio | share | repurchas | polici | payout | determin | pay | cash flow |
| 32 | Information Asymmetry, Disclosure, Insider Trading | 265 | privat | public | insid | signal | disclosur | inform asymmetri | improv | transpar | reveal | avail |
| 33 | Optimal Choice Model | 252 | optim | strategi | maxim | choic | dynam | program | design | minim | condit | transact cost |
| 34 | Corporate Operational Struture and Value Creation | 248 | firm | corpor | cash flow | affect | oper | busi | examin | characterist | level | control |
| 35 | Systematic Risk and Risk Premium | 240 | risk | premium | exposur | beta | systemat | expect | idiosyncrat | equiti | sensit | adjust |
| 36 | Behavioral Finance | 208 | investor | behavior | individu | ex | ant | sentiment | dispers | tend | retail | herd |
| 37 | Corporate Cash Holding | 134 | cost | higher | lower | hold | cash | greater | level | increas | reduc | payment |
| 38 | Social Network and Cultural Effect | 112 | institut | particip | group | analysi | social | network | influenc | individu | central | affect |
- Note: Each topic's top 10 keywords with the highest appearing probabilities. The 38 topics are identified by LDA model. The methodology of LDA is detailed in Section 4.1. We name each topic by reading the keywords and the articles that belong to it. Each abstract has quantitative distribution on different topics.
- Abbreviations: IPO, initial public offering; LDA, latent Dirichlet allocation.
As we explained in the previous example of Laeven and Levine (2009), each abstract has a quantitative distribution on different topics. We define that an abstract focuses on a topic if it has over 10% distribution on it. An abstract with a higher distribution of a certain topic tends to have more keywords for that topic. An abstract may have two or more topic focuses. For example, Laeven and Levine (2009) is 12.7% on “Systematic Risk and Risk Premium,” 11% on “Shareholder Right, Ownership Structure,” 10.3% on “Commercial Banking,” and 10.1% on “Financial Regulation.” Therefore, Laeven and Levine (2009) focus on the four topics “Systematic Risk and Risk Premium,” “Shareholder Right, Ownership Structure,” “Commercial Banking,” and “Financial Regulation” by our definition.
“Option Pricing” is the topic with the most publications that focus on it, followed by “Commercial Banking,” “CEO, Board, Director,” “Market Microstructure,” “Central Bank, Monetary Policy,” and “Mergers and Acquisitions.”
Table 3 lists the most cited articles on each topic. The citation numbers were collected on February 25th, 2016. The year of publication is in the parenthesis. The number of citation is behind the comma. We present the Web of Science citation behind the author-years. In unreported table, we present the most cited articles in each topic by Google Scholar citation and find the results similar to our results using the Web of Science data.
| No. | Topic | 1 | 2 | 3 | 4 | 5 |
|---|---|---|---|---|---|---|
| 1 | Option Pricing | Heston (1993), 1684 | Cox, Ross, Rubinstein (1979), 1398 | Vasicek (1977), 1387 | Merton (1976), 1259 | Cox, Ross (1976), 842 |
| 2 | Commercial Banking | Sharpe (1990), 434 | Barth, Caprio, Levine (2004), 340 | Boot (2000), 334 | Petersen, Rajan (2002), 317 | Berger, Miller, Petersen, Rajan, Stein (2005), 268 |
| 3 | CEO, Board, Director | Yermack (1996), 975 | Weisbach (1988), 850 | Core, Holthausen, Larcker (1999), 649 | Amit, Villalonga (2006), 601 | Agrawal, Knoeber (1996), 404 |
| 4 | Market Microstructure | Lee, Ready (1991), 704 | Copeland, Galai (1983), 392 | Hamao, Masulis, Ng (1990), 366 | Glosten, Harris (1988), 355 | Huang, Stoll (1996), 275 |
| 5 | Central Bank, Monetary Policy | Eun, Shim (1989), 236 | Meese, Rogoff (1988), 217 | Sercu, Uppal, van Hulle(1995), 153 | Blanchard, Galí (2007), 149 | Thorbecke (1997), 136 |
| 6 | Mergers and Acquisitions | Jensen, Ruback (1983), 1035 | Morck, Shleifer, Vishny (1990), 497 | Bradley, Desai, Kim (1988), 385 | Moeller, Schlingemann, Stulz (2004), 335 | Shleifer, Vishny (2003), 329 |
| 7 | Return Distributionand Value-at-Risk (VaR) | Rockafellar, Uryasev (2002), 729 | Cont (2001), 506 | Longin, Solnik(2001),481 | Rubinstein (1994),407 | Jackwerth, Rubinstein (1996), 245 |
| 8 | News, Analyst Report, Earnings Announcemen | Barberis, Shleifer, Vishny (1998), 727 | Fama, French (1995), 568 | Ikenberry, Lakonishok, Vermaelen (1995), 362 | Teoh, Welch, Wong (1998), 361 | Womack (1996), 332 |
| 9 | Hedge Fund, Mutual | Fund Carhart (1997), 1910 | Sirri, Tufano (1998), 471 | Daniel, Grinblatt, Titman, Wermers (1997), 440 | Wermers (1999), 285 | Wermers (2000), 278 |
| 10 | Shareholder Right, Ownership | Structure Shleifer, Vishny (1997), 2156 | La Porta, Lopez-de-Silanes, Shleifer (1999), 2027 | La Porta, Lopez-de-Silanes, Shleifer, Vishny (1997), 1927 | Claessens, Djankov, Lang (2000), 1004 | La Porta, Lopez-de-Silanes, Shleifer, Vishny (2000), 900 |
| 11 | International CapitalMarkets | Bekaert, Harvey (1995), 465 | Coval, Moskowitz (1999), 384 | Bekaert, Harvey(2000), 354 | Claessens, Demirgüç-Kunt, Huizinga (2001), 267 | Harvey (1995), 252 |
| 12 | IPO | Loughran, Ritter (1995), 671 | Ritter (1991), 614 | Carter, Manaster (1990), 590 | Rock (1986), 544 | Megginson, Weiss (1991), 521 |
| 13 | Capital Structure, Bankruptcy, Leverage | Smith, Warner (1979), 747 | Rajan (1992), 735 | Titman, Wessels (1988), 702 | Leland (1994), 467 | Deangelo, Masulis (1980), 411 |
| 14 | Macro Finance | Schwert (1989), 680 | Estrella, Hardouvelis (1991), 339 | Constantinides, Ferson (1991), 182 | Blanchard, Galí (2007), 149 | McCallum, Nelson (1999), 143 |
| 15 | Volatility | Glosten, Jagannathan, Runkle (1993), 1407 | Engle, Ng (1993), 798 | Andersen (2001), 484 | Pan (2002), 394 | Campbell, Hentschel (1992), 392 |
| 16 | Default and CDS | Jarrow, Lando, Turnbull (1997), 292 | Longstaff, Mithal, Neis (2005), 281 | Blanco, Brennan, Marsh (2005), 185 | Bharath, Shumway (2008), 181 | Crouhy, Galai, Mark (2000), 174 |
| 17 | Commodities, Futures | Black (1976), 712 | Schwartz (1997), 464 | Gibson, Schwartz (1990), 259 | Fama (1984), 221 | Stoll, Whaley (1990), 207 |
| 18 | Trader Behavior | Admati, Pfleiderer (1988), 704 | Brunnermeier, Pedersen (2009), 495 | French, Roll (1986), 481 | Easley, O'Hara (1987), 475 | de Long, Shleifer, Summers, Waldmann (1990), 405 |
| 19 | Bond Term Structure | Vasicek (1977), 1387 | Fama, French (1989), 779 | Chan, Karolyi, Longstaff, Sanders (1992), 489 | Longstaff, Schwartz (1995), 470 | Leland (1994), 467 |
| 20 | Determinants of Stock Return | Jegadeesh, Titman (1993), 1400 | Fama, French (1996), 1065 | Debondt, Thaler (1985), 1032 | Amihud (2002), 875 | French, Schwert, Stambaugh (1987), 823 |
| 21 | Asset and Portfolio Allocation | Demiguel, Garlappi, Uppal (2009), 252 | Jagannathan, Ma (2003), 205 | Best, Grauer (1991), 170 | Chopra, Ziemba (1993), 167 | Kim, Omberg (1996), 160 |
| 22 | Asset Pricing Model | Breeden (1979), 713 | Stulz (1981), 209 | Diamond, Verrecchia (1981), 196 | Breeden, Gibbons, Litzenberger (1989), 171 | Sundaresan (1989), 147 |
| 23 | Financial Regulation | Barth, Caprio, Levine (2004), 340 | Karpoff, Lee, Martin (2008), 137 | Marcus (1984), 127 | Buser, Chen, Kane (1981), 116 | Dahl, Shrieves (1992), 106 |
| 24 | Statistical EstimationMethodology | Petersen (2009), 1413 | Barber, Lyon (1997), 526 | Dimson (1979),492 | Stambaugh (1999), 350 | Hodrick (1992),306 |
| 25 | International Asset Pricing and Foreign Exchange | Hamao, Masulis, Ng (1990), 366 | Dittmar, Neely, Weller (1997), 189 | Peel, Taylor (2000), 185 | Lins, Servaes (1999), 137 | Cheung, Chinn (2001), 131 |
| 26 | Venture Capital, Entrepreneurship | Sahlman (1990), 586 | Hellmann, Puri (2002), 354 | Hellmann, Puri (2000), 249 | Hsu (2004), 230 | Gompers (1995), 198 |
| 27 | Industry Competition and Market Efficiency | Claessens, Laeven (2004), 218 | Klapper, Laeven, Rajan (2006), 211 | Berger, Deyoung (1997), 204 | Bonin, Hasan, Wachtel (2005), 188 | Gold, Sherman (1985), 183 |
| 28 | Tax | Shefrin, Statman (1985), 478 | Lakonishok, Shleifer, Vishny (1992), 317 | Claessens, Demirgüç-Kunt, Huizinga (2001), 267 | Grinblatt, Keloharju (2001), 209 | Miller, Scholes (1978), 205 |
| 29 | Financial System, Banking Crisis | Rajan, Zingales (2003), 601 | Beck, Levine, Loayza (2000), 530 | Allen, Qian, Qian (2005), 442 | Hoshi, Kashyap, Scharfstein (1990), 297 | Faccio, Masulis, McConnell (2006), 243 |
| 30 | Multifactor Model | Fama, French (1993), 3481 | Fama, French (1992), 2381 | Jagannathan, Wang (1996), 444 | Harvey, Siddique (2000), 373 | Daniel, Titman (1997), 353 |
| 31 | Dividend Policy | La Porta, Lopez-de-Silanes, Shleifer, Vishny (2000), 431 | Fama, French (2001), 425 | Fama, French (2002), 393 | Brav, Graham, Harvey, Michaely (2005), 272 | Grullon, Michaely (2002), 232 |
| 32 | Information Asymmetry, Disclosure, Insider Trading | Diamond, Verrecchia (1991), 425 | Easley, O'Hara (2004), 395 | Seyhun (1986), 247 | Froot, Scharfstein, Stein (1992), 220 | Blume, Easley, O'Hara (1994), 211 |
| 33 | Optimal Choice Model | Grossman, Hart (1988), 304 | Admati, Pfleiderer (1994),179 | Harris, Raviv (1988), 170 | Jorion (1986), 168 | Kroll, Levy, Markowitz (1984), 143 |
| 34 | Corporate Operational Struture and Value Creation | Morck, Shleifer, Vishny (1988), 1452 | Claessens, Djankov, Lang (2000), 1004 | Almeida, Campello, Weisbach (2004), 319 | Campa, Kedia (2002), 305 | Coles, Daniel, Naveen (2008), 302 |
| 35 | SystematicRiskand Risk Premium | Harvey, Siddique (2000), 373 | Acerbi, Tasche (2002), 293 | Harvey (1991), 265 | Laeven, Levine (2009), 263 | Ferson, Harvey (1993),240 |
| 36 | Behavioral Finance | Odean (1998), 586 | Shefrin, Statman (1985), 478 | Barber, Odean (2008), 303 | Grinblatt (2000), 294 | Lee, Shleifer, Thaler (1991), 182 |
| 37 | Corporate Cash Holding | Opler (1999), 394 | Harford (1999), 232 | Bates, Kahle, Stulz (2009), 190 | Harford, Mansi, Maxwell (2008), 163 | Dittmar, Mahrt-Smith, Servaes (2003), 145 |
| 38 | Social Network and Cultural Effect | Hong, Kubik, Stein (2004), 216 | Boss, Elsinger, Summer, Thurner (2004), 116 | Hong, Kacperczyk (2009), 102 | Blinder, Morgan (2005), 81 | Brown, Ivković, Smith, Weisbenner (2008), 74 |
- Note: The most cited articles in each topic. The 38 topics are identified by LDA model. The methodology of LDA is detailed in Section 4.1. The citation numbers are collected on February 25, 2016. The year of publication is in the parenthesis. The author name or the names of coauthors are before the parenthesis. We present Web of Science citation behind the parenthesis.
- Abbreviations: IPO, initial public offering; LDA, latent Dirichlet allocation.
5.3 Historical trend of topics

We observe that the research interest in “Financial System, Banking Crisis” often spiked around or after the financial crises, such as the savings and loan crisis in the late 1980s and early 1990s. It grew even faster after the 2008 financial crisis. The research interest of “CEO, Board, Director” has been growing stably in the past 40 years. Other topics that attracted more attention include “Behavioral Finance,” “Central Bank, Monetary Policy,” “Commercial Banking,” “Corporate Cash Holding,” “Hedge Fund, Mutual Fund,” “International Capital Markets,” “Social Network and Cultural Effect,” “Venture Capital, Entrepreneurship,” and “Volatility.” The research interest in topics like “Bond Term Structure” and “Optimal Choice Model” has been shrinking.
For topics that have garnered increased attention, the reasons for their rise can be classified into two categories. The first category is heightened interest in traditional research questions. For example, during and after the financial crisis, researchers focused more on the impact of the crisis. Therefore, the popularity of “Financial System, Banking Crisis” often spiked around events such as the savings and loan crisis in the late 1980s and early 1990s, and the 2008 financial crisis.
The second category is the emergence of new research questions. For instance, by the 1980s and 1990s, CEOs began to face tough decisions such as shuttering operations, relocating manufacturing overseas, and orchestrating key mergers. Additionally, the rise of cable news required CEOs to communicate directly with investors and customers. This evolution in the CEO's role led to a growing research interest in “CEO, Board, Director.” Similarly, mutual funds gained significant investor attention in the 1980s and 1990s, and the number of hedge funds surged during the 1990s, driven by the new wealth created by the unprecedented bull run in the equity markets. Thus, research interest in “Hedge Fund, Mutual Fund” increased in the 1980s and grew substantially in the 1990s.
It is worth noting that high fluctuation of values exists in the 1970s and 1980s for most of the topics. Figure A1 plots the number of active journals and articles every year. In the 1970s and 1980s, there were fewer journals and articles, resulting in more volatile values. Figure A2 plots the yearly publication numbers in JF, JFE, and RFS. Zivney and Bertin (1992) explain that the output has become constant since the 1980s, following rapid growth in the number of journals and articles published in the 1960s and 1970s. Our results show continuous growth in the number of journals and articles after the 1990s.
5.3.1 Topics with fastest growth and contraction
Figure 3A plots three fastest-growing and three fastest-shrinking topics in 17 journals. The topics are identified by LDA. The horizontal axis represents the year of publication. The vertical axis represents the popularity of the given topic, calculated as the average percentage of each article's percentage distribution on that topic. “Financial System, Banking Crisis,” “Hedge Fund, Mutual Fund,” and “Social Network and Cultural Effect” grew fastest from 2006 to 2015. “Market Microstructure,” “IPO,” and “Option Pricing” experienced the greatest contraction during the same period.

Figure 3B plots the topics with fastest popularity increase and a decrease in JF, JFE, and RFS. “Social Network and Cultural Effect,” “Default and CDS,” and “CEO, Board, Director” grew fastest from 2006 to 2015. “IPO,” “News, Analyst Report, Earnings Announcement,” and “Determinants of Stock Return” experienced the most contraction during the same period.

5.3.2 Working papers
For many articles, there is a time lag between its first circulation and final publication. Sometimes the lag can be several years. Therefore, the trend of the published articles that we show in Figure 3 may not reflect the most recent dynamics of finance research. To address this concern, we apply the LDA model trained from published articles on 130,547 working paper abstracts that we obtained from the SSRN Financial Economics Network. We do not use working papers uploaded to IDEAS because IDEAS does not distinguish working papers in finance from those in economics.
We present three fastest-growing and three fastest-shrinking topics among working papers in Figure 4, which is similar to Figure 3. Figure 4 reports the rise and fall of each topic's popularity from 2006 to 2015. The horizontal axis represents the year of publication. The vertical axis represents the popularity of the given topic, calculated as the average percentage of an article's distribution on that topic.

Working papers on “Social Network and Cultural Effect,” “News, Analyst Report, Earnings Announcement,” and “International Capital Markets” grew fastest from 2006 to 2015. “Market Microstructure,” “Macro Finance,” and “Statistical Estimation Methodology” experienced the greatest contraction during the same period.
5.3.3 JEL classification codes
In some journals such as JFE and RFS, JEL codes are reported when articles are published. In other journals such as JF and JFQA, JEL codes are not reported in published articles.
We compare our algorithm-computed topics of the articles and their self-reported JEL codes in this section by listing the most reported JEL codes of each topic, shown in Table 4. We list five most reported JEL codes in articles belonging to each topic, among the 190 (=5 × 38) JEL codes, 161 of them are in G category (Financial Economics).
| Topic | Most reported JEL codes | ||||
|---|---|---|---|---|---|
| 1 | 2 | 3 | 4 | 5 | |
| Option Pricing | G13 | G12 | G11 | G14 | C63 |
| Commercial Banking | G21 | G28 | G32 | G34 | G24 |
| CEO, Board, Director | G34 | G32 | G30 | J33 | G38 |
| Market Microstructure | G14 | G15 | G12 | G10 | G18 |
| Central Bank, Monetary Policy | F31 | F41 | E52 | E58 | F32 |
| Mergers and Acquisitions | G34 | G32 | G14 | G21 | G30 |
| Return Distribution and Value-at-Risk (VaR) | G12 | G11 | G13 | C14 | G21 |
| News, Analyst Report, Earnings Announcement | G14 | G24 | G12 | M41 | G11 |
| Hedge Fund, Mutual Fund | G11 | G23 | G12 | G14 | G20 |
| Shareholder Right, Ownership Structure | G32 | G34 | G38 | G30 | G21 |
| International Capital Markets | G15 | F36 | G11 | F21 | G21 |
| IPO | G24 | G32 | G14 | G30 | G34 |
| Capital Structure, Bankruptcy, Leverage | G32 | G33 | G34 | G13 | G31 |
| Macro Finance | F41 | E31 | G12 | E52 | G11 |
| Volatility | G12 | C32 | C22 | G13 | G10 |
| Default and CDS | G21 | G12 | G13 | G33 | G28 |
| Commodities, Futures | G13 | G15 | G11 | G14 | G12 |
| Trader Behavior | G14 | G12 | G15 | G10 | D82 |
| Bond Term Structure | G12 | E43 | G13 | G32 | G11 |
| Determinants of Stock Return | G12 | G14 | G11 | G10 | G15 |
| Asset and Portfolio Allocation | G11 | G12 | G23 | G15 | D81 |
| Asset Pricing Model | G12 | G11 | G14 | G13 | G10 |
| Financial Regulation | G21 | G28 | G22 | G32 | G11 |
| Statistical Estimation Methodology | G12 | C22 | G14 | C53 | G11 |
| International Asset Pricing and Foreign Exchange | F31 | G15 | F36 | G12 | G14 |
| Venture Capital, Entrepreneurship | G32 | G31 | G24 | G34 | G30 |
| Industry Competition and Market Efficiency | G21 | G28 | G32 | G34 | D24 |
| Tax | G14 | G12 | G32 | G11 | G34 |
| Financial System, Banking Crisis | G21 | G01 | G28 | G15 | F3 |
| Multifactor Model | G12 | G11 | G14 | G15 | G10 |
| Dividend Policy | G35 | G32 | G34 | G12 | G14 |
| Information Asymmetry, Disclosure, Insider Trading | G14 | G32 | D82 | G21 | G24 |
| Optimal Choice Model | G11 | C61 | D81 | G32 | G12 |
| Corporate Operational Struture and Value Creation | G32 | G34 | G30 | G31 | G38 |
| Systematic Risk and Risk Premium | G12 | G11 | G21 | G32 | G13 |
| Behavioral Finance | G11 | G14 | G12 | G15 | G10 |
| Corporate Cash Holding | G32 | G31 | G34 | G21 | D12 |
| Social Network and Cultural Effect | G11 | G32 | G14 | G12 | G34 |
- Note: The five most reported JEL codes in the articles belonging to each topic. The 38 topics are identified by LDA model. The methodology of LDA is detailed in Section 4.1. For each topic, we first find all articles that have at least 10% distribution on it, put together the JEL codes reported on those articles, and count the number of each JEL code. Then we present the five most reported JEL codes for each topic.
- Abbreviations: IPO, initial public offering; LDA, latent Dirichlet allocation.
In some algorithm-computed topics, JEL codes that are not in the G category (Financial Economics) are also among the most reported. For example, in the topic of “CEO, Board, Director,” J33 (Compensation Packages, Payment Methods) in J category (Labor and Demographic Economics) is also one of the most reported JEL code, reminding the group of research in CEO compensation. In the topic of “International Asset Pricing and Foreign Exchange,” F31 (Foreign Exchange) and F36 (Financial Aspects of Economic Integration) in F3 category (International Finance) are two of the five most reported JEL codes. In the topic of “Statistical Estimation Methodology,” two JEL codes in C category (Mathematical and Quantitative Methods) are among the five most reported JEL codes.
“Central Bank, Monetary Policy” is the only topic that does not have any of its five most reported JEL codes in G category. Instead, two are in E category (Macroeconomics and Monetary Economics) and three are in F category (International Finance). The two JEL codes in E category are E52 (Monetary Policy) and E58 (Central Banks and Their Policies). The three JEL codes in F category are F31 (Foreign Exchange), F41 (Open Economy Macroeconomics), and F32 (Current Account Adjustment, Short-Term Capital Movements).
We find our algorithm-computed topics of the articles and their self-reported JEL codes comparable. Therefore, we are able to apply the unsupervised machine learning algorithm on the articles without JEL codes to determine their topics.
5.3.4 Evolution of research interests within topics
Table 5 reports the results of the DTM: the evolution of interest within topics. We report the results every 5 years. When implementing DTM, we use 50 topics and the same hyperparameters as we used with LDA to produce comparable results with our LDA results. In Table 5, The words under each period are ranked by its frequency; words in higher positions are more frequently appearing words.
| 1976 | 1980 | 1985 | 1990 | 1995 | 2000 | 2005 | 2010 | 2015 |
|---|---|---|---|---|---|---|---|---|
| Panel A: CEO, board, director | ||||||||
| corpor | corpor | manag | manag | manag | control | compani | sharehold | ceo |
| manag | manag | corpor | sharehold | sharehold | ownership | control | ceo | sharehold |
| control | control | sharehold | corpor | control | manag | sharehold | corpor | board |
| sharehold | sharehold | control | control | ownership | compani | corpor | compani | compens |
| compani | compani | compani | compani | corpor | sharehold | board | board | incent |
| ownership | ownership | ownership | ownership | compani | corpor | incent | incent | corpor |
| compens | compens | compens | compens | compens | incent | compens | compens | compani |
| incent | incent | incent | incent | incent | compens | ownership | control | director |
| plan | vote | vote | manageri | manageri | board | ceo | govern | execut |
| vote | plan | manageri | plan | outsid | manageri | manag | director | famili |
| Panel B: Determinants of stock return | ||||||||
|---|---|---|---|---|---|---|---|---|
| return | return | return | return | return | return | return | return | return |
| stock | stock | stock | stock | stock | stock | stock | stock | stock |
| month | month | month | revers | revers | revers | revers | momentum | momentum |
| season | januari | januari | month | month | past | momentum | cross-sect | cross-sect |
| januari | season | season | season | past | low | past | revers | revers |
| revers | revers | revers | januari | low | momentum | low | low | low |
| inconsist | inconsist | past | past | cross-sect | month | cross-sect | past | past |
| past | past | averag | cross-sect | season | cross-sect | month | month | predict |
| averag | averag | inconsist | low | januari | explain | explain | explain | month |
| anomali | anomali | cross-sect | averag | explain | averag | book-to-market | averag | explain |
| Panel C: Commercial banking | ||||||||
|---|---|---|---|---|---|---|---|---|
| bank | bank | bank | bank | bank | bank | bank | bank | bank |
| deposit | deposit | deposit | deposit | system | system | system | system | system |
| system | system | system | system | regul | competit | competit | competit | regul |
| requir | requir | requir | requir | deposit | regul | regul | regul | competit |
| competit | competit | competit | regul | requir | requir | requir | requir | lend |
| regul | regul | regul | competit | competit | deposit | deposit | lend | requir |
| oper | oper | oper | oper | insolv | oper | lend | deposit | network |
| balanc | balanc | failur | failur | failur | failur | oper | oper | deposit |
| failur | failur | branch | insolv | oper | lend | failur | network | oper |
| branch | branch | balanc | branch | entri | entri | network | faliur | interbank |
- Note: The evolution of interest within topics by listing the high-frequency words in different years from Dynamic Topic Model (DTM) analysis. The methodology of DTM is detailed in Section 4.2. We report the results every 5 years. When implementing DTM, we use 50 topics and the same hyperparameters as we used with latent Dirichlet allocation (LDA) to produce comparable results with our LDA results. The words under each period are ranked by its frequency; words in higher positions are more frequently appearing words. In each column, words in higher positions are more frequently appearing words. We highlight the words that we explain in the text. In Panel A, the topic of “CEO, Board, Director,” the use of “manager/management” and “control” declined after 2000, while the research of “CEO” and “board” rose. In Panel B, the topic of “Determinants of Stock Return,” the January effect was once a top theme before 1995. Since 2000, the January effect has not been on the list of the most frequent words. Instead, “momentum” and “cross-section” rank higher over years. In Panel C, the topic of “Commercial Banking,” we observe the rise of research interest in lending and network, accompanied with a decline of deposit.
In Panel A, the topic of “CEO, Board, Director,” the use of “manager/management” and “control” declined after 2000, while the research of “CEO” and “board” rose.
In Panel B, the topic of “Determinants of Stock Return,” the January effect was once a top theme before 1995. Since 2000, the January effect has not been on the list of the most frequent words. Instead, “momentum” and “cross-section” rank higher over the years.
In Panel C, the topic of “Commercial Banking,” we observe the rise of research interest in lending and network, accompanied by a decline of deposit.
5.3.5 The trend of cross-topic research
Figure 5 presents the trend of published articles' research interest concentration. The solid line represents the average Herfindahl Index of abstracts in 17 journals; the dashed line represents the average Herfindahl Index of abstracts in JF, JFE, and RFS. The average Herfindahl Index dropped sharply from 1976 to 1982, perhaps because many topics' pioneering works started to emerge during the early period and therefore cross-topic research were more common. The two lines went up between 1982 and 2000, indicating that on average research becomes narrower. One possible explanation is that many topics matured and the literature was established after two decades' development, and researchers made a more incremental contribution. The average Herfindahl Index of abstracts in 17 journals continued to increase after 2000 while that in the three top journals tended to remain at a constant level and even declined after 2010, indicating that the three top journals still publish more broad and cross-topic articles.

5.4 Citation network between topics
To understand how topics relate to each other and the “distance” between the topics, we use the cross-reference data of each article to construct a citation network between topics. In Figure 6, there are 38 nodes, and each of them represents a topic. A node's size is proportional to the number of articles that focus on the topic that the node represents. Topics with more articles have larger nodes.

The nodes are connected through edges. An edge represents the cross-reference between the two topics. An edge is thicker if there is more cross-reference. For example, if topic A has articles, in total the articles cite articles in topic B for times, where is the number of times that article cites articles in topic B. Similarly, if topic B has articles, in total the articles cite articles in topic A for times, where is the number of times that article cites articles in topic A. Then the total number of cross-reference is and is proportional to the thickness of the edge between A and B.
Each node is positioned by a force-directed gravity algorithm called “Force Atlas 2,” and the node is in a position when the forces from each edge's direction are balanced (Jacomy et al., 2014). Intuitively speaking, the algorithm assumes a force to push every node outward from the centre; the algorithm also allows every node to exert gravity on its connected nodes and drive them inward. Each node is connected with other nodes via edges. A thicker edge represents greater gravity. If a topic (node A) has a small cross-reference (thin edge) with another topic (node B) and a large cross-reference (thick edge) with the third topic (node C), then node A will exert larger gravity on node C. Therefore, the topics with more cross-reference will be “attracted” closer by their connected edges. The network structure dynamically evolves and eventually reach an equilibrium where the topics with more cross-reference cluster. Therefore, the relative position of the nodes is determined by the algorithm, not chosen by ourselves. The distance between two nodes approximately represents how close the two topics are related in terms of cross-reference.
We conduct modularity analysis to categorize the topics into clusters based on the computation of the distance and attraction between the nodes. The number of clusters is determined by the modularity analysis algorithm, and 38 topics are compartmentalized into five clusters, or “territories”: asset pricing, corporate finance, market microstructure, banking, and macro finance, and “mixed areas.” Each node's color reflects the territory it belongs to.
The left side18 of Figure 6 is clustered with corporate finance topics, including large topics such as “CEO, Board, Director,” “Mergers and Acquisitions,” “Shareholder Right, Ownership Structure,” and “IPO.” The bottom side is clustered with banking and macrofinance topics, including large topics such as “Commercial Banking,” “Central Bank, Monetary Policy,” “Financial System, Banking Crisis,” and “Financial Regulation.” The right side is clustered with asset pricing topics, including large topics such as “Option Pricing,” “Volatility,” “Return Distribution and Value-at-Risk (VaR),” and “Bond Term Structure.” The central side is clustered with market microstructure topics, including large topics such as “Market Microstructure,” “Trader Behavior,” and “Information Asymmetry, Disclosure, Insider Trading.” The upper side is clustered with “mixed areas,” including large topics such as “Hedge Fund, Mutual Fund,” “News, Analyst Report, Earnings Announcement,” “Behavioral Finance,” and “Statistical Estimation Methodology.”
This figure may be too obvious to senior finance researchers, but perhaps useful to junior researchers, PhD students, researchers of other economics areas, and the general public who are interested in this profession.
5.5 Bibliometric regularity
Figure 7 presents a bibliometric regularity: the number of researchers covering n topics is around twice the number of researchers covering n + 1 topics. A researcher covers a topic if she publishes at least one article with over 10% distribution on that topic. The horizontal axis of Figure 7 represents the number of topics, and the vertical axis represents the number of researchers.

The solid line is generated from our data, which is downward sloping because fewer researchers are able to cover more topics. The value of each point on the line indicates how many researchers cover exactly how many topics. For example, the first point on the solid line is (1, 6830), meaning that 6830 researchers publish articles that focus on just one topic. The second point is (2, 3507), meaning that 3507 researchers publish articles that focus on just two topics. We use the dashed line to fit the solid line, where y is the number of researchers covering n topics. When , ; when , . The R2 value of the fitting is 0.998.
Our findings suggest a specific regularity in the way researchers allocate their focus across different topics, reminiscent of power law (PL)—a number of regularities observed in various domains of economics and finance. A PL represents a relationship of the form , where Y and X are variables of interest, is the PL exponent, and k is typically a constant. Gabaix (2009) illustrates how PLs manifest in a myriad of economic and financial metrics, from city sizes to income distribution, and stock market fluctuations. Moreover, the pattern we identified follows the relation of , where Y and X are variables of interest, and k is typically a constant. This resemblance suggests that we have discovered a new form of PL. It not only aligns our observations with well-established economic principles but also provides a deeper theoretical framework that enhances the robustness of the patterns observed in our analysis, enriching our comprehension of research dynamics.
6 CONCLUSION
How did the finance research topics evolve in the past 40 years? In this article, we apply an LDA model on 20,185 abstracts of finance articles published between 1976 and 2015 and identify 38 research topics. We present the fastest-growing topics of published articles and working papers in the past decade. For example, publications on “Financial System, Banking Crisis” and “Hedge Fund, Mutual Fund” grew the fastest from 2006 to 2015, while working papers on “Social Network, Cultural Effect” and “News, Analyst Report, Earnings Announcement” grew the fastest during the same period. We use citation network to present how topics are related, and cluster the topics in five “territories”: asset pricing, corporate finance, market microstructure, banking, and macrofinance, and “mixed areas” including “Social Network, Cultural Effect,” “Venture Capital, Entrepreneurship,” and and so forth. We find our algorithm-computed topics of the articles and their self-reported JEL codes comparable, which implies that our algorithm can be used to categorize the articles without JEL codes. Moreover, we find a strong bibliometric regularity: the number of researchers covering n topics is about twice the number of researchers covering n + 1 topics. We also find that on average a finance publication has been covering fewer topics and therefore becomes narrower over the years. To the best of our knowledge, it is among the first machine learning research of finance academic publication. Overall, we hope that our study may be beneficial to those who desire to have an overview of this academic profession and inspire more cross-topic research.
AUTHOR CONTRIBUTIONS
Po-Yu Liu: Data curation; formal analysis; methodology; writing—original draft; writing—review and editing. Zigan Wang: Conceptualization; funding acquisition; project administration; supervision; writing—review and editing.
ACKNOWLEDGMENTS
We are very grateful for the comments of Jay Ritter, Andrea Prat, Glenn Ellison, Daniel Paravisini, Pedro Matos, Leonid Kogan, William Mann, Yingyi Qian, Michael Weisbach, Robert McDonald, Roni Michaely, Alex Edmans, Philip Strahan, Sheridan Titman, Patrick Bolton, Stephen A. Karolyi, Warren Bailey, Kelly Shue, seminar audience at Tsinghua University, HKU-SUSTech Joint Research Symposium, Southern University of Science and Technology, and The Inaugural Conference on Intelligent Information Retrieval in Accounting and Finance. We thank Mengxin Yang for research assistance. All errors are ours. Zigan Wang acknowledges the support of the Hong Kong General Research Fund (No. 17503722), NSFC HY Working Fund (No. 03070100001), Tsinghua SIGS Basic Support Fund (No. 07010100003), and Tsinghua SIGS Research Support Fund (No. 01030100049).
CONFLICT OF INTEREST STATEMENT
The authors declare no conflict of interest.
ETHICS STATEMENT
The authors have nothing to report.
APPENDIX
| Words commonly appearing together | |
|---|---|
| interest rate | limit order |
| unit state | fama french |
| exchang rate | foreign exchang |
| cross section | impli volatil |
| real estat | advers select |
| cash flow | cross border |
| monetari polici | capit structur |
| mutual fund | price discoveri |
| bid ask | brownian motion |
| mont carlo | random walk |
| short term | deposit insur |
| black schole | emerg market |
| abnorm return | institut investor |
| time seri | short run |
| transact cost | risk neutral |
| risk avers | financi distress |
| time vari | yield curv |
| term structur | agenc cost |
| inform asymmetri | feder reserv |
| corpor govern | asymmetr inform |
| financi crisi | cross list |
| hedg fund | ventur capitalist |
| busi cycl | standard deviat |
| moral hazard | tender offer |
| central bank | initi public offer |
| hong kong | chief execut offic |
| balanc sheet | |
- Note: Words that appear in a phrase at high frequency. Words presented here are processed by stemming. For the last two three-word set “chief executive officer” and “chief executive officer” we combine them into “ipo” and “ceo” respectively in our textual data cleaning.
| No. | 1 | 2 | 3 | 4 | 5 | 6 | 7 | 8 | 9 | 10 |
|---|---|---|---|---|---|---|---|---|---|---|
| 1 | valu | discount | econom | show | present | base | fundament | journal | number | multipl |
| 2 | test | adjust | run | hypothesi | data | power | statist | reject | mean | deviat |
| 3 | relat | posit | neg | level | associ | signific | evid | examin | consist | document |
| 4 | approach | framework | propos | appli | properti | discuss | present | methodolog analysi | practic | |
| 5 | differ | import | role | determin | type | across | play | structur | rel | characterist |
| 6 | larg | small | averag | size | year | point | sampl | number | rel | period |
| 7 | empir | evid | support | theori | predict | provid | consist | hypothesi | theoret | explan |
| 8 | increas | chang | decreas | declin | follow | shift | becom | reduc | experi | rise |
| 9 | research | studi | may | literatur | previou | recent | due | exist | suggest | argu |
| 10 | time | period | data | set | analysi | studi | observ | show | continu | provid |
| 11 | perform | measur | base | sampl | indic | compar | improv | better | differ | studi |
| 12 | effect | impact | studi | signific | affect | show | examin | investig | lead | direct |
- Note: 12 topics that represent general sentences. For example, a topic with keywords “relat,” “posit,” “neg,” “associ,” and “evid” may simply represent an often used general sentence “we provide evidences on a positive/negative relation/association.” The topics are identified by latent Dirichlet allocation (LDA) model. The methodology of LDA is detailed in Section 4.1.


REFERENCES
- 1 Textual analysis has been used in finance literature to process textual data of media news (e.g., Tetlock, 2007; Tetlock et al., 2008), financial disclosures (e.g., Loughran & McDonald, 2011, 2014), Form S-1 on IPO SEC filings (e.g., Loughran & McDonald, 2013), product descriptions (e.g., Hoberg & Phillips, 2010), and so forth. As far as we know, the textual analysis has not been applied to the finance academic research itself to categorize the topics and analyze the connections between papers.
- 2 As of January 1, 2018, the LDA article by Blei et al. (2003) has been cited 21,464 times on Google Scholar.
- 3 We also used the full text of all articles as input of the model. Due to noisier information in the full text compared to abstracts such as discussion of prior literature, the topics generated only using abstracts are better categorized.
- 4 More rigorously, the published research is categorized into 50 topics including 12 general sentence topics that do not indicate specific research interest. For example, a topic with keywords “relat,” “posit,” “neg,” “associ,” and “evid” may represent an often used general sentence “we provide evidence on a positive/negative relation/association”. See Sections 3.1 and 5.1 for detailed explanation.
- 5 The January effect is a hypothesis that there is a seasonal increase in stock prices during the month of January.
- 6 It is similar for other journals. For example, Journal of Banking and Finance had its first volume in 1977 but started providing JEL codes in 1993; Journal of Futures Markets had its first volume in 1981 but only some of its articles started providing JEL codes in 2013.
- 7 73.9% (or 82.0%, 96.5%) of all published articles before 2005 (or 2000, 1995) do not have JEL codes.
- 8 As shown in Section 5.1 and Figure 1, the optimal number of topics should be accompanied by the highest computed log-likelihood (also the lowest perplexity) of the data from the trained model.
- 9 Elicit is an AI tool to assist researchers in obtaining comprehensive literature reviews. See https://elicit.com/ for more information.
- 10 Different from our approach, Angrist et al. (2017) use JEL to train the sample and obtain ten general categories of micro, metrics, macro, public finance, international, labor, finance, IO, development and miscellaneous.
- 11 ScienceDirect database is mainly used to get more detailed author names and abstracts of the articles published by Elsevier. JF and JFQA are not published by Elsevier.
- 12 We also conducted the analysis using full-text data. In categorizing the topics, the effect of using abstracts is better than using full texts that contain noisier information such as the discussion of prior literature.
- 13 NLTK is an open-source Python library for English natural language processing. See http://www.nltk.org/ for more information.
- 14 In computing, stop words are words being filtered out before processing of natural language text, which usually refer to the most common words. The list of stop words is at http://snowball.tartarus.org/algorithms/english/stop.txt.
- 15 For the details of Porter Stemmer, see https://tartarus.org/martin/PorterStemmer/ for more information.
- 16 JF was founded in 1946 and JFE had its first publication in 1974, but Web of Science starts storing these two journals’ data only from 1976. Moreover, Web of Science stores the article abstracts of JF from 1991 and the article abstracts of JFQA from 1992. Table 1 lists the journals and their summary statistics, including the first years that Web of Science stores the abstracts. We supplement the missing abstracts of JF between 1976 and 1990 and those of JFQA between 1984 and 1991 from JSTOR and manual search.
- 17 We also computed where is the total number of articles that focus on topic i in year t and obtain robust results.
- 18 The “Force Atlas 2” force-directed gravity algorithm only determines the relative position of nodes. The network can be rotated clockwise or counter-clockwise. Here the left, right, upper and bottom sides are only for explanatory purpose on Figure 6.