Cross-affiliation collaboration and power laws for research output of institutions: Evidence and theory from top three finance journals
Abstract
Cross-affiliation emerges as a new and fast-developing means to promote collaboration in financial research. We find that the average number of affiliations reported per author in the top-three finance journals increases steadily from 1.1 to 1.3 from 1995 to 2016. Scale-free power laws characterize the resulting highly-skewed distributions of top finance journal publications of worldwide institutions. We propose an explanation of the scale-invariance, based on a network model featuring nonlinear growth and linear preferential attachment. The model indicates that success-breeds-success engenders 87% of total publications and hence the dispersion in research output, while accelerated growth of collaboration reduces the heterogeneity.
1 INTRODUCTION
Recent decades have witnessed the fast growth of research collaboration in social sciences (see, e.g., Buyalskaya et al., 2021; Moody, 2004; Van Noorden, 2015). In Economics, in particular, Goyal et al. (2006) pioneer coauthor networks of economists and demonstrate that the social distance between economists who publish in journals declines significantly during 1970–2000. The three coauthor networks of economists, one for each decade, display small-world properties of Watts (1999). In additional to formal collaboration through coauthorship, Laband and Tollison (2000) point out that informal intellectual collaboration through commenting on a paper or discussing it at workshops, seminars, or conferences is also commonplace in Economics and to a lager extent than that in Biology. Both formal and informal collaboration have positive effects on research productivity1 (see, e.g., Ductor, 2015; Ductor et al., 2014; Rose & Georg, 2021).
This paper investigates a new means to further promote collaboration, that is, cross-affiliation in which researchers expand their scope of collaboration by affiliating with multiple institutions at the same time.2 Here, we focus on the widely-acknowledged top-three general interest journals in Financial Economics, namely, the Journal of Finance (JF, founded in 1946), the Journal of Financial Economics (JFE, founded in 1974), and the Review of Financial Studies (RFS, founded in 1986), which serve as clear exemplifications. We study top journals for two reasons. On one hand, top journal publications have a powerful influence on the impact of the underlying research. They also carry vast weight in the career paths of academic researchers, the recruitment decisions of research institutions, and the allocation of research funding. Hence we may intend first to obtain results regarding top journals. On the other hand, space in top journals is limited. Competencies in assembling research teams, communicating with peer experts, and acquiring research resources (e.g., data accesses, hardware and software, funding, visibility, and credibility) across institutions play a more and more important role in top journal publications. Intense competition3 forces researchers to develop new forms of collaboration. And top journals constitute natural sites where these new forms of collaboration emerge.
We hand-collect the author and affiliation information for all articles published in the top finance journals. Figure 1 presents the patterns of collaboration in these journals during 1980–2016.4 Panel A shows the average number of coauthors by aggregating the three journals. Coauthorship displays steady, approximately linear growth observed earlier in other fields, such as Economics (Card & DellaVigna, 2013) and Neuroscience (Barabási et al., 2002). Panel B shows the new form of collaboration through cross-affiliation. We plot here the average number of institutional affiliations reported per author by aggregating the three journals.5 The number lingers at a low level before 1995 but starts to ramp up thereafter. In 22 years, the average number of institutions per author climbs from 1.1 to 1.3. Put differently, on average, one out of nine authors is affiliated with multiple institutions before 1995, while the ratio increases to one out of three at 2016. Panel C shows the average number of institutions per author separately for each journal. The same trend is prevalent across all three.

 ) and the average number of institutions reported per author (
 ) at top finance journals (JF, JFE, and RFS). Each year, we calculate
  and
and  using total paper, author, and affiliation counts in that year. (a)
  from aggregating the top-three journals. (b)
  from aggregating the top-three journals. (c)
  separately for each journal. The first issue of RFS appeared in 1988. The solid lines represent linear fit and vertical lines mark the year 1995.
Institutions are fundamental units in which research activities are organized and conducted. Their important role in academic research is manifest in, for example, resource allocation, infrastructure provision, and prestige effect in value attribution and funding mechanisms.6 The new form of collaboration through cross-affiliation imparts fresh insights into the growth of research output of institutions gauged by their top journal publications. In this study, we find that research institutions self-organize into a scale-free state and their top finance journal publications are characterized by power laws in the upper tail. The upper tail retains 6.0% of the totally 828 institutions at the end of 2016, while these most prolific institutions produce 61.3% of the totally 13,548 top journal publications. The upper tail distribution is highly-skewed: the mean number of publications is 166 while the most productive institution, NBER (National Bureau of Economic Research), contributes 1105 publications. The power laws govern institutions of diverse nature and scattered across geographic regions and time of establishment, indicating that these specific traits of institutions may be of less importance in driving the dynamics of their research output. The power laws are robust when considered separately for each of the last 6 years during our sample period. This result enables us to make further inference on the network since it seems to have reached a steady scale-free state. The power laws are also robust when considered separately for each of the three journals. This result reassures us that the scale-invariance is not caused by some journal-specific policies.
Our results provide an important regularity for theories of research output growth, which target the empirical power laws documented here. We propose a model of collaboration network that explains the scale invariance, based on further examinations into the structural reasons for the emergence of the scale-free properties. Specifically, a research institution enters the network as a node when it first publishes on a top finance journal and its degree henceforth equals its total number of publications. Two institutions are linked if they are affiliated to by at least one author of an article published in a top finance journal.7 The deep collaboration in financial research is revealed by a giant component of the network, which consists of 99.5% of all the institutions at the end of 2016.8 The dynamics of the network system are driven by nonlinear growth through enlarging coauthorship and cross-affiliation, as well as linear preferential attachment by incrementing total publications of institutions at a rate proportional to their current counts.9 The two identified mechanisms are generic, regardless of the types (universities, research centers, banks, etc.) and other characteristics (location and time of establishment) of the institutions. We consider three channels to allocate new degrees/top journal publications: (i) publications brought about by new nodes; (ii) publications allocated randomly to existing nodes; and (iii) publications allocated preferentially to existing nodes. The model remains tractable and predicts a power law for the stationary degree distribution in the upper tail. Furthermore, the power exponent is inversely related to the proportion of preferential allocation. Using the estimated power law exponents, we compute that 87.0% of the total publications originate from success-breeds-success,10 which engenders the high skewness in the distributions of the institutions' research output. On the contrary, the model also predicts that accelerated growth of collaboration, through coauthorship and cross-affiliation, increases the power exponent, and hence works to restore the homogeneity of the institutions.
There are several related studies on cross-affiliation. Katz and Martin (1997) point out that coauthorship is only a partial indicator of collaboration and further consider interinstitutional and international collaboration for adequacy. Hottenrott and Lawson (2017) show an increase in cross-affiliation in three countries and three scientific fields. Matveeva and Ferligoj (2020) demonstrate a similar increase in Russia. Hottenrott et al. (2021) provide a systematic study of cross-affiliation in 40 countries and 26 scientific fields. They focus on authors and articles with multiple affiliations and suggest a core-periphery network for the countries. All these studies do not examine the effect of cross-affiliation on the distribution publications among the institutions.
Power laws are an important empirical regularity for a wide spectrum of natural and social phenomena (Dorogovtsev & Mendes, 2003; Jackson, 2008). Beginning with Pareto (1896), well-documented power laws in Economics and Finance include individual wealth/income, international trade, city size, stock-market activity, firm size, CEO compensation, and supply of regulations (see Gabaix, 2009, and the references therein). In academia, the number of papers written by individual scientists, the number of coauthors of mathematicians, and the number of citations of papers also follow power laws (Newman, 2003). This paper provides evidence from Finance Economics that research output of institutions obeys power laws.
The literature on research collaboration through the lens of social networks starts with Newman (2001b, 2001c, 2001d).11 Barabási et al. (2002) extend Newman's analyses of static networks and examine the dynamics and evolution of coauthor networks. Goyal et al. (2006) treat Economics as a unified discipline and investigate coauthor networks of all journal articles included in the EconLit database. Fafchamps et al. (2010) find that the distance between two authors in the network is negatively related with the probability that they will form research teams in the future. van der Leij and Goyal (2011) examines the strength of strong ties in the network. Ductor et al. (2014) and Ductor (2015) find that coauthorship increases research productivity. Several studies investigate subfields of Economics including Evolutionary Economics (Dolfsma & Leydesdorff, 2010), Econometrics (Andrikopoulos et al., 2016), Population Economics (Brown & Zimmermann, 2017), and Financial Economics. For coauthor networks12 in Financial Economics, Fatt et al. (2010) explore coauthorship in JF. Andrikopoulos and Trichas (2018) study coauthorship in the Journal of Corporate Finance (JCF), which is the oldest academic journal specializing in corporate finance research. Exceptionally, the two authors give an example of the ego-network of the City University of Hong Kong, although they do not further examine the collaboration network of institutional affiliations of financial economists who publish in JCF. Li et al. (2018) find scale-free features in interinstitutional scientific collaboration networks in materials science. However, they do not examine network growth through collaboration, especially cross-affiliation. And they do not provide a theoretic link between the scale-free property and cross-affiliation. We characterize the degree distribution, collaboration patterns, and growth mechanisms of the collaboration network of research institutions in Financial Economics. We propose a model of network growth to explain the emergence of scaling in the network.
The contribution of the model analysis is threefold. First, we provide a realistic model which encompasses a rich set of dynamic patterns of network growth. Although some of these features have been separately examined in previous studies, we synthesize them with a tractable model and closely examine the interaction between the different model mechanisms. Second, we extend the analysis of Dorogovtsev and Mendes (2001b, 2003), who study exact power function form of network growth, to general polynomial growth, as required by the collaboration patterns in financial research. Our modeling approach could potentially be applied to investigate a wider range of networks. Third, we exploit our network model to develop a quantitative understanding towards the allocation of publications in financial research, and demonstrate the important role played by collaboration, through both coauthorship and cross-affiliation, in shaping the research output of institutions.
The rest of the paper is organized as follows. Section 2 presents the definition of a power law and describes the data and econometric approaches. Section 3 discusses the empirical results. Section 4 proposes an explanation of the empirical power laws, based on an accelerated network model. Section 5 concludes.
2 POWER LAWS FOR RESEARCH INSTITUTIONS
2.1 Research output of institutions
We manually collect the author and affiliation information of all articles published in the top-three finance journals by reading the title page of each paper. We exclude notes, comments/replies, and speeches/addresses. We focus on a sample since 1995, which embodies the fast growth of cross-affiliation in financial research as shown in Figure 1. Until 2016, we register 4796 articles associated with 10,910 author counts and 13,548 affiliation counts. Both counts are with repetitions, that is, each mentioning of an author or institution contributes one count to its own category.13 The total affiliation counts are then sorted and ascribed to the 828 distinct institutions.14 We simply treat the counts as the institutions' numbers of publications because they naturally pick up the effect of cross-affiliation and give full scope to collaboration.15
In the following, we provide a first characterization of the distributions of top finance journal publications on the institution level. Power laws prove to adequately describe these distributions in the upper tail.
2.2 Definitions and empirical methods
 ()
() is the power exponent and
  is the lower bound to the power law behavior. To avoid divergence as
  , we require
  . The power exponent α controls the speed of decay of the density, with a lower
  corresponding to a lower speed of decay and thus a longer upper tail. The exponent also determines the convergence of all moments of the distribution. Interestingly, for
  , all moments of the distribution are infinite. And the nth moment exists if and only if
  . On the other hand, a power law usually does not describe the whole distribution of a random variable, but governs its tail behavior. Therefore, besides the technical reason, the lower bound is a threshold to determine whether an observation belongs to the tail, or enters the phase of scaling. Only observations in the tail can then be applied to calibrate the associated power law. The countercumulative distribution function is defined to be
  . We have
 ()
()Due to the form of the countercumulative distribution function, it is sometimes referred to as a rank-size rule.
 with
with  observations. For our study, one observation is the number of publications of an institution during a certain sample period. We estimate
  as the slope of the OLS log-log regression (Gabaix & Ibragimov, 2011):
 ()
() is an adjustment to the rank
  .
.  is typical in the literature while
  is optimal. The downward adjustment of 1/2 to the rank reduces the small-sample bias to the leading order for the log-log regression.16 The asymptotic standard error of
  is computed at
  , not the conventional OLS standard error that is nullified by the positive autocorrelation introduced by the ranking procedure into the residuals.
In our study,  refers to the number of publications of institutions, and
  is the density function of x. That is,
  can be approximated by dividing the proportion of institutions with publications within a bin containing
  by the width of the bin. And the countercumulative distribution
  in Equation (2) is the proportion of institutions with publications larger than or equal to x. Note that the rank of an institution,
  , normalized by the total number of institutions,
  , is the proportion of institutions with publications larger than or equal to the publications of this institution, that is,
  . Take logs of both sides of Equation (2), we can derive Equation (3), where the denominator
  as a normalization factor is absorbed by the regression constant.
 will leave out legitimate data points thus increase finite sample biases, while too low
  introduces biases by mixing with nonpower-law data. We adopt the approach proposed by Clauset et al. (2009), which chooses
  to minimize the distance between the empirical distribution of the data and the fitted power law. We measure the distance using the Kolmogorov–Smirnov statistic,
  , which is most common for nonmormal data:
 ()
() and
and  are the cumulative distribution functions of the data and the fitted power law model, respectively. Our method avoids the subjectivity in applying some upper quantile or visual checks to fix
  as often done in the literature (see, e.g., Beirlant et al., 2004; Drees et al., 2000), while other more subtle methods require estimation of extra parameters (Embrechts et al., 1997).
 ()
() .
.  recenters
  such that
  stays the same, irrespective of the quadratic term. The standard error of the test statistic
  is computed at
  . We reject the null of an exact power law if and only if
  is statistically different from zero.
3 EMPIRICAL FINDINGS
We show in Panel A of Figure 2 the distribution of top finance journal publications accumulated to the end of 2016 for all institutions. We plot the rank of the institutions against their total publications in log–log coordinates. We impose the optimal downward adjustment of 1/2 to the rank as suggested by Gabaix and Ibragimov (2011). The upper tail of the distribution falls onto a straight line that hints at a power law, or a rank-size rule, as dictated by Equation (2).

Applying the method discussed in the previous section, we retain the 50 most prolific institutions in the upper tail, with the estimated cutoff of  . We report the complete list of the 50 institutions together with their publication records in Table 1. Although the 50 institutions account for merely 6.0% of the entire sample of institutions that had published in top finance journals during our sample period, they contribute a predominant 61.3% of total publications. The distribution of the 50 institutions is highly right-skewed, with a mean number of publications of 166 and a median of 112; notably, NBER is solely responsible for 1105 publications.
| Rank | Institutions | JF | JFE | RFS | All journals | % of Total |
|---|---|---|---|---|---|---|
| 1 | NBER | 437 | 347 | 321 | 1105 | 13.30% |
| 2 | CEPR | 201 | 142 | 162 | 505 | 6.08% |
| 3 | New York University | 137 | 137 | 119 | 393 | 4.73% |
| 4 | Harvard University | 129 | 182 | 71 | 382 | 4.60% |
| 5 | University of Pennsylvania | 125 | 135 | 90 | 350 | 4.21% |
| 6 | University of Chicago | 152 | 97 | 80 | 329 | 3.96% |
| 7 | Columbia University | 85 | 77 | 73 | 235 | 2.83% |
| 8 | UCLA | 70 | 81 | 56 | 207 | 2.49% |
| 9 | Duke University | 73 | 70 | 58 | 201 | 2.42% |
| 10 | Stanford University | 65 | 66 | 56 | 187 | 2.25% |
| 11 | MIT | 72 | 70 | 43 | 185 | 2.23% |
| 12 | University of Michigan | 52 | 59 | 71 | 182 | 2.19% |
| 13 | Ohio State University | 47 | 74 | 60 | 181 | 2.18% |
| 14 | London Business School | 54 | 51 | 68 | 173 | 2.08% |
| 15 | UNC Chapel Hill | 49 | 55 | 61 | 165 | 1.99% |
| 16 | University of Texas at Austin | 71 | 46 | 45 | 162 | 1.95% |
| 17 | Northwestern University | 69 | 41 | 49 | 159 | 1.91% |
| 18 | UC Berkeley | 52 | 49 | 53 | 154 | 1.85% |
| 19 | Cornell University | 63 | 39 | 48 | 150 | 1.81% |
| 20 | University of Maryland | 40 | 50 | 49 | 139 | 1.67% |
| 21 | University of Southern California | 38 | 66 | 33 | 137 | 1.65% |
| 22 | UIUC | 46 | 48 | 37 | 131 | 1.58% |
| 23 | ECGI | 37 | 27 | 56 | 120 | 1.44% |
| 24 | Boston College | 34 | 52 | 31 | 117 | 1.41% |
| 25 | Yale University | 45 | 25 | 43 | 113 | 1.36% |
| 26 | University of Washington | 25 | 61 | 24 | 110 | 1.32% |
| 27 | Washington University in Saint Louis | 37 | 27 | 42 | 106 | 1.28% |
| 28 | Indiana University | 33 | 37 | 32 | 102 | 1.23% |
| 29 | University of Rochester | 28 | 55 | 15 | 98 | 1.18% |
| 30 | HKUST | 31 | 37 | 25 | 93 | 1.12% |
| 31 | Federal Reserve Board | 39 | 35 | 17 | 91 | 1.10% |
| 32 | Swiss Finance Institute | 22 | 41 | 28 | 91 | 1.10% |
| 33 | University of Utah | 26 | 40 | 25 | 91 | 1.10% |
| 34 | Arizona State University | 28 | 45 | 17 | 90 | 1.08% |
| 35 | INSEAD | 18 | 33 | 37 | 88 | 1.06% |
| 36 | LSE | 26 | 14 | 48 | 88 | 1.06% |
| 37 | Princeton University | 38 | 33 | 16 | 87 | 1.05% |
| 38 | University of Notre Dame | 35 | 37 | 15 | 87 | 1.05% |
| 39 | Purdue University | 23 | 42 | 19 | 84 | 1.01% |
| 40 | Tilburg University | 31 | 33 | 18 | 82 | 0.99% |
| 41 | University of British Columbia | 27 | 20 | 34 | 81 | 0.98% |
| 42 | University of Oxford | 36 | 22 | 23 | 81 | 0.98% |
| 43 | Emory University | 23 | 38 | 18 | 79 | 0.95% |
| 44 | University of Toronto | 31 | 25 | 23 | 79 | 0.95% |
| 45 | University of Minnesota | 27 | 26 | 24 | 77 | 0.93% |
| 46 | University of Florida | 20 | 39 | 14 | 73 | 0.88% |
| 47 | Michigan State University | 14 | 28 | 30 | 72 | 0.87% |
| 48 | University of Virginia | 24 | 24 | 24 | 72 | 0.87% |
| 49 | Carnegie Mellon University | 23 | 14 | 34 | 71 | 0.85% |
| 50 | Federal Reserve Bank of New York | 19 | 24 | 28 | 71 | 0.85% |
| Total | 2927 | 2916 | 2463 | 8306 | 100% |
- Note: This table reports the top finance journal publications of the top 50 institutions from 1995 to 2016. The rank is based on aggregate publications across the three journals.
We classify the 50 institutions according to several criteria in Table 2. The comprehensiveness of our sample is revealed by the scattering of the institutions across type, geographic region, and time of establishment. For instance, the majority of the most productive institutions, as expected, are universities and colleges. Meanwhile, we find that three research bureaus/centers (NBER, CEPR [Centre for Economic Policy Research], and ECGI [European Corporate Governance Institute]), the Federal Reserve Board, and the Federal Reserve Bank of New York also make their way into the upper tail of the distribution. It is clear from the table that the present study broadly includes all institutions that embark on academic research in Financial Economics as “research institutions”.
| Type | Universities/Colleges | Research Bureaus/Centers | Banks & Others |
| Number in total | 45 | 3 | 2 |
| Region | North America | Europe | Asia |
| Number in total | 42 | 7 | 1 |
| Establishment | Before 1995 | 2002 | 2006 |
| Number in total | 48 | 1 | 1 |
We present the distribution of the 50 most prolific institutions in panel B of Figure 2. A power law model describes the data well (for over two decades of institutions and from  to
to  publications). We report the OLS regression results in Table 3. For the three journals combined, the regression
  is as high as 98.6%. The power exponent is estimated at 1.640 with a standard error of 0.328. As a robustness check, we repeat the analysis for the preceding 5 years, from 2011 to 2015. The results are presented in Table 4. The power exponent was fairly stable, even though the average number of publications increased dramatically over time. The complex system of institutions, with diverse natures and worldwide origins, seems to have reached a scale-free stationary state.
| All Journals | JF | JFE | RFS | |
|---|---|---|---|---|
 |
1.640 | 1.490 | 1.689 | 1.615 |
| (0.328) | (0.298) | (0.338) | (0.323) | |
 |
0.986 | 0.988 | 0.982 | 0.961 |
 regardless of increasing mean number of publications.
| Year | Mean number of publications |  |
 |
|---|---|---|---|
| 2015 | 155 | 1.632 (0.326) | 0.985 |
| 2014 | 146 | 1.616 (0.323) | 0.984 |
| 2013 | 135 | 1.610 (0.322) | 0.980 |
| 2012 | 123 | 1.572 (0.314) | 0.973 |
| 2011 | 113 | 1.541 (0.308) | 0.965 |
To explore the unanimity of the power law behavior, we redo the graph of the upper tail distribution for each journal separately in panel C of Figure 2. Since the three journals publish different total numbers of articles, we normalize each institution's publications in one journal by the average number of publications in that journal. If the same power law permeates all three journals, we expect their graphs to collapse onto one another after normalization. This is confirmed in panel C of Figure 2. Moreover, Table 3 shows that, for each journal separately, the regression  is no less than 96.1%, and the power exponent ranges from 1.490 to 1.689 with no statistically significant differences among those estimates given the standard errors.
We present in Table 5 the results of the Gabaix-Ibragimov test for deviations from our proposed power law models. For all the three journals, separately or combined, we see that  is not significantly different from zero given the standard errors. We fail to significantly improve model performance by introducing curvature to the models.
 is the Gabaix-Ibragimov statistic with standard errors in parentheses.
| All journals | JF | JFE | RFS | |
|---|---|---|---|---|
 |
0.102 | 0.109 | 0.182 | 0.224 |
| (0.269) | (0.222) | (0.285) | (0.261) |
 ()
() .17 We use the Kolmogorov–Smirnov test of the empirical CDF against the Hill's estimate to detect potential deviations from power laws. We present the results for model estimation in panel A and model tests in panel B of Table 6. We confirm that, although some variations in the results are unavoidable when we apply different estimation methods, we find no qualitative differences in the results under either the OLS log–log regression or Hill's tail-index estimator approach. Specifically, the discrepancies in the power exponent estimates are not statistically significant given the standard errors for the power law models considered. Furthermore, the Kolmogorov–Smirnov test cannot reject the power law models at a conventional significance level.
 is Hill's estimator with standard errors is in parentheses. KS-Stat is the Kolmogorov–Smirnov test statistic with p-values is in parentheses.
| All journals | JF | JFE | RFS | |
|---|---|---|---|---|
| Panel A: Hill's tail-index estimator | ||||
 |
1.489 | 1.208 | 1.516 | 1.313 |
| (SE) | (0.205) | (0.166) | (0.208) | (0.180) |
| Panel B: Kolmogorov–Smirnov test | ||||
| KS-Stat | 0.065 | 0.131 | 0.123 | 0.124 |
| (p-value) | (0.968) | (0.300) | (0.373) | (0.357) |
In sum, the proposed power laws seem to succinctly capture growth in the research output of institutions. We now turn to examine the dynamics and evolution of collaboration patterns in Financial Economics. Due to the diversity in the nature of the institutions and the robustness of the power law behavior, we expect generic mechanisms, less attached to traditional value of institutions such as funding and service, that engender the scaling laws documented here. We will provide a model of network growth which explicitly reveals the impact of cross-affiliation on the distribution of publications.
4 A MODEL OF ACCELERATED NETWORKS
A variety of processes can explain the emergence of scaling (see, e.g., Barabási & Albert, 1999; Ferrer i Cancho & Solé, 2003; Gabaix, 1999).18 We find empirical support for the network model of Barabási and Albert (1999), who pioneer two generic mechanisms: One is growth, that is, new nodes continue entering the network; the other is preferential attachment, also referred to as success-breeds-success, popularity-is-attractive, rich-get-richer, or the Matthew effect, that is, a node with a higher degree will enjoy a cumulative advantage and acquire even more links in the future.19
Specifically, we treat institutions with at least one top finance journal publication as nodes in our collaboration network. Therefore, an institution joins the network when it publishes for the first time in the top finance journals. And we treat the total number of publications of a node as the degree of the node. In concert with our data acquisition method, we increase the degree of a node by one per citation of the corresponding institutional affiliation by an author in an article. We plot in Figure 3 the structure of the collaboration network at the end of 2016. Two nodes are connected if the corresponding two institutions work together in at least one publication during 1995–2016. Notably, the network has a giant component that includes 99.5% of the nodes, which reveals the close linkage among the academic society for financial research. The most connected node is NBER, which has collaborated with 300 other institutions during our sample period. In contrast, the average number of collaborating institutions for all nodes in the network is 13.5.20 Hence the average number of collaborators is small relative to that of the most connected “star.”21

4.1 Growth patterns
We first examine the growth of the collaboration network of financial research institutions. We plot in Panel A of Figure 4 the number of nodes newly joining the network. We see that the growth of the nodes is stable, with certain fluctuations around the financial crisis of 2008. Panel B of Figure 4 presents the fraction of publications contributed by the new nodes for each year from 1995 to 2016. This proportion again stays relatively stable, with an average of 6.0% from 2000 to 2016.

We then investigate the allocation of new links (publications) to the nodes. Exact power laws follow only from linear preferential attachment (Krapivsky et al., 2000). That is, the probability for an existing node to acquire new links ( ) is proportional to its degree (
 ), or
), or  . Exploiting the network maps at the end of each year from 1995 to 2016, we use the method provided in Jeong et al. (2003) to measure preferential attachment. We provide detailed results in Appendix A. We find that
  can be well approximated by
  , where
  is estimated at 1.00 with a standard error of 0.08. Thus, linear preferential attachment seems to be a good match for data.
In the following, we develop a network model that captures three additional features of the collaboration network. First, expanding coauthorship (panel A of Figure 1) and cross-affiliation (panel B of Figure 1) generate nonlinear growth in total publications. Thus, instead of linear growth considered by Barabási and Albert (1999), we incorporate accelerated growth following Dorogovtsev and Mendes (2001b, 2003). Second, we include internal links because 94.0% of the total publications come from collaboration among already existing nodes (Ghoshal et al., 2013). Third, although preferential attachment enables institutions successful in historic records to produce even more research output in the future, we randomly allocate a fraction of new publications to the existing nodes, allowing research opportunities to strike institutions by sheer chance (Ghoshal et al., 2013).22
4.2 An evolving network with accelerated growth
Consider discrete time  , with time interval
  . Assume that there is one node in the network at time 0 and that one new node enters the network at each
  . Then there are
  nodes in the network at time
  , excluding the new node entering at the time.23 Let
  denote the publication rate at time
  . Hence
  is the total number of new publications during the time interval
  . These publications are distributed among all nodes in the network at time
  . We assume that, a faction
  of the total publications is distributed preferentially to the existing nodes, a fraction
  is distributed randomly (with equal probability
  ) to the existing nodes, and a fraction
  is allocated to the new node. The constants
  , and
, and  are nonnegative and sum to one.24 Preferential and random allocations are independent events.
 denote the degree at time
  of a node entering at time s. Notice that
 ()
()The four conditional probabilities in the above equation can be evaluated by linear preferential attachment, random allocation, and independence of the events.
 denote the probability that the node has degree
  at time
  . A new node entering at time
  obtains the degree
  . Thus,
  . We have the following master equation for degree probabilities of individual nodes.
 ()
() is the cumulative degrees of all nodes at
  . It is worth mentioning that
  , that is, the degree of a node at time
  is not greater than the cumulative input of degrees until time
  . Rearrange the terms of Equation (8), we have:

 go to zero as time
  and degree
  vary continuously. Suppose the degree rate function
  is continuous. The continuous-time approximation of the master Equation (8) is obtained as follows. For
  ,
,
 ()
() is a generalized probability density function representing the density of the degree distribution at time
  of the node s. The initial condition is
  for
for  , where
  is the delta function with the properties
  for
for  , and
, and  for a nonnegative constant
  .
. and integrating from 0 to
  with respect to
  for the above equation, we obtain:
 ()
() . Then we obtain the evolution equation for
  :
:
 ()
() .
. is the total number of nodes with degree
  at time t, and
  is the number of nodes at time
  , excluding the newly coming one. Hence the degree distribution at time
  is given by
  . Actually, the distribution
  can be recovered from
  by the relation
 ()
() is a solution to the equation
  . The first equality is due to the fact that the solution
  is actually a delta function
  for some
  and the second equality is according to the general property of the delta function.
 is
is

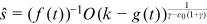
 can be identified and we obtain
 ()
()Recall that  is the average degree at time
  of the nodes entering at time s. The above equation indicates that a lower
  corresponds to a higher
  for a fixed
  .
.
 be a solution to the equation
  . Then
  . Taking partial derivative with respect to
  , it follows that
 ()
()
 satisfies
 ()
()Next, we introduce an assumption on the rate function  to evaluate
  . Suppose that
  is a nonnegative continuous function defined on
  .
.
Assumption.There exist constants  , such that
  for all
  .
.
For example,  or
or  for some positive constant
  , satisfies the assumption.25 Clearly, when the assumption is satisfied,
  is such a function that
  , and
, and  all exist. We write
  if a continuous function
  satisfies the assumption.26 We can directly show that
 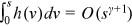 if
if  .
.
 ()
()
 and
and
 ()
() is large and has the same or a higher order than
  of
of  . Note that the total degree
  has an order of
  thus the average degree
  has an order of
  . Finally, it follows from Equations (15) and (12) that the degree distribution at time
  is
is
 ()
() ()
() is large. Therefore, the degree distribution obeys a power law in the upper tail with exponent
 ()
()To ensure the existence of  , we require
  or
or  .
.
4.3 Model implications
The power exponent is determined by the fraction of preferential allocation and the order of growth of the network. From Equation (21), the exponent  decreases in
  . The larger proportion of degree allocation according to preferential attachment heightens the success-breeds-success effect and enhances the dispersion of the degree distribution. Suppose that
  is strictly less than 1. Then
  increases in
  . Heterogeneity of the system diminishes as the network undergoes higher-order growth. Intuitively, preferential attachment works by cumulative advantages that are tempered by more and more publications to be allocated in the futures. As the number of nodes grows linearly in time, higher-order nonlinear growth of degrees has to be generated through more and more extensive collaboration across all the nodes. At the extreme, every article would be written by all authors, each of which is simultaneously affiliated with all institutions, then every institution will have exactly the same number of publications, and hence perfect homogeneity of institutions would be achieved. Put differently, at the limit of
  , the power law collapses and heterogeneity of the nodes disappears.
  and
and  do not directly enter Equation (21), but they indirectly affect
  through
  as
as  . For
. For  , we get
  , a special case called Zipf's law, which is interesting because all its moments diverge.
  does not play a role in this case. We obtain the Barabási and Albert model in the special case of
  and
and  .
.
For our collaboration network, the total counts of new publications equal the product of the number of articles, the average number of authors per paper, and the average number of affiliations per author. Coauthorship and cross-affiliation exhibit approximately linear growth, suggesting the quadratic growth of  with
with  , given that the total number of articles published annually remains stable in the long run. Our empirical study finds that
  for the three journals altogether. We can use Equation (21) to obtain
  . That is, 87.0% of publications may have resulted from success-breeds-success, a dominating channel for the distribution of the top journal publications. We have deduced from the data that 6.0% of publications go to new nodes. Random allocation thus takes the remaining 7.0% of publications. When we lack either the growth of coauthorship or the growth of cross-affiliation,
  is brought down to 1, which implies
  under slowed acceleration; additionally, when we lack both forms of collaboration, we have
  and
and  under linear growth. This comparison emphasizes the importance of identifying the collaboration patterns before further inference on the evolving network.
A most commonly invoked measure of dispersion/inequality in studies of income or wealth distributions is the Gini coefficient ( ).
).  represents perfect equality while
  stands for the other extreme of maximal inequality. Dispersion increases with G monotonically in between.
  is commonly regarded as the warning level for great disparity. We here borrow this measure and provide further discussions on the heterogeneity of the institutions. For power law distributions, it is well-known that
  (Aaberge, 2007). For the three journals altogether, we have
  for
for  . Given
  , and
, and  , when either the growth of coauthorship or the growth of cross-affiliation is absent,
  reduces to 1.35 implying
  . And again, given the shares, when both forms of collaboration are absent,
  reduces to 1.15 implying
  . Thus, higher-order growth in collaboration effectively diminishes heterogeneity in the institutions' research output.
4.4 Further discussions
It is now standard for the accelerated network models to consider two additional components: fitness and aging. Specifically, Bianconi and Barabási (2001) consider the degree of a node as a proxy for its experience, and provide a method to identify the fitness (talent) of a node. For instance, the fitness of an institution in our study may be the endowment, scale, location, pedigrees of the employees, etc., of the institution. All these factors may potentially determine the institution's future research performance. Kong et al. (2008) find that the fitnesses of webpages are exponentially distributed, which explain the power law degree distributions of webpages and the quick rising of interesting new pages in the page ranking. Dorogovtsev et al. (2000) investigate the effect of aging, which captures the natural preference for the new and moderates the success-breeds-success effect. Mele et al. (2011) and Sun et al. (2018) show that temporal effects have important implications for network growth. The product of fitness and aging is called the “relevance” of a node in the literature (Mele et al., 2011). Under the combined effects of experience (rich-get-richer), fitness (fitter-get-richer), and aging (younger-get-richer), new degrees are then allocated preferentially according to the product of experience and relevance.27 However, we apply similar methods and do not find significant differences in the relevance of the research institutions in our study.28 We thus do not pursue extensions of our model along this dimension.
To obtain a power exponent ( ) greater than 1, Dorogovtsev and Mendes (2001b) introduce a time-dependent “additional attractiveness”29 to the nodes, which may not be easily verified empirically (Jeong et al., 2003). Our model achieves the scaling property of networks with nonlinear growth without this extra assumption. Note that the effect of additional attractiveness diminishes as the degree of a node becomes larger since it is additive, while the effects of fitness and aging do not since they are multiplicative. Accordingly, small differences in relevance could result in large gaps in the degrees of nodes even in the short run.
5 CONCLUSION
In this paper, we document the recent fast development of cross-affiliation of researchers who publish in the top finance journals from 1995 to 2016, and the resulting highly nonlinear growth of research output following mixed forms of collaboration. We show that scale-free power laws characterize the distributions of worldwide institutions' top finance journal publications. We propose an accelerated network model to explain the scale-invariance. We investigate the growth mechanisms of the network and find that linear preferential allocation of new publications plays a key role in the emergence of the scaling behavior. We consider three distinct ways by which new publications are generated, in particular, through new nodes (institutions publishing for the first time in top finance journals), random allocation, and preferential allocation. The last channel accounts for a dominant 87.0% of all publications. Our theoretic analysis also demonstrates that higher-order growth of the network, possibly originating from new forms of collaboration, reduces the dispersion in the institutions' cumulative research output.
The power law distributions we focus on here may characterize other fields and extend to a broader set of journals as well. Cross-field examinations of the scaling behavior and the role played by preferential attachment in the allocation of publications could undoubtedly enrich our understanding of production of scientific knowledge of the institution level. We can also examine the inverse relationship between order of growth in collaboration and heterogeneity of research institutions through cross-subfields and even cross-disciplinary studies. Furthermore, due to the obvious relations between the authors and their institutional affiliations, an interesting future direction is to reconcile the small-world properties of the coauthor network discovered on the individual researcher level and the scale-free properties of the collaboration network on the institution level. Last but not least, we have demonstrated the effect of collaboration on the distribution of research output, while we have not touched on the efficiency of such scale-free networks as a way of organizing research activities, and the robustness of such networks under attack (e.g., the accidental demise of a major research institution). These works await comprehensive data to be gathered, and we leave them to future studies.
AUTHOR CONTRIBUTIONS
Hui Dong: Conceptualization; data curation; formal analysis; funding acquisition; writing—review and editing; writing—review and editing. Dan Luo: Conceptualization; data curation; formal analysis; funding acquisition; methodology; project administration; writing—original draft; writing—review and editing. Xudong Zeng: Conceptualization; formal analysis; funding acquisition; methodology; writing—original draft; writing—review and editing. Zhentao Zou: Conceptualization; data curation; formal analysis; funding acquisition; methodology; writing—original draft.
ACKNOWLEDGMENTS
The authors thank editor Kevin Huang and an anonymous referee for their valuable comments, which greatly improved the paper. The authors are also grateful for the comments of Andrew Carverhill, Aaron Clauset, Jiangyuan Li, Xiaoji Lin, Jianguo Liu, Yong Ma, Tom Sargent, Jun Sun, Weidong Tian, Liyan Yang, and seminar participants at Hunan University, Wuhan University, and Shanghai University of Finance and Economics. Hui Dong acknowledges the support from the Natural Science Foundation of China (#72172079), the MOE Project of Key Research Institute of Humanities and Social Science in University (#22JJD790094), the 111 Project (#B18033). Dan Luo acknowledges the support from the Natural Science Foundation of China (#71972123). Xudong Zeng acknowledges the support from the Natural Science Foundation of China (#71771142), the MOE Project of Key Research Institute of Humanities and Social Sciences in Universities (#22JJD790089). Zhentao Zou acknowledges the support from the National Natural Science Foundation of China (#72003142; #71971164), Major Program of the National Social Science Foundation of China (#21ZDA114).
CONFLICT OF INTEREST STATEMENT
The authors declare no conflict of interest.
ETHICS STATEMENT
None declared.
APPENDIX A: MEASURING PREFERENTIAL ATTACHMENT
 , a node
  already present in the network acquires new links at the rate
  where
where  is the degree of the node. Under preferential attachment,
  is a monotonically increasing function of
  . Several authors propose that
  follows a power law (Jeong et al., 2003; Krapivsky et al., 2000; Newman, 2001a):
 ()
() is a scaling constant;
  is a normalization pertinent to time
  . The scale-free model of Barabási and Albert (1999) corresponds to linear preferential attachment with
  , while for
  (sublinear), the degree distribution follows a stretched exponential and for
  (super-linear), a single node connects to nearly all other nodes (Krapivsky et al., 2000). We use the method provided in Jeong et al. (2003) to examine whether
  could be well approximated by a power law, and if so, to estimate the exponent
  .
. and the degrees of these nodes at both
  and
and  to measure
  . To ensure stationarity, we need
  away from
  when the network starts. We also choose a small
  such that the effect of
  is at minimum and
  relies exclusively on
  . To further reduce noise, we examine the cumulative function
 ()
()For  , we expect
  .
.
In our empirical implementation, we choose  2000–15, and
  . The
. The  functions are shown in panel A of Figure A1. We plot two additional benchmark cases for comparison:
  without preferential attachment and
  for linear preferential attachment. The
  functions of the network follow a straight line in log-log coordinates. Therefore, the power law form in Equation (4) provides a good approximation. The
  functions also increase with a speed consistent with linear preferential attachment, independently of the year when the measurements are taken. This result supports stationarity in the degree allocation process, even though some variation is inevitable due to statistical noise. We show the estimated
  exponent in panel B of Figure A1. The exponent from 2000 to 15 has a mean of 2.00 and a standard deviation of 0.08. Linear preferential attachment hence constitutes the key degree allocation mechanism of the growing network.

 function for the collaboration network (a) and the
  exponent (b). For each curve we used
  . We measure
  for each year from 2000 to 15 by fitting the whole
  function. We plot the linear and quadratic
  functions as the solid and dashed lines in log–log coordinates, respectively.
REFERENCES
- 1 For more discussions on the benefits of collaboration, see, e.g., Beaver (2001).
- 2 See also the concurrent work of Hottenrott et al. (2021).
- 3 For instance, Card and DellaVigna (2013) show that the total number of articles published by the top-five economics journals remains relatively stable accompanying the outburst of submissions in recent years. As a result, the acceptance ratios have fallen off dramatically. Similar situations apply to the top finance journals.
- 4 Before 1980, an author usually reports a single affiliation. Therefore, this earlier period is less informative for our study of cross-affiliation and omitted for simplicity.
- 5 Li et al. (2018) study collaboration across institutions in materials science. They do not characterize cross-affiliation but focus instead on the percentage of multi-institutional publications, which stays stable before 2013 and starts to grow fast thereafter.
- 6 For more discussions, see Hottenrott et al. (2021).
- 7 To fully account for the complexity of the collaboration patterns, we admit multi-links for repeated collaboration between two institutions and self-loops for articles reporting a single affiliation.
- 8 Fatt et al. (2010) document that the largest component covers 58% of the nodes in the coauthor network of JF between 1980 and 2009. Hence we may expect the giant component of the collaboration network of institutions to be extraordinarily large since each institution commonly accommodates a number of economists.
- 9 Dang and Li (2020) study the evolving of characteristics of all published papers in the top three finance journals from 2000 to 2013.
- 10 Bol et al. (2018) document the success-breeds-success effect in the allocation of science funding in the Innovation Research Incentives Scheme, a primary funding source for young Dutch scientists, in the Netherlands.
- 11 Coauthorship as a measure of research collaboration dates back to de Solla Price and Beaver (1966). Hodgson and Rothman (1999) define the concentration of publications in economics (including finance) as institutional oligopoly.
- 12 Informal networks in Financial Economics are also investigated in the literature. Kim et al. (2009) and Brogaard et al. (2014) examine the influence of editorial networks on top finance journal publications and citations. Andrikopoulos and Economou (2015) study editorial board interlocks in 20 finance journals. Andrikopoulos and Economou (2016) analyze the network of acknowledgments in financial research with a sample including all research articles in JF, JFE, RFS, and the Journal of Financial and Quantitative Analysis. In particular, JFE exhibits a small-world network. Rose and Georg (2021) exploit a novel data set obtained from the acknowledgments of over 5000 published papers in Financial Economics. They find that a researcher's position in the network predicts her future productivity.
- 13 For a specific example, Edmans et al. (2012) supply the following affiliations of the authors on the title page of the JF article: “Edmans is from The Wharton School, University of Pennsylvania, NBER, and ECGI; Gabaix is from the NYU Stern School of Business, NBER, CEPR, and ECGI; Sadzik is from New York University; and Sannikov is from Princeton University.” In our sample, this paper consists of four authors affiliated with six distinct institutions. And we count one publication for University of Pennsylvania, two for NBER, one for CEPR (Center for Economic and Policy Research), two for ECGI (European Corporate Governance Institute), two for New York University, and one for Princeton University.
- 14 We identify distinct institutions using English translations in cases where the affiliations are reported in non-English languages.
- 15 Similarly, Newman (2004), in the context of coauthor networks, provides the simplest method of counting the frequency of coauthorship between pairs of individual scientists as a measure of the strength of collaboration.
- 16 Barro and Jin (2011) impose the same downward adjustment prescribed by Gabaix and Ibragimov (2011) when estimating their power laws for the macroeconomic disasters.
- 17 Under the null of a perfect power law, Hill's estimator exploits the efficiency properties of maximum likelihood estimation, and hence provides a smaller standard error than that of Gabaix and Ibragimov (2011). However, it can also underestimate the true estimation error in finite samples in the presence of bias terms. For further discussions, see, for example, Gabaix and Ioannides (2004).
- 18 For textbook treatments on the topic, see Dorogovtsev and Mendes (2003), Jackson (2008), Barabási (2016), and Newman (2018), among others.
- 19 Preferential attachment also plays an important role in recent coauthorship network formation models. See, e.g., Hsieh et al. (2021) and Anderson and Richards-Shubik (2022).
- 20 In comparison, Goyal et al. (2006) show that the giant component in their coauthor network consists of up to 40.7% of the nodes in the 1990s. The most connected economist has 54 coauthors while the average number of coauthors is 1.7 in the 1990s.
- 21 Our focus in this study is on the degree distribution under which two nodes are allowed to have multiple links between them. Although Figure 3 provides a simple and intuitive visualization of the collaboration patterns among the institutions, it is difficult to do a similar plotting in the presence of multi-links. For this reason, we here do not further discuss other statistics, such as the average distance and clustering coefficient, of the network.
- 22 Mele (2017) develops a structural model of network formation, with both strategic and random networks features, which generates directed dense networks. He also provides a Bayesian MCMC method to estimate model parameters.
- 23 The assumption of one new node at each time is widely adopted in the literature (see e.g., Barabási and Albert (1999) and Dorogovtsev and Mendes (2001b, 2003)). In reality, it is possible that two or more institutions publish their first top finance journal papers within some time interval. So more than one node might be added to the network at a time. We make the simple assumption of one new node at each time for two reasons: (1) Panel A of Figure 4 shows that new nodes join the network at a relatively stable rate. This supports our assumption which essentially requires new nodes to enter the network at an even speed and (2) we rely on a tractable continuous-time model and in the derivations, we may let the time interval (
 ) be sufficiently small such that no more than one institution can publish during the short time period. We believe this assumption is a reasonable mathematical treatment for deriving a simple and informative continuous-time model. Our model can be extended to the case of two (or a fixed number of even more) new nodes entering the network each time. However, allowing a random number of new nodes to enter the network each time would seriously complicate the model.
 - 24 For simplicity, we assume
 goes to the only node at
  in the network.
 - 25 Network growth has important implications for the degree distribution. Exponential network growth is examined by, among others, Dorogovtsev and Mendes (2001a), Parolo et al. (2015), and Sun and Staab (2020).
- 26 Clearly, we consider general polynomial growth, which includes as a special case the exact power function form of growth (
 where
where  ) of Dorogovtsev and Mendes (2001b, 2003).
 - 27 That is,
 , where
  is the fitness of node
  is the age of node
  , and
, and  is a decreasing function that represents the temporal decay of relevance.
 - 28 The results are available upon request.
- 29 That is,
 , where
  is the additional attractiveness of node
  .
.