In vivo visualization of immunosuppressive cells in the tumor microenvironment
Abstract
Immunosuppressive cells are pivotal players in tumor progression by affecting the efficacy of conventional therapies and the prognosis of cancer patients. Visualization and real-time evaluation of these cells are very important to achieve patient-oriented precision oncological medicine. Noninvasive imaging techniques are excellent tools for this purpose, and various molecular imaging probes have been developed to monitor these protumoral immunosuppressive cells in the tumor microenvironment. In this review, we provide a brief update on the biology of immunosuppressive cells and outline recent progress in their visualization.
Abbreviations
-
- CAFs
-
- cancer-associated fibroblasts
-
- CTLA-4
-
- cytotoxic T-lymphocyte-associated antigen 4
-
- DNPs
-
- dextran nanoparticles
-
- ECM
-
- extracellular matrix
-
- FAP
-
- fibroblast activation protein
-
- FAPIs
-
- FAP inhibitors
-
- FPR
-
- formyl peptide receptor
-
- IL-2
-
- interleukin-2
-
- MDSCs
-
- myeloid-derived suppressor cells
-
- Nb
-
- nanobody
-
- NE
-
- neutrophil elastase
-
- PD-1/PD-L1
-
- programmed cell death protein-1 and its ligand 1
-
- PET
-
- positron emission tomography
-
- SPECT/CT
-
- single-photon emission computed tomography/computed tomography
-
- TAMs
-
- tumor-associated macrophages
-
- TANs
-
- tumor-associated neutrophils
-
- TME
-
- tumor microenvironment
-
- Tregs
-
- regulatory T cells
-
- α-SMA
-
- α-smooth muscle actin
1 INTRODUCTION
The tumor microenvironment (TME) is an indispensable component of tumors that exhibits distinct features at the various stages of tumor progression and across tumor types.
At the early stage, tumors are already infiltrated by immune cells, bone marrow-derived hematopoietic and endothelial progenitor cells, and cancer-associated fibroblasts (CAFs) [1, 2]. Immune cells, such as macrophages, lymphocytes, natural killer cells, natural killer T cells, and dendritic cells, are the main cells that suppress tumors [3, 4]. However, these cells can be reprogrammed by cancer cells from antitumoral to protumoral subtypes. Examples are tumor-associated macrophages (TAMs), tumor-associated neutrophils (TANs), myeloid-derived suppressor cells (MDSCs), and regulatory T cells (Tregs) (Figure 1) [5, 6]. Furthermore, anticancer immunity is blunted by immunosuppressive cues, including programmed cell death protein-1 (PD-1) and its ligand 1 (PD-L1). CAFs secrete growth factors to promote the survival, proliferation, drug resistance, and metastasis of cancer cells [7]. Tumor-associated endothelial cells (TECs) underlying structurally abnormal and functionally instable tumor vessels lead to the formation of a hypoxic and nutrient-depleted microenvironment. The extracellular matrix (ECM) is also a major TME component [8]. The ECM presents a diverse pool of cues that affect tumor cell proliferation and survival and cell fate determination, migration, and invasion [9, 10].
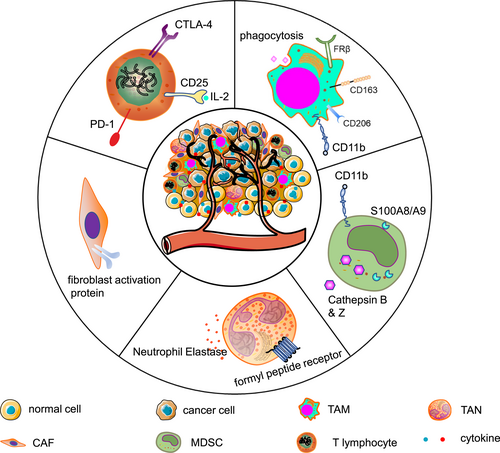
Schematic depiction of immunosuppressive cells and their markers used for imaging.
TAMs are the most abundant type of immunosuppressive cells in the TME, which are characterized by upregulated CD163, CD204, and CD206 [6, 11]. They foster tumor growth, immune suppression, metastasis, and chemoresistance by generating a series of chemokines such as the vascular endothelial growth factor and interleukin-8. The sequestration of their monoclonal antibodies mediated through fragment γ receptors is considered a reason for treatment resistance [12, 13].
Similar to TAMs, the paradigm of “TANs” is proposed for cancer cell-reprogrammed intratumoral neutrophils. They exhibit high expression of protumoral factors, including CCL2, CCL5, neutrophil elastase (NE), cathepsin G, and arginase [14, 15]. Their presence is associated with increased risks of invasion and metastasis [1, 14].
MDSCs are a heterogeneous population comprising myeloid cell progenitors and precursors [16]. They are further categorized into CD11b+Ly6G+Ly6Clow granulocytic MDSCs and CD11b+Ly6G−Ly6Chigh monocytic MDSCs [16, 17]. It should be noted that it is currently challenging to distinguish TANs from granulocytic MDSCs. An increased MDSC count correlates to a poor patient prognosis. They also negate the therapeutic efficacy of TME targeting [18].
CAFs belong to the stromal compartment of the TME, although their abundance varies substantially across the broad spectrum of cancers [19, 20]. Fibroblasts acquire a protumor phenotype, including upregulation of fibroblast activation protein (FAP), α-smooth muscle actin, S100A4 (also known as fibroblast-specific protein 1), and platelet-derived growth factor receptor-β [21]. The interplay between CAFs and other immunosuppressive cells promotes tumor progression and increases a propensity of therapy resistance [18].
CD4+CD25+ regulatory T cells (Tregs) exert immunosuppressive effects by directly suppressing the tumoricidal activity and proliferation of effector T lymphocytes or indirectly secreting inhibitory molecules such as the transforming growth factor β [1]. Additionally, CTLs are impeded by immune checkpoints such as PD-1 and cytotoxic T-lymphocyte-associated antigen 4 (CTLA-4) [22, 23].
2 MOLECULAR IMAGING OF IMMUNOSUPPRESSIVE CELLS IN THE TME
Considering the detrimental role immunosuppressive cells in cancers, there is an increasing need for their visualization in vivo [21, 24, 25]. In vivo tracking of immunosuppressive cells by ex vivo or in vivo labeling is a promising strategy [26]. Ex vivo labeling is often achieved using paramagnetic, radioactive, or fluorescent tracers without genetic modification of the cells. The labeling process is usually straightforward, and the labeled cells are visualized dynamically after injection. However, it has a limited capacity to visualize cellular proliferation, activation, and cell death [27]. In vivo labeling visualizes cells in situ by injecting specific tracers. By targeting corresponding biomarkers overexpressed on immunosuppressive cells, it captures a snapshot of the entire lifetime of cells and quantifies the frequency of each subpopulation. For example, single-photon emission computed tomography/computed tomography (SPECT/CT) and positron emission tomography/computed tomography (PET/CT) with labeled tracers have been used to detect immunosuppressive cells [28, 29]. These approaches allow early and accurate detection of TME components noninvasively [30]. Repeated imaging is also feasible and enables dynamic assessment of disease progression when the treatment plan required modification. Thus, PET/CT and SPECT/CT are particularly suitable imaging modalities, which are also a focus of this review. Indeed, some PET/CT and SPECT/CT tracers targeting immunosuppressive cells have been developed (Table 1), making it possible to evaluate heterogeneity of immunosuppressive cells, predict metastatic sites, and even deliver therapeutic radionuclides [64].
| Cell type | Marker | Probe | References |
|---|---|---|---|
| TAM | CD206 | 64Cu-MAN-LIP, 64Cu- Macrin, 18F-macroflor, 89Zr-DNP, 99mTc-anti-MMR, 18F-anti-MMR 3.49 | [31-35] |
| CD163 | [68Ga]ED2 | [36] | |
| FR-β | 18F-FOL, 18F-AzaFol | [37, 38] | |
| Phagocytic capacity | 89Zr-PL-HDL, 89Zr-AI-HDL | [35] | |
| F4/80 | 111In-anti-F4/80 | [39] | |
| CDllb | 18F-anti-CD11b VHHs, 64Cu-anti-CD11b VHHs | [40] | |
| TAN | Neutrophil elastase | Neutrophil elastase 680 fluorescent, SPCy | [41, 42] |
| FPR | cFLFLF | [43] | |
| MDSC | CD11b | 99mTc-anti-CD11b mAb, 64Cu-anti-CD11b mAb, 18F-anti-CD11b VHHs, 64Cu-anti-CD11b VHHs | [40, 44, 45] |
| CD11b and Gr-1 | anti-CD11b QD and anti-Gr-1 QD | [46] | |
| Cathepsin B & Z | ProSense 680 | [47] | |
| S100A9 | 111In-labeled anti-S100A9 | [48] | |
| CAF | FAP | FAPI-04, FAPI-46, FAPI-74, DOTA-2P(FAPI)2, ND-bisFAPI, DOTA.SA.FAPi, DOTAGA.(SA.FAPi)2, FAP-2286, Alb-FAPtp-01 | [49-55] |
| T cells | CD25 | 99mTc-IL-2 | [56] |
| PD1 | 64Cu labeled anti-mouse-PD-1 mAb, 89Zr-nivolumab, 89Zr-Df-Pembrolizumab, 64Cu-PD-1-Liposome-DOX, 64Cu-NOTA-α-PD-1 (RMP1-14), 99mTc-JS001 | [57-62] | |
| CTLA-4 | 64Cu-DOTA-anti-CTLA-4 mAb | [63] |
- Abbreviations: CAF, cancer-associated fibroblast; CTLA-4, cytotoxic T-lymphocyte-associated antigen 4; FAP, fibroblast activation protein; FPR, formyl peptide receptor; FR-β, folate receptor beta; MDSC, myeloid-derived suppressor cell; PD1, programmed cell death protein-1; TAM, tumor-associated macrophage; TAN, tumor-associated neutrophil.
2.1 Imaging of TAMs
The macrophage mannose receptor (MMR, also termed CD206), is a member of the C-type lectin family, and represents a promising target to visualize TAMs. Many MMR-targeting probes have been developed using dextran nanoparticles (DNPs), including 64Cu-labeled/mannosylated liposomes [31], 18F-macroflor [65], 89Zr-DNPs [66], and 64Cu-labeled carbohydrate-derived DNP macrin (Figure 2a) [32]. Because drugs can be encapsulated into DNPs [67, 68], these nanoparticles are useful to deliver drugs to tumor lesions, thereby achieving theranostic effects. However, mannose and its analogs are not specific for CD206 and have cross-reactivity with other mannose receptors such as CD209 [69], prompting the recent development of the CD206-targeting nanobody (Nb). Two groups isolated and characterized two anti-CD206 nanobody-based tracers (99mTc-labeled α-MMR Nb and 18F-fluorobenzoate [FB]-anti-MMR 3.49) (Figure 2b) [33, 34]. Both tracers show high retention in tumors and minimal uptake in normal organs/tissues, which is consistent with their specific recognition of TAMs in vivo. Their rapid elimination from circulation enables imaging as early as a few hours after injection, which is in direct contrast to mAbs that require days between injection and imaging [33, 34]. Considering that Nbs outperform mAbs in terms of solubility, stability, and affinity, they have a greater potential for CD206-targeted TAM imaging [70].
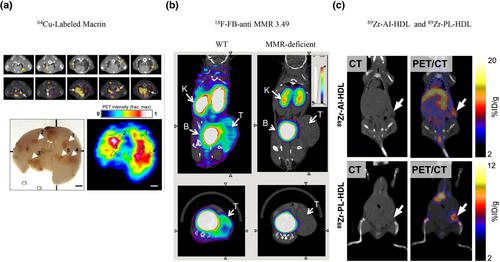
Representative probes to image TAMs. (a) CD206-targeted 64Cu-labeled macrin exhibits visually more noticeable accumulation in lung tumors [32]. Reproduced with permission from Ref. [32]. Copyright © American Chemical Society, 2018. (b) 18F-FB-anti-MMR 3.49 accumulates in MMR-expressing tumors, whereas uptake is barely detectable in MMR-deficient mice [34]. Reproduced with permission from Ref. [34]. Copyright & Usage © 2015 by the Society of Nuclear Medicine and Molecular Imaging, Inc. (c) Both tracers (89Zr-AI-HDL and 89Zr-PL-HDL) show strong uptake in the liver, kidneys, and tumor at 24 h after injection [35]. Reproduced with permission from Ref. [35]. Copyright & Usage © 2015 by the Society of Nuclear Medicine and Molecular Imaging, Inc. FB, fluorobenzoate; MMR, macrophage mannose receptor; TAMs, tumor-associated macrophages.
CD163 (hemoglobin scavenger receptor) is restricted to the monocyte–macrophage lineage and upregulated in TAMs. Eichendorff et al. developed an anti-CD163 antibody ([68Ga]ED2) and performed PET/CT imaging in rats with collagen-induced arthritis [36]. Surprisingly, no studies have attempted tumor imaging by targeting CD163.
Folate receptor beta (FR-β) is upregulated in TAMs. Its tracers include aluminum 18F-labeled 1,4,7-triazacyclononane-N,N′,N″-triacetic acid conjugated folate (18F-FOL) [37], and 18F-AzaFol [38]. These tracers show specific uptake in macrophages expressing FR-β. However, it should be noted that FR-β is also expressed on certain human cancer cells, which might hinder the clinical applicability of these tracers for macrophage-specific imaging [71]. Additionally, radiolabeled nanoparticles and liposomes can be used to visualize TAMs by their phagocytotic capacity, such as 89Zr-conjugated high-density lipoprotein (89Zr-PL-HDL and 89Zr-AI-HDL) (Figure 2c) [35]. Although F4/80 and CD11b are well-known macrophage markers, they are unsuitable imaging markers because the human analog of the former is an eosinophil-specific marker and of the latter is a pan-monocytic marker expressed on TAMs, MDSCs, and TANs [40, 69].
The tumor-permissive and immunosuppressive characteristics of TAMs have fueled interest in therapeutically targeting these cells. Tracers enable noninvasive visualization of TAMs by nuclear imaging and can deliver therapeutic radionuclides to the TME. However, further efforts should be made to identify specific markers and develop specific probes.
2.2 Imaging of TANs
Although TANs play a major role in the TME, tracers to visualize TANs are lacking. Some examples include the NE 680 FAST imaging agent, which emits fluorescence after cleavage by NE, a biomarker of TANs [41]. An amphiphilic semiconducting polymer conjugated with a hemicyanine (hemi-Cy) dye (SPCy) has been synthesized to detect NE. It passively targets the tumor and uncages the hemi-Cy in response to NE, leading to enhanced near-infrared fluorescence and photoacoustic signals of hemi-Cy [42]. Cinnamoyl-F-(D)L-F-(D)L-F (cFLFLF), which targets the formyl peptide receptor on inflammatory cells, including neutrophils, remains to be evaluated for TAN imaging [43]. However, because unresolved inflammation is common during tumor progression, cFLFLF might be a promising probe to evaluate local inflammation in the TME. Collectively, imaging of TANs is imperative for cancer immunotherapy but remains challenging. However, significant attention has been garnered to unravel its multifunctional capability in heterogeneous subpopulations, during which novel markers such as CCL4 have been characterized with the potential to develop new tracers [72].
2.3 Imaging of MDSCs
Because MDSCs share the same marker, CD11b, a 99mTc-labeled anti-CD11b mAb has been developed to image colon cancer, and tumor nodules as small as 3 mm could be clearly identified [44, 45]. Hoffmann and colleagues tracked the dynamic changes of MDSCs in vivo using a 64Cu-modified CD11b-specific mAb [45]. Additionally, a [89Zr]anti-CD11b Ab with high specificity was also developed recently [73]. However, CD11b is also expressed on macrophages and neutrophils, making it impossible to distinguish these cellular populations in vivo [1]. Therefore, Yu et al. conjugated mouse CD11b and Gr-1 (also known as Ly6G) antibodies with different quantum dots that produce near-infrared (NIR)-IIa and NIR-IIb signals, respectively. Granulocytic MDSCs were identified in a noninvasive manner through colocalization of both fluorescence signals (Figure 3a) [46]. In a similar approach, we believe that monocytic MDSCs can be visualized using anti-CD11b and anti-Ly6C antibodies.
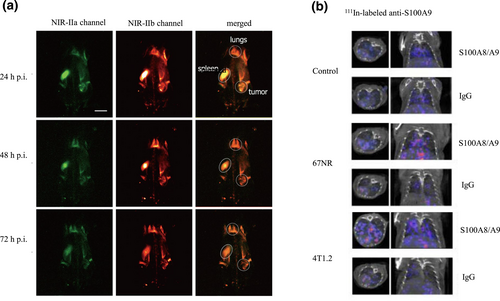
(a) In vivo noninvasive two-color fluorescence imaging of granulocytic MDSCs in the NIR-II window [46]. Reproduced with permission from Ref. [46]. Copyright © American Chemical Society, 2019. (b) 111In-labeled anti-S100A9 SPECT imaging of healthy control animals and 67NR or 4T1.2 tumor-bearing mice. Higher tracer uptake and more lesions are observed in the lung implanted with metastatic 4T1.2 cells compared with nonmetastatic 67NR cells and control mice [48]. Reproduced with permission from Ref. [48]. Copyright © The Authors. MDSC, myeloid-derived suppressor cells; NIR, near-infrared; SPECT, single-photon emission computed tomography.
Cathepsin B and Z are produced mainly by tumor-infiltrating myeloid lineage cells. More than three-quarters of the cathepsin-inducible fluorescent probe ProSense 680 localizes to MDSCs and CD11b+F4/80+ macrophages [47]. However, cathepsin is also expressed on macrophages and thus cannot distinguish MDSCs from macrophages. Similarly, S100A8/A9 is mainly released by MDSCs [74, 75]. Eisenblaetter and colleagues assessed MDSC abundance in premetastatic lung tissue by SPECT/CT using an 111In-labeled anti-S100A9 antibody. Their results indicated that the imaging signal in the premetastatic lung correlated significantly to the subsequent metastatic burden (Figure 3b) [48]. Considering the crucial role of MDSCs in priming metastatic niches, S100A8/A9-targeted imaging would be a potent probe to assess metastases [76].
However, because MDSCs share some cellular markers with TANs, further research is needed to find more specific markers and develop related probes.
2.4 Imaging of CAFs
FAP has emerged as the frontrunner to evaluate CAFs. Heidelberg et al. have developed quinoline-based FAP inhibitors (FAPIs), including FAPI-04 [49]. It shows rapid renal clearance and accumulation in tumors, leading to favorable tumor-to-background ratios (Figure 4) [49, 50]. Recently, a series of FAPI derivatives were also developed, such as FAPI-34 [78], FAPI-46 [51, 79], FAPI-74 [80], DOTA-2P(FAPI)2 [52], ND-bisFAPI [53], and DOTA.SA.FAPi and its homodimer, DOTAGA.(SA.FAPi)2 [81]. FAP-specific peptides, such as FAP-2286 and Alb-FAPtp-01, have longer tumor retention than the aforementioned small molecular FAPI derivates (Figure 4) [54, 82-84]. Considering that FAP-positive fibroblasts are present in many tumors, these tracers are promising pan-cancer probes, especially for tumors with low glucose metabolism [55]. Moreover, CAF-targeted radiopharmaceuticals have emerged as a novel and attractive strategy for cancer therapy, including those conjugated with 177Lu, 225Ac, and 131I [84-87]. Additionally, a series of albumin binder-modified FAPI-derived radiotracers have been developed, such as EB-FAPI-B1 [88], TEFAPI-06, TEFAPI-07, FAPI-C12, and FAPI-C16 [89, 90]. With accumulating knowledge on immunosuppressive CAFs, we anticipate that these tracers will play a critical role in tumor therapy. However, FAP is frequently not overexpressed on all CAFs. For example, only one CAF subset (CAF-S1), but not three other subtypes (CAF-S2–CAF-S4), show upregulated FAP expression in human breast cancer [91]. Thus, developing probes targeting other CAF markers is necessary.
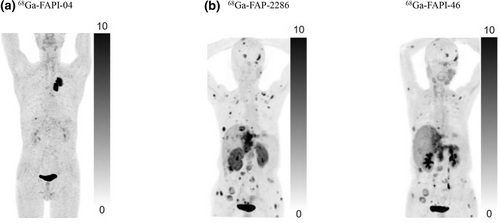
Representative PET images of a series of FAP-targeting probes. (a) A 76-year-old man with lung cancer who underwent 68Ga-FAPI-04 PET/CT at 1 h after injection. A marked radiotracer uptake is observed in the primary lesion. (b) Comparison of 68Ga-FAPI-46 and 68Ga-FAP-2286 PET/CT imaging in a 65-year-old woman with metastatic intrahepatic cholangiocarcinoma; 68Ga-FAP-2286 reveals a greater number of metastases and higher uptake than 68Ga-FAPI-46 [77]. Reproduced with permission from Ref. [77]. Copyright & Usage © 2023 by the Society of Nuclear Medicine and Molecular Imaging. FAP, fibroblast activation protein; PET/CT, positron emission tomography/computed tomography.
2.5 Imaging of T cells
Numerous reviews have discussed tracking T cells and imaging their antitumor immunity [92]. Therefore, we focus on immunosuppressive T cells and their biomarkers in the following section.
CD25 is a biomarker of regulatory T cells. The ligand of CD25, interleukin-2 (IL-2), has the potential to visualize Treg cells. 99mTc-labeled IL-2 estimates T cell numbers correlated significantly to histological estimates of CD25+ T cells (r = 0.745, p = 0.001) [56]. Interestingly, IL-2 is present in many types of tumors [93]. Conjugating IL-2 with therapeutic nuclides might be a potential treatment.
Immune checkpoints suppress T cell-mediated antitumor activity. Therefore, the need for noninvasive appraisal of immune checkpoints is growing. A 64Cu-labeled anti-mouse-PD-1 mAb (clone J43) specifically images PD-1 expression in tumors with a tumor-to-muscle uptake ratio as high as 11-fold (p < 0.05) [57]. 89Zr-labeled nivolumab was developed to noninvasively image PD-1 expression in tumors and may allow assessment of inter- and intratumoral heterogeneity (Figure 5a) [58]. Similar probes include 89Zr-Df-Pembrolizumab (Figure 5b) [59], 64Cu-PD-1-Liposome-DOX [60], 64Cu-NOTA-α-PD-1 (RMP1-14) [61], and 99mTc-JS001 [62]. CTLA-4 is another immune checkpoint. An 64Cu-anti-CTLA-4 mAb has displayed high accumulation in colon cancer models [63].
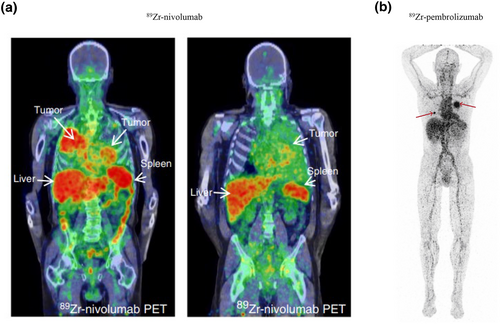
PET images of the immunosuppressive molecule PD1 in T cells. (a) 89Zr-Nivolumab PET/CT imaging demonstrates heterogeneous tracer uptake within and between tumors [58]. Reproduced with permission from Ref. [58]. Copyright © 2018, The Author(s). (b) 89Zr-pembrolizumab PET/CT scan at 7 days after tracer injection. Red arrows indicate tumor lesions [59]. Reproduced with permission from Ref. [59]. Copyright © 2022 The Authors. PD1, programmed cell death protein-1; PET/CT, positron emission tomography/computed tomography.
Together with advances in techniques such as single cell sequencing, exhausted CD8+ T cells are categorized into two major subsets: progenitor-exhausted T cells (Texprog) and terminally exhausted T cells (Texterm) [94-96]. Accordingly, exhaustion markers such as T cell factor 1, lymphocyte activation gene 3, and T cell immunoglobulin and mucin domain-containing protein 3 may be useful to identify functionally different cytotoxic T cells. T cell visualization would facilitate identifying patients who might have a favorable response to immune checkpoint blockade.
3 CONCLUSIONS AND CHALLENGES
With increasing attention on the pivotal roles of immunosuppressive cells in the TME, many drugs to disrupt these cells have been developed, and some clinical trials of combination therapy that targets both the tumor and immunosuppressive cells are ongoing [8, 97]. Thus, approaches that visualize the existence and abundance of these cells are significant and meaningful. A potential approach is to image targets specifically and noninvasively after a single dose of a tracer, and specifically upregulated molecules are promising markers. Several probes targeting these markers have shown promising results. Their fast renal clearance and evident accumulation in tumors result in favorable tumor-to-background ratios shortly after tracer administration, which is beneficial to evaluate the abundance of these immunosuppressive cells timely and noninvasively [98]. Because large numbers of immunosuppressive cells typically correlate to a low therapeutic response, high drug resistance, and a poor prognosis, these probes may also be used for early prediction of tumor responses before treatment. With increasing focus on combining cancer-centric therapeutics with immunosuppressive cell-targeted therapies, accurate and specific evaluation of immunosuppressive cells might be urgently needed in the future. Simultaneously, noninvasive imaging would be convenient for repetitive examination to monitor treatment efficacy, which might help to adjust a patient's therapeutic protocol in a timely manner. Furthermore, owing to the paramount importance of these immunosuppressive cells in premetastatic niche formation, imaging these cells provides the possibility for early metastasis detection and evaluating patient prognosis in addition to designing potential curative options [76, 98-100].
It should be noted that because of the phenotypic overlap among immunosuppressive cells and the phenotypic distinction between the same type of cells in different TMEs [69, 101], the challenge of an accurate quantitative and qualitative measurement of cellular subpopulations remains unresolved and should be a matter of further research. With ongoing efforts to characterize and decipher the function of these immunosuppressive cells, functional immunosuppressive cellular subsets are being defined and isolated, such as CD10+GPR77+ CAFs [102], Texprog and Texterm subpopulations [94-96]. All of these advances will facilitate characterizing novel markers specifically expressed on functional subsets and developing new tracers. Additionally, great advances have been made in image reconstruction methods for simultaneous in vivo imaging of two PET tracers and therefore independent quantification of two molecular signals, enabling accurate characterization and quantification of immunosuppressive cell subpopulations using two markers [103]. The TME is characterized by the aforementioned immunosuppressive cells as well as TECs, ECM, acidity, and hypoxia. Thus, further studies should be undertaken to develop diagnostic and therapeutic probes targeting these tumoral components.
AUTHOR CONTRIBUTIONS
Guangfa Bao drafted the manuscript, Jianyuan Zhou and Siyuan Cheng collected and rearranged the graphs, Jun Zhao edited the manuscript, Xiaohua Zhu revised and approved this review.
ACKNOWLEDGMENTS
None.
CONFLICT OF INTEREST STATEMENT
The authors declare that the research was conducted in the absence of any commercial or financial relationships that could be construed as a potential conflict of interest.
ETHICS STATEMENT
FAPI-04 PET/CT imaging was conducted under the license number 2020S187 granted by the Ethics committee of Tongji Medical College, Huazhong University of Science and Technology.
INFORMED CONSENT
Not applicable.
PERMISSION TO REPRODUCE MATERIAL FROM OTHER SOURCES
All copyrights of the reproduced figures in this review have been obtained.
CLINICAL TRIAL REGISTRATION
The clinical trial of FAPI-04 PET/CT imaging was registered and approved by the Ethics committee of Tongji Medical College, Huazhong University of Science and Technology.
Open Research
DATA AVAILABILITY STATEMENT
The datasets utilized during the current study are available from the corresponding author on reasonable request.


