The impact of global financial crisis on conventional and Islamic banks in the GCC countries
Abstract
Using large dataset from audited financial statements of 81 banks in the Gulf Cooperation Council (GCC) region, this article aims at assessing the performance of Islamic banks and conventional banks during the 2008 financial crisis. Unlike major studies that explored this area of study in the GCC countries, this paper investigates the performance of both types of banks before, during, and after the 2008 financial crisis, while covering four different financial performance measures, namely, efficiency, profitability, liquidity, and solvency. Moreover, this investigation is undertaken while covering a larger time span (2006–2012) than perhaps all similar works that covered similar study on the GCC region. With the use of mixed-effect linear regression, the paper shows that, compared with Islamic banks, conventional banks have sustained a better performance over the 2006–2012 period in relation to efficiency and return on assets. In this context, the paper puts a note on the shortcomings of the institutional arrangement of the Islamic banks that impeded their performance during the crisis as well as on the active role of GCC governments during the financial crash.
1 INTRODUCTION
It is very common to hear in different settings the strong resilience of Islamic banks as opposed to conventional banks during financial crises. This has been particularly more vocal in the context of 2008 financial crisis. The superior performance of Islamic banks, during crises, is almost taken for granted by a number of enthusiasts citing the advantages, which Sharia-based banking business model offers; the Islamic banks intermediation is asset based and focuses on risk sharing not allowing investment in type of financial products that instigate the kind global financial crisis like the one the world has experienced in 2008.
However, the work of recent studies (e.g., Beck, Demirgüç-Kunt, & Merrouche, 2013; Johnes, Izzeldin, & Pappas, 2014; Olson & Zoubi, 2017) appeals for more careful acceptance of the superiority of the Islamic banks performance during financial crisis.
Therefore, this work endeavours to follow this stream of investigation and question the resilience of Islamic banks in the GCC region during the global financial crisis. Unlike most of the studies in the area, our work contributes in this type of investigation while using a more comprehensive number of financial performance indicators, which are liquidity, solvency, profitability, and efficiency. This is done while covering a substantial sample of Islamic and conventional banks operating in the GCC region and investigates the issue while taking into consideration a longer time span, both before and after the global finance crisis (i.e., 2006–2012).
Second, the contribution is methodological; this means that the paper addresses the impact of the financial crisis on Islamic and conventional banks using sophisticated statistical technique, which is the mixed-effect regression. This technique generates more reliable results in comparison with the descriptive techniques or simple OLS regression that most of the studies in this area of research have used in order to test the impact of the global financial crisis on the banking system in the GCC countries.
The global financial crises that started in the United States in 2008 and spread all over the world put conventional banks in severe difficulties (see,e.g., Choon, Thim, & Kyzy, 2012; Wasiuzzaman & Gunasegavan, 2013). On the other hand, Islamic banks have managed not only to stay stable but also to benefit out of these crises (Ben Khediri, Charfeddine, & Ben Youssef (2015); Willison, 2009). This is attributable to the fact that Islamic banks operate in highly regulated operational environment guided by Shariah principles, which prohibits them to invest in the projects that adversely affect conventional banks that promote economic downturn and stimulated crisis (Hasan & Dridi, 2010). The principles of Islamic finance is based on risk-sharing, profit-loss sharing (PLS; such as Musharaka 1 and Mudharaba 2), as well as debt-based contracts (such as Murabaha 3 and Tawaruq 4). These contracts have to be backed by real economic transactions that entail tangible assets free from usurious (riba) practices, speculative and dishonest transactions (Alqahtani & Mayes, 2018; Beck et al., 2013). These fundamental standards make Islamic banks different from conventional banks. In addition, they use investment deposit and demand deposit in order to collect fund from depositors, which are free from interest and based on risk and PLS and mark up principles (Johnes et al., 2014). As a result, the notable growth rate of Islamic finance and its stability during the global financial crisis attracts the attention of the investors who were dissatisfied with conventional banks performance, policymakers, and financial experts (Johnes et al., 2014). As a result, forecasts estimate that it will double over the years 2014–2019 to more than US$3.4 trillion (Alam & Ennew, 2014). In fact, global Islamic financial services industry stood at US$2.293 trillion at the end of December 2016, an additional stock of US$150.01 billion over the last reporting year when the industry stood at US$2.143 trillion (at the end of 2015; see http://www.gifr.net/publications/gifr2017/intro.pdf) (GIFR, 2017). Also, Islamic banking is not limited only to Muslim countries. The sector in question rather extends its practices to non-Muslim countries as well. Indeed, recent forecasts estimate a healthy growth for the Islamic banking sector in countries such as the United Kingdom, the United States, and Australia. For example, in 2014, the U.K. government has confirmed that £200 million of Sukuks (Islamic Bonds), maturing in 2019, have been sold to investors based in the United Kingdom (HM treasury website).
Banking industry of GCC countries may be an excellent case for investigating comparative performance between full-fledged Islamic banks and conventional banks with Islamic branches and windows are operating under Shariah principle.
The paper is organized as follows. Section 1 presents the introduction. Section 2 discusses literature review and hypothesis development. Methodology of the study is included in Section 3. Section 4 highlights the results and analysis of the study. Finally, Section 5 presents the conclusion and proposes policy implication of the paper.
2 LITERATURE REVIEW AND HYPOTHESIS DEVELOPMENT
A number of studies have investigated the comparative analysis between the Islamic banks and conventional banks in terms of their profitability and efficiency performance using different sample and different methodologies. The interest in this issue was highlighted well before the financial crisis of 2008. For example, Metwally (1997) explored the financial performance of 15 Islamic banks and 15 conventional banks throughout 1992–1994 via Logit model, Discriminant Analysis, and Probit model and discovered comparable profitability and efficiency, but different liquidity, credit risk, and leverage between Islamic and conventional banks.
Similarly, Iqbal (2001) compared the performance of 12 Islamic and 12 conventional banks using mean test. His results showed better profitable and capitalized Islamic banks than conventional set of banks from1990 to 1998. Furthermore, Olson and Zoubi (2008) focused on the performance of 28 conventional banks and 16 Islamic banks of the GCC region during the period 2000 to 2005 applying mean test, Neural network, and Logit model. Their study revealed high profitability and less efficiency of Islamic banks compared with conventional banks while arguing that accounting ratios are good indicators and useful in gauges for differentiating two set of banks.
More recently, but covering a period that precedes the 2008 financial crisis, Ramlan and Adnan (2016) examined the profitability performance of Islamic and conventional banks in Malaysia between 2001 and 2006, using T-Test Model, regressions, and correlations. Their findings indicated that Islamic Banks were more profitable than conventional banks.
Subsequently, other research efforts have broadened their scope and compared the performance between the Islamic banks and conventional banks during 2008 financial crisis on their performance.
Alqahtani and Mayes (2018), for example, have evaluated the financial stability of Islamic and conventional banks prior to, during, and after financial shocks from 2000 to 2013. While using a sample of 76 banks across six economies of the GCC region, their study found that large Islamic banks exhibited weaker financial stability than the conventional banks highlighting their vulnerable resilience to shocks that spread over to real economic sectors. Although this study covers the issue of the Islamic and conventional banks' performance using sophisticated tests, it remains limited in terms of the number of financial performance indicators that have been used for such a purpose.
In another instance, Alqahtani, Mayes, and Brown (2017) explored the efficiency of 80 banks GCC countries during the global crisis using data envelopment analysis (DEA) and stochastic frontier analysis; the study found that although Islamic Banks are more cost efficient in 2008/2009 compared with conventional banks, they perform less well in terms of profit efficiency. The paper links this underperformance to difficulty of Islamic banks to deal with competition. The paper relates the overall resilience of the Islamic banks in the region to the constraints of these banks on trading in non-Sharia assets. This made them less exposed to the global financial crisis (see also Ahmed, 2009).
Similar to this study, Dulal Miah and Uddin (2017) have explored the efficiency and stability of 78 banks in the GCC countries using stochastic frontier analysis technique. Although this study is more comprehensive in terms of covering larger time span (i.e., 2005–2014), it remains, like the aforementioned study of Alqahtani et al. (2017), limited in terms of the scope of the assessed performance of Islamic and conventional banks.
Covering a larger time span, Ben Khediri et al., (2015) examined conventional banks and Islamic banks of GCC countries over 2003 to 2010. Using Logit model, discriminant analysis, tree of classification, and neural network model, they argued that Islamic banks are on average, more profitable, more liquid, better capitalized, and had lower credit risk than conventional banks during the financial crisis. The authors attribute this performance to a number of factors, such as the PLS type of contracts, and constraints on Islamic banks to invest in non-Sharia products. Although the work of these authors is quite comprehensive in terms of the number of statistical methods applied in the study, their explanation of the reasons why Islamic banks outperform conventional banks during the financial crisis is not clearly identified. This identification could have highlighted some interesting missing points as with regard, for example, to the role of GCC government during the crisis.
In their assessment of the impact of 2008 financial crisis on banking system, Johnes et al. (2014) found that the Islamic banks around the world were typically on a par with conventional ones in terms of gross efficiency, significantly higher on net efficiency and significantly lower on type efficiency. With the use of data envelopment analysis and meta-frontier analysis, the authors claim that Islamic bank managers have coped with the crisis better than those of conventional banks (based on the results of net efficiency). However, the opposite was true with regard to type efficiency suggesting that Islamic banks should shift to a more standardized process and less focus on customized contracts, which are costly and time consuming. These results are interesting; nevertheless, they are presented for a sample that is not entirely homogenous; hence, the generalization of these results as well as their associated arguments is to be taken with care.
Also, Beck et al. (2013) compared the business model, efficiency, and stability of a sample of conventional and Islamic banks over 1995 to 2009 period. The authors pointed that Islamic banks have higher profitability, higher assets quality, and higher capital ratios but less cost effectiveness than conventional banks.
In addition, the authors reported that Islamic banks are more capitalized during crisis and are less likely to disintermediate during crisis. However, they fail to explain the reasons behind the level of the Islamic banks enjoyed this level of capitalization during the crisis.
In addition, while covering a heterogeneous sample, Hasan and Dridi (2010) argued that Islamic banks have higher profitability, healthier capitalization, and lower credit risk than conventional banks. However, the authors acknowledge the need for the Islamic banks to address some important issues with regard to liquidity management as well as to supervisory and legal infrastructure.
It is to note that although the recent studies have generated many interesting results with regard to the impact of the 2008 financial crisis on the Islamic banking system and conventional banking, the literature has not addressed the issue in depth in the context of the GCC countries. Moreover, the conflicting outcomes regarding the performance the two different banks across the financial crisis calls for further investigation to see whether the Islamic banks in the GCC countries were more resilient than the conventional banks during the financial crisis. This is done while exploring a broader range of financial performance indicators, for a larger sample of banks in the GCC region, covering a more important time span. Consequently, our paper aims at investigating this issue while using four different financial performance indicators at the same time (viz., profitability, solvency, liquidity, and efficiency) for a large number of banks (i.e., 81 banks) and a larger time span (i.e., 2006–2012). Therefore, our paper tests the following hypotheses:
H1.There is a variation in profitability between Islamic and conventional banks during and after 2008 financial crisis.
H2.There is a variation in efficiency between Islamic and conventional banks during and after 2008 financial crisis.
H3.There is a variation in liquidity between Islamic and conventional banks during and after 2008 financial crisis.
H4.There is a variation in solvency between Islamic and conventional banks during and after 2008 financial crisis.
3 METHODOLOGY
The sample covers 81 banks operating in the following GCC countries: UAE, Bahrain, Kuwait, Oman, Saudi Arabia, and Qatar (see Appendix C). The total sample comprises 48 conventional banks and 33 Islamic banks.
With the help of STATA, the paper uses mixed-effect regression to test the hypotheses of the study opting for the fixed effect. This option allows for testing the relationship between independent and dependent variables within the countries while controlling for their respective individual characteristics.

3.1 Variables definition
Yi,j,t is the dependent variable, which refers to the performance measures (ROA, ROE, efficiency, liquidity, and solvency). Note that the efficiency is measured by the ratio revenue to assets; liquidity is measured by the ratio loans to total assets, and solvency is measured by the ratio debt to equity.
The independent variable “Bank type” refers to (a) conventional banks and (b) Islamic banks.
The independent variable “Crisis” covers three different stages: (a) precrisis (2006 and 2007); (b) crisis period (2008–2009); and (c) postfinancial crisis (2010–2012).
The independent variable “Crisis* bank type” captures the behaviour of the conventional banks and Islamic banks during the crisis.
Also, following Alqahtani and Mayes (2018), GDP, inflation, and oil prices are macroeconomic variables that are included in order to account for the effect of macroeconomic cycles of oil-based economies 5(see also Alqahtani & Boulanouar, 2017; Demirguc-Kunt, Laeven, & Levine, 2003; Imam & Kpodar, 2014).
The ROA and ROE are amongst the ratios used in order to gauge the profitability of banks (see,e.g., Iqbal & Molyneux, 2005; Ramlan & Adnan, 2016). Higher ROA and ROE ratios indicate better profitability bank.
As for the other ratios, namely, solvency, liquidity, and efficiency ratios, are all associated with assessing the performance of banks in terms of their ability to manage risk and assets (see,e.g., Ramlan & Adnan, 2016; Zarrouk, 2012).
The data regarding these ratios are gathered from Audited Financial Statements for both Islamic and conventional local banks operating in the above-mentioned GCC countries. The data cover the period 2006–2012, so the period pre-2008 and post-2008 financial crisis is examined adequately. There are 33 Islamic banks (which constitute 40% of the total sample) and 44 conventional banks (i.e., 60% of the total sample). The names of the banks are underlined in Tables D1 and D2.
4 RESULTS AND DISCUSSION
The results (see Tables A1-A5) show that the variation between Islamic banks and conventional banks over the global financial crisis is noted only with regard to two performance measures, which are the profitability (as measured by ROA ratio) and efficiency (as measured by the revenue to assets ratio). Moreover, this variation shows that, unlike the findings of some other studies (e.g., Ben Khediri et al., 2015; Hasan & Dridi, 2010; Johnes et al., 2014), the conventional banks shows a better resilience in terms of efficiency and profitability than Islamic banks during and after the financial crisis. Similar result was reported by Alqahtani et al. (2017), who showed that Islamic banks performed less well (less resilient) than conventional banks in terms of profit efficiency during the global financial crisis.
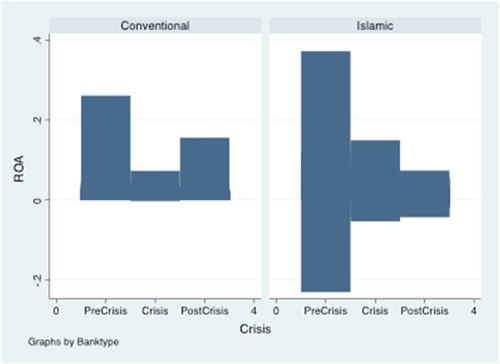
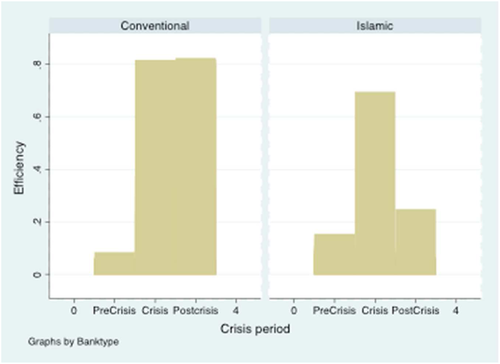
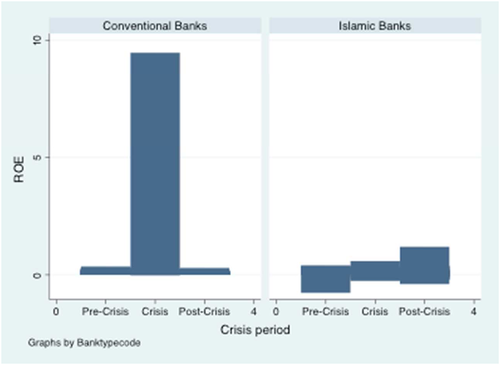
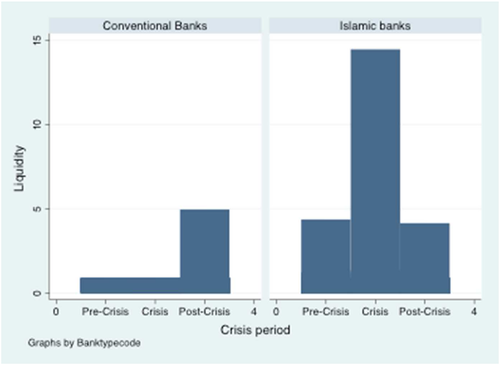
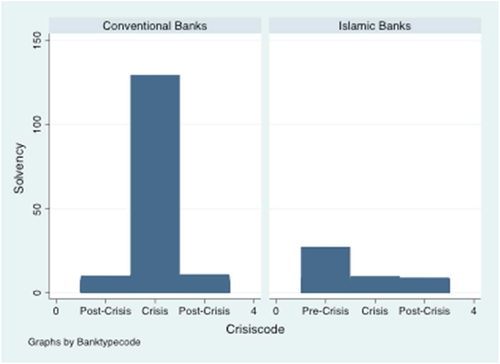
One might have predicted that the mismanagement of the assets due to excessive investments and loans that the conventional banks have undertaken during the boom period that preceded the crisis would have generated worse profitability (ROA) and efficiency (revenue/assets) performance than Islamic Banks. This would have made the conventional banks very vulnerable to any sharp decline in the demand for their products. However, the aforementioned results of our research might indicate a number of points worked in favour to conventional banks compared with Islamic, which helped them sustain a better resilience as judged by the two mentioned ratios. It appears that although Islamic banks enjoyed a stronger asset growth during 2007–2009 compared with conventional banks, the Islamic banks' asset growth decelerated quite rapidly after the 2008 financial crisis, faster than that of conventional banks (see Hasan & Dridi, 2010). According to Hasan and Dridi (2010), the weaker performance for Islamic banks in 2009 could be the reason behind the decline in assets growth rates in some countries. In our study, this is supported by Graphs B1 and B2, 6 which show the underperformance of the Return On Assets and Revenue to Assets ratios for the Islamic banks compared with conventional banks particularly during and after the financial crisis. In addition to this, this result underlines weaknesses in relation to institutional structure of Islamic banks (at least during the crisis). The challenges that Islamic banks have been facing relate, for example, to a shallow money market due to the small number of participants and the absence of instruments that could be used as a collateral for borrowing or could be discounted at the central bank window; add to this the inability to attract or maintain deposits by promising higher returns (Hasan & Dridi, 2010). Moreover, weaker efficiency of Islamic banks during and after the financial crisis could be attributed to the lack of product standardization (Johnes et al., 2014). The Islamic banks operate with customized contracts, which are time consuming and therefore requires additional costs; this is exacerbated by the fact that their products necessitate the approval from the Shariah board of the bank, hence, incurring administrative costs and higher operational risks compared with conventional banks (Johnes et al., 2014).
Moreover, the role of the governments of the GCC might explain the discrepancy in the resilience between the two types of banks. Indeed, the governments of the GCC countries were fairly quick in injecting capital to their banking system. What might have made the process smooth is that the liquidity support in the form of government deposits is easier to be directed to conventional banks given the easiness of auctioning government deposits to conventional banks (Hasan & Dridi, 2010). For example, the UAE banks received capital injections by the government in 2009 raising the capital adequacy ratio of the banks from 13% to 17% between 2008 and 2009, making them amongst the best capitalized banks in the emerging countries (Al-Hassan, Khamis, & Qulidi, 2010). Equally, the GCC governments of Saudi Arabia, Kuwait, and Qatar injected additional liquidity and capital to the bank sector to protect it from the global financial crisis (Wigglesworth, 2008, October 12). Also, central banks of the region have played a pivotal role in managing liquidity inflows via macroeconomic management of exchange rate and interest rate responses to prevent the credit crunch from further infecting the GCC countries.
5 CONCLUSION AND POLICY IMPLICATIONS
This study examines the impact of the financial crisis of 2008 on the performance of the GCC Islamic and conventional banks. The primary objective is to explore how resilient conventional banks and Islamic banks to the 2008 financial crisis. This is done while assessing the performance of the two types of banks using an exhaustive number of performance measures (i.e., five measures).
The paper provides empirical evidence that the sustainability of GCC conventional banks and their resilience during the economic crisis was partly due to timely intervention of the GCC governments with capital injections, which helped soften the liquidity crunch making the recovery time frame surprisingly short.
Moreover, the research concludes that the Islamic banks showed less resilience to the global financial crisis than the conventional banks underscoring a number of shortcomings linked to the structure and institutional arrangement of the Islamic banks.
The results of this study can assist today's Islamic bank managers by assisting them to draw new perspectives of corporate governance reforms on the area of risk management. Although the nature of their business was not responsible (at least directly) in the origins of the financial crisis given the fact that they did not deal with the CDOs and other toxic financial products, the assessment of the impact of the 2008 financial crisis underlines the need of these banks to deal with weaknesses in managing risks and their ability to have more flexible governance arrangement that allows them to operate in the financial market in more flexible way while offering products that entail less cost structure.
Also, amongst other lessons from the financial crisis for banks are to develop effective internal control and risk management system with proactive oversight under the authority of a chief risk officer. The individual filling this position should be a knowledgeable person, be under control of the board, and should have complete authority and responsibility to implement a risk management system. Moreover, policymakers and accounting standard setters need to develop more transparent, enhanced financial reporting and effective disclosure in the aftermath of the 2008 financial crisis to boost investor trust. Third and finally, merger, acquisitions, and takeovers have become a necessity in the GCC banking sector following the adverse effects of global financial crisis as a way to synergize their operating capacities, expand their presence on global market, diversify their operations, eliminate their risks, minimize their expenses, and survive and compete with the rivals.
Lastly, one needs to note that the conclusions are limited to GCC banks and cannot be applied to banks in other regions without further empirical investigation.
APPENDIX A
| ROA | Estimate | Coefficient | SE | z | P > |z| | [95% CI] |
|---|---|---|---|---|---|---|
| Countrycode | −0.0011825 | 0.0012143 | −0.97 | 0.330 | [−0.0035626, 0.0011975] | |
| Crisiscode | −0.0003864 | 0.0076444 | −0.05 | 0.960 | [−0.0153692, 0.0145964] | |
| Banktypecode | 0.0275775 | 0.0113461 | 2.43 | 0.015 | [0.0053396, 0.0498154] | |
| bankcrisis | −0.0107301 | 0.0048207 | −2.23 | 0.026 | [−0.0201785, −0.0012817] | |
| GDPGROWTH | 0.0006639 | 0.0006916 | 0.96 | 0.337 | [−0.0006916, 0.0020194] | |
| OILprice | 0.0002546 | 0.0001384 | 1.84 | 0.066 | [−0.0000166, 0.0005258] | |
| Inflation | −0.0001374 | 0.0006998 | −0.20 | 0.844 | [−0.001509, 0.0012343] | |
| _cons | −0.0037393 | 0.0188991 | −0.20 | 0.843 | [−0.0407809, 0.0333022] | |
| Random-effects parameters | ||||||
| sd (Residual) | 0.0339597 | 0.0013361 | [0.0314394, 0.0366821] |
- Note. Performance measure: ROA. Mixed-effects ML regression. Number of obs = 323. Wald χ2 (7) = 39.42. Log likelihood = 634.25598. P > χ2 = 0.0000.
| Efficiency | Estimate | Coefficient | SE | z | P > |z| | [95% CI] |
|---|---|---|---|---|---|---|
| Countrycode | −0.006456 | 0.0034985 | −1.85 | 0.065 | [−0.0133129, 0.0004009] | |
| Crisiscode | 0.0397816 | 0.0220237 | 1.81 | 0.071 | [−0.0033841, 0.0829473] | |
| Banktypecode | 0.061813 | 0.0326882 | 1.89 | 0.059 | [−0.0022547, 0.1258807] | |
| bankcrisis | −0.0259813 | 0.0138885 | −1.87 | 0.061 | [−0.0532022, 0.0012397] | |
| GDPGROWTH | −0.0000871 | 0.0019925 | −0.04 | 0.965 | [−0.0039923, 0.0038181] | |
| OILprice | −0.0001995 | 0.0003986 | −0.50 | 0.617 | [−0.0009808, 0.0005818] | |
| Inflation | −0.0002674 | 0.0020162 | −0.13 | 0.894 | [−0.0042191, 0.0036842] | |
| _cons | 0.0034969 | 0.0544486 | 0.06 | 0.949 | [−0.1032204, 0.1102142] | |
| Random-effects parameters | ||||||
| sd (Residual) | 0.0978385 | 0.0038494 | [0.0905774, 0.1056818] |
- Note. Performance measure: Efficiency (Revenue/Total assets). Mixed-effects ML regression. Number of obs = 323. Wald χ2 (7) = 7.79. Log likelihood = 292.47589. P > χ2 = 0.3514.
| ROE | Estimate | Coefficient | SE | z | P > |z| | [95% CI] |
|---|---|---|---|---|---|---|
| Countrycode | 0.0293779 | 0.0191175 | 1.54 | 0.124 | [−0.0080916, 0.0668475] | |
| Crisiscode | −0.1320033 | 0.1211321 | −1.09 | 0.276 | [−0.3694178, 0.1054112] | |
| Banktypecode | −0.1343109 | 0.1803441 | −0.74 | 0.456 | [−0.4877789, 0.2191571] | |
| bankcrisis | 0.0163926 | 0.076874 | 0.21 | 0.831 | [−0.1342776, 0.1670628] | |
| GDPGROWTH | 0.0000197 | 0.0109047 | 0.00 | 0.999 | [−0.0213532, 0.0213925] | |
| OILprice | 0.0034934 | 0.0022124 | 1.58 | 0.114 | [−0.0008429, 0.0078298] | |
| Inflation | −0.0041094 | 0.0110191 | −0.37 | 0.709 | [−0.0257064, 0.0174876] | |
| _cons | 0.2104842 | 0.2985935 | 0.70 | 0.481 | [−0.3747484, 0.7957167] | |
| Random-effects parameters | ||||||
| sd (Residual) | 0.5336968 | 0.0212293 | [0.4936688, 0.5769705] |
- Note. Performance measure: ROE. Mixed-effects ML regression. Number of obs = 316. Wald χ2 (7) = 8.14. Log likelihood = −249.95954. P > χ2 = 0.3203.
| Liquidity | Estimate | Coefficient | SE | z | P > |z| | [95% CI] |
|---|---|---|---|---|---|---|
| Countrycode | −0.0310946 | 0.0307282 | −1.01 | 0.312 | [−0.0913209, 0.0291316] | |
| Crisiscode | 0.0151194 | 0.1934408 | 0.08 | 0.938 | [−0.3640175, 0.3942564] | |
| Banktypecode | 0.1440886 | 0.2871102 | 0.50 | 0.616 | [−0.418637, 0.7068143] | |
| bankcrisis | −0.0471475 | 0.1219867 | −0.39 | 0.699 | [−0.2862371, 0.191942] | |
| GDPGROWTH | 0.0011168 | 0.0175005 | 0.06 | 0.949 | [−0.0331836, 0.0354172] | |
| OILprice | 0.0027752 | 0.0035014 | 0.79 | 0.428 | [−0.0040874, 0.0096378] | |
| Inflation | −0.0082359 | 0.0177088 | −0.47 | 0.642 | [−0.0429444, 0.0264727] | |
| _cons | 0.6510686 | 0.4782383 | 1.36 | 0.173 | [−0.2862613, 1.588398] | |
| Random-effects parameters | ||||||
| sd (Residual) | 0.8593448 | 0.0338105 | [0.7955682, 0.9282342] |
- Note. Performance measure: Liquidity (Total Loan/Total assets). Mixed-effects ML regression. Number of obs = 323. Wald χ2 (7) = 2.32. Log likelihood = −409.35519. P > χ2 = 0.9397.
| Solvency | Estimate | Coefficient | SE | z | P > |z| | [95% CI] |
|---|---|---|---|---|---|---|
| Countrycode | 0.6591316 | 0.2579166 | 2.56 | 0.011 | [0.1536244, 1.164639] | |
| Crisiscode | −2.46991 | 1.624744 | −1.52 | 0.128 | [−5.654349, 0.7145289] | |
| Banktypecode | −4.729573 | 2.408877 | −1.96 | 0.050 | [−9.450885, −0.0082613] | |
| bankcrisis | 1.05751 | 1.02522 | 1.03 | 0.302 | [−0.9518834, 3.066904] | |
| GDPGROWTH | −0.1067085 | 0.1467359 | −0.73 | 0.467 | [−0.3943055, 0.1808885] | |
| OILprice | 0.0515812 | 0.0293934 | 1.75 | 0.079 | [−0.0060289, 0.1091912] | |
| Inflation | −0.091114 | 0.1484819 | −0.61 | 0.539 | [−0.3821332, 0.1999052] | |
| _cons | 9.34514 | 4.010204 | 2.33 | 0.020 | [1.485284, 17.205] | |
| Random-effects parameters | ||||||
| sd (Residual) | 7.205265 | 0.2839272 | [6.669725, 7.783806] |
- Note. Performance measure: Solvency (Debt/Equity). Mixed-effects ML regression. Number of obs = 322. Wald χ2 (7) = 21.66. Log likelihood = −1,092.7877. P > χ2 = 0.0029.
APPENDIX B
APPENDIX C
| by Banktype Crisisperiod, sort: table Time, contents (mean ROA mean ROE mean Liquidity mean Efficiency mean Solvency) | |||||
|---|---|---|---|---|---|
| -> Banktype = Conventional, Crisisperiod = precrisis | |||||
| -- Time | mean (ROA) | mean (ROE) | mean (Liquidity) | mean (Efficiency) | mean (Solvency) |
| 2006 | .041819 | .207412 | .824508 | .045837 | 5.79688 |
| 2007 | .023953 | .163355 | .814339 | .03838 | 6.197 18 |
| > Banktype = Islamic, Crisisperiod = precrisis | |||||
| -- Time | mean (ROA) | mean (ROE) | mean (Liquidity) | mean (Efficiency) | mean (Solvency) |
| 2006 | .029211 | .122886 | .655016 | .066802 | 4.71879 |
| 2007 | .064511 | .174056 | .83146 | .076639 | 2.9483 |
| -> Banktype = Conventional, Crisisperiod = crisis | |||||
| -- Time | mean (ROA) | mean (ROE) | mean (Liquidity) | mean (Efficiency) | mean (Solvency) |
| 2008 | .019655 | .461285 | .790013 | .06443 | 10.8453 |
| 2009 I | .013985 | .098815 | .83730 1 | .065976 | 6.10625 |
| -> Banktype = Islamic, Crisisperiod = crisis | |||||
| -- Time | mean (ROA) | mean (ROE) | mean (Liquidity) | mean (Efficiency) | mean (Solvency) |
| 2008 | .041787 | .106169 | 1.47806 | .061283 | 4.00589 |
| 2009 | .009382 | .081028 | .738616 | .082552 | 4.416 |
| -> Banktype = Conventional, Crisisperiod = postcrisis | |||||
| -- Time | mean (ROA) | mean (ROE) | mean (Liquidity) | mean (Efficiency) | mean (Solvency) |
| 2010 | .013952 | .098276 | .840269 | .064463 | 5.79278 |
| 2011 | .016034 | .110875 | .831843 | .06292 | 5.79211 |
| 2012 | .021202 | .112916 | .955928 | .072189 | 5.78708 |
| -> Banktype = Islamic, Crisisperiod = postcrisis | |||||
| -- Time | mean (ROA) | mean (ROE) | mean (Liquidity) | mean (Efficiency) | mean (Solvency) |
| """"2010" """" | "007833 | 02863"1 | 892027 | 05268 | 4"74143 |
| 2011 | .014144 | .0559 | .723366 | .03992 | 5.10851 |
| 2012 | .011427 | .14196 | .664301 | .040093 | 5.58931 |
APPENDIX D
| UAE | Qatar | Bahrain | Kuwait | Oman | KSA |
|---|---|---|---|---|---|
| Dubai Islamic Bank | Masraf Alrayan | Bahrain Islamic Bank | Boubyan Bank | Bank Dhofar | Bank ALBLAD |
| Sharjah Islamic Bank | Barwa Bank | Al Baraka Islamic Bank | Kuwait Finance House | Ahli Bank | Al Jazira Bank |
| Noor Bank | Qatar Islamic Bank | Al Salam Bank | Oman | Al Izz Islamic Bank | Alnima Bank |
| Emirates Islamic Bank | Qatar International Islamic Bank | Ithmar Bank | Bank Dhofar | Bank of Nizwa | Al Rajhi Bank |
| Al Hilal | Khaleeji Commercial Bank | Ahli Bank | GIB Capital | ||
| Warba Bank | Riyadh Capital | ||||
| NCB Capital | |||||
| Islamic Cooperation for the Development of the Private Sector | |||||
| Islamic Development Bank |
- Note. GCC: Gulf Cooperation Council.
| UAE | Qatar | Bahrain | Kuwait | Oman | KSA |
|---|---|---|---|---|---|
| Bank of Sharjah | The Commercial Bank of Qatar | National Bank of Bahrain | Al Ahli Bank of Kuwait | National Bank of Oman | SAMBA |
| Arab Bank | Doha bank | Bahrain Development Bank | Burgan Bank | Bank Muscat | RIYAD BANK |
| Emirates Investment | Qatar national Bank | Bank of Bahrain and Kuwait | Gulf Bank | Saudi Arabia British Bank | |
| Ajman | Bahrain | Commercial Bank of Kuwait | Saudi Hollandi Bank | ||
| Union National Bank | National Bank of Bahrain | Bangul Saudi | |||
| National Bank of Fujairah | Bahrain Development Bank | The National Commercial Bank | |||
| MASHREQ BANK | Bank of Bahrain and Kuwait | The Saudi British Bank | |||
| First Gulf Bank | The International bank of Qatar | Saudi Investment Bank | |||
| Commercial Bank of Dubai | Qatar Industrial Development Bank | Banque Saudi France | |||
| Abu Dhabi Commercial Bank | Bank Saderat Iran | Arab National Bank | |||
| Emirates NBD | Bank Al-Bilad | ||||
| National Bank of Abu Dhabi | Asia Bank | ||||
| National Bank of R.A.K. | |||||
| United Arab Bank | |||||
| InvestBank | |||||
| Commercial bank international | |||||
| Emirates NBD Bank |
- Note. GCC: Gulf Cooperation Council.
REFERENCES
- 1 Partnership
- 2 Money management
- 3 Cost plus financing
- 4 To buy on credit and sell at spot value
- 5 Based on the work of Iman and Kpodar (2013), Alqahtani and Mayes (2018) recognize the role of oil prices in the expansion of Islamic banks.
- 6 B1-B5 and Appendix C report nice descriptive and graphical illustration of the performance of Islamic banks and conventional banks across the period 2006–2012 (precrisis/crisis/postcrisis period).


