Targeting euchromatic histone lysine methyltransferases sensitizes colorectal cancer to histone deacetylase inhibitors
Tianzuo Zhan and Michael Boutros have contributed equally to this study.
Funding information: German Research Foundation, Grant/Award Number: SFB1324, Herbert-Steinbeisser-MD-fellowship; Ministerium für Wissenschaft, Forschung und Kunst Baden-Württemberg, SonderlinieMedizin; German Research Foundation, Grant/Award Number: EB 187/8-1; German Academic Scholarship Foundation (Studienstiftung); SEED program of the Medical Faculty Mannheim, Heidelberg University; MD scholarship program of the Medical Faculty Mannheim, Heidelberg University
Abstract
Epigenetic dysregulation is an important feature of colorectal cancer (CRC). Combining epigenetic drugs with other antineoplastic agents is a promising treatment strategy for advanced cancers. Here, we exploited the concept of synthetic lethality to identify epigenetic targets that act synergistically with histone deacetylase (HDAC) inhibitors to reduce the growth of CRC. We applied a pooled CRISPR-Cas9 screen using a custom sgRNA library directed against 614 epigenetic regulators and discovered that knockout of the euchromatic histone-lysine N-methyltransferases 1 and 2 (EHMT1/2) strongly enhanced the antiproliferative effect of clinically used HDAC inhibitors. Using tissue microarrays from 1066 CRC samples with different tumor stages, we showed that low EHMT2 protein expression is predominantly found in advanced CRC and associated with poor clinical outcome. Cotargeting of HDAC and EHMT1/2 with specific small molecule inhibitors synergistically reduced proliferation of CRC cell lines. Mechanistically, we used a high-throughput Western blot assay to demonstrate that both inhibitors elicited distinct cellular mechanisms to reduce tumor growth, including cell cycle arrest and modulation of autophagy. On the epigenetic level, the compounds increased H3K9 acetylation and reduced H3K9 dimethylation. Finally, we used a panel of patient-derived CRC organoids to show that HDAC and EHMT1/2 inhibition synergistically reduced tumor viability in advanced models of CRC.
Graphical Abstract
What's new?
Histone deacetylase (HDAC) inhibitors have limited efficacy in colorectal cancer; however, drug combinations have been suggested as a promising approach to improve their antineoplastic activity. Here, exploiting the concept of synthetic lethality with CRISPR-Cas9 screens, the authors identify euchromatic histone-lysine N-methyltransferases 1 and 2 (EHMT1/2) as epigenetic targets that strongly sensitize colorectal cancer cells to treatment with HDAC inhibitors. They show in different colorectal cancer models that combinations of HDAC and EHMT1/2 inhibitors synergistically inhibit proliferation through distinct cellular mechanisms. This combination of two epigenetically active agents provides a novel treatment strategy for colorectal cancer.
Abbreviations
-
- CRC
-
- colorectal cancer
-
- DigiWest
-
- digital Western blot
-
- EHMT
-
- euchromatic histone-lysine N-methyltransferase
-
- EHMTi
-
- EHMT inhibition
-
- H3K9ac
-
- H3K9 acetylation
-
- H3K9me1/2
-
- H3K9 mono- and demethylation
-
- HDAC
-
- histone deacetylase
-
- HDACi
-
- HDAC inhibition
-
- HSA
-
- highest single agent synergy score
-
- IHC
-
- immunohistochemistry
-
- MOI
-
- multiplicity of infection
-
- PDO
-
- patient-derived organoids
-
- UICC
-
- Union for International Cancer Control
-
- ZIP
-
- zero interaction potency synergy score
1 INTRODUCTION
An estimated 1.8 million new cases of colorectal cancer (CRC) are diagnosed worldwide per year, with a rising global incidence.1 Many patients with CRC are diagnosed with metastatic disease and require a systemic therapy. Thus, the development of novel treatment strategies is a major research topic. Carcinogenesis of CRC is driven by genetic and epigenetic dysregulations.2 Besides DNA methylation, aberrant posttranslational modification of histones is frequently observed and linked to important features of tumor biology. For instance, hypoacetylation of histone H3 and H4 or methylation of H3 modulate the activity of cancer pathways.3 In CRC, many histone deacetylases (HDACs) are overexpressed, indicating a functional relevance,4 and pharmacological HDAC inhibitors (HDACi) were explored in preclinical and clinical studies.5, 6 The biological mechanisms by which HDACi exhibit their antineoplastic activity are diverse and include the induction of cell cycle arrest, differentiation and the modulation of autophagy.7 Although HDACi are clinically approved for the treatment of subtypes of myelomas and lymphomas, they have only minor clinical efficacy in CRC.8 In contrast, combining HDACi with other anticancer drugs revealed promising effects in preclinical models and clinical trials, harnessing the idea that the true potential of HDACi might be unlocked by combination therapies.9 The discovery of effective drug combinations can rely on the concept of synthetic lethality,10 which proposes that the loss-of-function of specific genes, either by genetic inactivation or pharmacological inhibition, can render cancer cells vulnerable to the functional loss of a second gene. Examples for the successful clinical application of synthetic lethality include the use of PARP inhibitors in BRCA-deficient cancers11 and the combination of all-trans retinoic acid and arsenic trioxide for the treatment of promyelocytic leukemia.12 In this context, functional genomics screens using CRISPR/Cas have been applied to systematically explore synthetic lethal interactions for antineoplastic drugs.13
Here, we used CRISPR/Cas9 screens to identify synthetic lethal interactions with HDACi in CRC. We developed an sgRNA library directed against epigenetic regulators and identified the histone methyltransferases EHMT1 and EHMT2 as strong modulators of the response to HDACi. By studying tumor samples from a large CRC cohort, we found that EHMT2 protein expression correlated with patient survival. Co-targeting EHMT1/2 and HDAC by small molecule inhibitors synergistically reduced tumor growth, by eliciting distinct cellular mechanisms. Finally, we validated the synergistic effects of this drug combination in a panel of patient-derived CRC organoids (PDO).
2 MATERIALS AND METHODS
See Supplementary Methods section for extended information.
2.1 Cell culture
HCT116 (RRID:CVCL_0291), SW480 (RRID:CVCL_0546) and HT29 (RRID:CVCL_0320) were purchased from ATCC. HCT116 and HT29 were cultured in McCoy's (Thermo Fisher, Waltham, MA) and SW480 in RPMI medium (Thermo Fisher), supplemented with 10% v/v fetal calf serum (PAA). All cell lines have been authenticated using SNP profiling within the last 3 years (Multiplexion, Heidelberg, Germany). Absence of mycoplasms was regularly controlled by a PCR-based test. All experiments were performed with mycoplasma-free cells.
2.2 Compounds
Vorinostat, UNC0638, UNC0642, A-366, chloroquine diphosphate salt and actinomycin D were purchased from Merck. Lys05 and panobinostat were purchased from Selleckchem. BIX-01294 and Z-VAD(OMe)-FMK were purchased from TargetMol. Human recombinant KillerTRAIL was obtained from Enzo Life Sciences and TNF-α from Peprotech.
2.3 Generation of CRISPR knockout cell library and screening
SW480 cells with stable expression of Cas9-2A-puromycin were generated using the piggybac transposon system.14 4 × 10⁷ SW480-Cas9 cells were infected with lentiviral particles containing the sgRNA library at a multiplicity of infection (MOI) of 0.3 to 0.4 as previously described.14 72 h after transduction, cells were reseeded into T225 flasks (Thermo Fisher) and selected with 4 μg/mL blasticidin (Thermo Fisher) for 72 h. Subsequently, medium with blasticidin was removed and cells were allowed to recover for up to 7 days. For screening, 1.4 × 10⁷ cells were seeded per replicate in T225 flasks, resulting in >1.000-fold library representation. The next day, drugs were added (0.1% v/v DMSO, 3 μM vorinostat, 8 nM panobinostat) and replaced on days 4, 11 and 16 (for vorinostat) and 4, 8 and 11 (for panobinostat). Cells were harvested at day 17 (vorinostat) or 14 (panobinostat), and pellets containing 1.2 × 10⁷ cells were used for DNA extraction and library preparation. For each experimental condition, two replicates were performed.
2.4 Isolation of genomic DNA, library preparation and sequencing
Genomic DNA was extracted from 3.6 × 10⁷ pelleted cells per replicate using the DNeasy Blood & Tissue Kit (Qiagen), including preincubation with 200 μg/ml RNAse A (Qiagen) for 5 min. Concentration of eluted DNA was determined with a Qubit fluorometer using the dsDNA HS assay kit (both Thermo Fisher Scientific). DNA amplification was done as previously described.14 Per replicate, 25 PCR reactions were performed using 1 μg genomic DNA as input. Q5 Hot Start HF polymerase (NEB) was used with the primers SEQ-F1 (TTGCTCTGGAAAACTCATTTGC) and SEQ-R1 (TTAGGGGCGGGACTATGG) and the following PCR conditions: 98°C for 2 min, 25 cycles of 98°C for 10 s, 62°C for 15 s and 72°C for 30 s, final extension at 72°C for 2 min. The PCR product was cleaned using a QIAquick PCR purification Kit (Qiagen), and 5 ng of the eluted DNA was used for a second PCR step with the primers SEQ-F2 (AATGATACGGCGACCACCGAGATCTACACTCTTTCCCTACACGACGCTCTTCCGATCTNNNNNNTCTTGTGGAAAGGACGAAACACCG) and SEQ-R2 (CAAGCAGAAGACGGCATACGAGAT[Index]GTGACTGGAGTTCAGACGTGTGCTCTTCCGATCAACTTCGGAATTCGTGTGCTCGAG), and the following PCR conditions: 98°C for 2 min, 15 cycles of 98°C for 10 s, 72°C for 15 s, and 72°C for 30 s, final extension at 72°C for 2 min. The product was purified with Agencourt AMPure XP beads (Beckman Coulter) at a product-to-beads ratio of 1:1.2. The purified libraries were controlled for correct size using the DNA High Sensitivity Assay on a BioAnalyzer 2100 (Agilent) and then sequenced on a MiSeq (Illumina) by 100 or 150 bp single-end sequencing, with the addition of 20% PhiX Control v3 (Illumina) at a concentration of 8 pM. The sequencing coverage and quality statistics for each sample are summarized in Table S1.
2.5 Immunohistochemistry
Antibody staining was performed as previously described15 with 1:50 diluted anti-EHMT2 antibodies (Atlas Antibodies). Staining intensity was determined in normal colon epithelia and tumor cells using previously published, custom-made CRC tissue microarrays.16 The intensity of nuclear staining was scored on a semi-quantitative scale as 0 (negative), 1 (weakly positive, >0%-33%), 2 (moderately positive, 33%-67%) and 3 (strongly positive, 67%-100%) by a trained examiner who was blinded towards all patient data. Images were acquired using a standard brightfield microscope (Leica DMRE), DFC450C microscope camera and LAS 4.12 software (all Leica Microsystems). The median intensity scores of 1 to 3 separate cancer tissue cores per patient were used for analysis.
2.6 Short-term and long-term viability assays
Short-term and long-term viability assays were conducted as published before.17 The procedure is briefly described in the Supplementary Methods section.
2.7 Digital Western Blot
Digital Western Blot (DigiWest) was conducted as published before.18 The procedure is briefly described in the Supplementary Methods section and antibodies are listed in Table S2.
2.8 Apoptosis detection by flow cytometry
HCT116 were seeded in 12-well plates at a density of 100 000 cells per well. One day after seeding, cells were treated with the indicated drugs for 72 h, then harvested using trypsin-EDTA, washed with ice-cold PBS and stained with APC-Annexin V and 7-AAD in Annexin V Binding Buffer (all Biozol Diagnostica). Flow cytometric analysis was performed with a FACS Canto II (BD). For gating and data processing, the FlowJo V10.5 software was used. Exclusion of debris was achieved by gating in SSC-area (side scatter) vs FSC-area (forward scatter). Gates for APC-Annexin V and 7-AAD were defined by of samples with single staining, using the curly quadrant gating tool implemented in FlowJo V10.5.
2.9 Cell cycle phase quantification by flow cytometry
HCT116 were seeded in 12-well plates at a density of 100 000 cells per well. One day after seeding, cells were treated with the indicated drugs for 72 h, then were harvested using trypsin-EDTA, washed with PBS and fixed with ice-cold 70% ethanol. RNA was digested using RNAse A (Qiagen) before DNA was stained with propidium iodide (Biotium). Flow cytometric analysis was performed with a FACS Canto II (BD Biosciences), and gating and data processing were performed with FlowJo V10 software (BD Biosciences). Doublet discrimination was achieved by gating in FSC-width vs FSC-area. Automated cell cycle Gaussian curve fitting implemented in FlowJo V10.5 was used for cell cycle phase identification in area histograms of propidium iodide-stained cells. Localization of G1-phase peak was constrained manually to the propidium iodide area range between 20 000 and 100 000 to facilitate automated peak detection. Proportions of cells in the respective cell cycle phases are presented as percent of all cells fitted in G1, S and G2 populations by FlowJo V10.5. Images were arranged using Adobe Illustrator (Adobe Inc.).
2.10 Quantitative PCR
Total RNA was isolated with RNAeasy Mini Kit (Qiagen) and cDNA synthesis was performed using the Revert Aid H Minus First Strand cDNA Synthesis Kit (Thermo Fischer). Quantitative PCR was performed in 384-well plates on a LightCycler 480 (Roche, Basel, Switzerland) using the Universal probe library system (Roche). Primers are listed in Table S3.
2.11 Immunoblot
Whole cell lysates were separated on 4% to 12% NuPAGE Bis-TRIS gels (Thermo Fisher) and transferred to Immobilon PVDF membranes (Merck). For selected proteins, hand-cast SDS-polyacrylamide gels (7.5%, 12.5% or 15% v/v PAA) were used. Antibodies used are detailed in Table S4.
2.12 Compound treatment and measurement of viability of patient-derived cancer organoids
PDOs were cultured in droplets of BME V2 (Trevigen) and passaged every 5-7 days. The culture medium contained basal medium (advanced DMEM/F12 with 1% v/v penicillin/streptomycin, 1% v/v HEPES buffer and 1% v/v Glutamax (all from Life Technologies), 100 ng/mL recombinant noggin, 10 nM gastrin, 50 ng/mL EGF (all from Peprotech), ×1 B27 (Thermo Fisher), 1.25 mM n-acetyl-cysteine, 10 mM nicotinamide, 10 μM Y-27632 dihydrochloride (all from Merck), 500 nM A83-01 (Tocris), 10 nM prostaglandin E2 (Santa Cruz Biotechnology) and 100 mg/mL Primocin (Invivogen). The culture medium was exchanged every 2 to 3 days. Drug treatment was essentially done as described before.19 In brief, organoids were digested with TrypLE Express (Thermo Fisher), resuspended in BME V2 plus culture medium and seeded in 384-well plates precoated with BME V2. Cell numbers between different organoid lines were normalized by measuring ATP levels using CellTiter-Glo (Promega), and a number of cells per well equivalent to 5000 photon counts was used. Organoids were allowed to grow for 3 days before drug treatment for 96 h. Cell viability was determined using CellTiter-Glo and a Mithras LB940 Microplate Reader (Berthold Technologies). Two biological replicates were performed.
2.13 Imaging of patient-derived cancer organoids
PDOs were seeded at a density of 300 to 500 cells/μl growth-factor-reduced Matrigel (Corning) or Cultrex reduced growth factor Basement Membrane Extract type R1 (R&D Systems) in 6-well plates. Organoids were allowed to grow for 72 h before compound treatment. After treatment for 72 to 144 h, microscopic images of organoids were acquired using Primovert microscope (Zeiss) and Axiocam ERc 5 s camera (Zeiss) at ×2 magnification. The images were processed by the ZEN core software (Zeiss) and arranged using Adobe Photoshop Version 22.4.2 (Adobe Inc.). Representative sections of the images were used for illustration.
2.14 Statistical analysis
For all in vitro experiments, a two-sided Student t test was used for one- and two-sample-comparisons. For multiple sample comparisons ANOVA and Holm-Šídák's multiple comparisons test were performed. Differential DigiWest signal was tested using the moderated t test implemented in the “limma” R/Bioconductor package.20 Statistical analysis of immunohistochemistry stainings was done using SPSS version 24.0 (IBM). Pearson's exact Chi-Square test was used to evaluate the correlation between EHMT2 expression and clinicopathological characteristics. The Kaplan-Meier method was used to determine the median overall and tumor-specific survival with 95% confidence intervals. The log rank test was applied for testing differences between median survivals.
Quality of drug interactions was analyzed with the web application SynergyFinder 2.0.21 Normalized short-term viability data was uploaded to https://synergyfinder.fimm.fi/ as drug matrices. The provided baseline correction and four-parameter logistic regression curve-fitting algorithm were applied. Synergy scores of all reference models implemented in the SynergyFinder 2.0 web application (Bliss, highest single agent (HSA), Zero interaction potency (ZIP) and Loewe) were calculated. The interaction barometer terminology was used to describe the quality of drug interactions.22 The terminology aggregates the calculated scores to define the quality of interaction: strong synergy (positive Bliss and Loewe scores), weak synergy (if only Bliss or Loewe is positive), noninteraction or additivity (negative Bliss and negative Loewe, positive HSA score) and antagonism (negative HSA score).
3 RESULTS
3.1 Knockout of EHMT1/2 sensitizes CRC cells to treatment with HDAC inhibitors
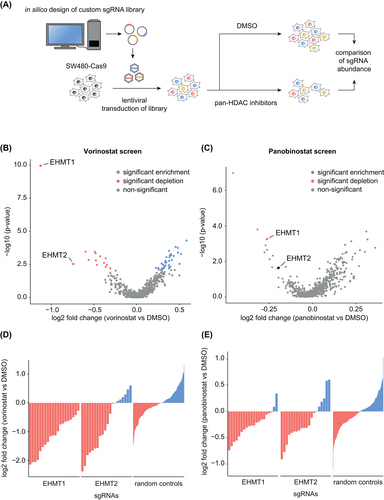
HDACi are ineffective as monotherapy for CRC, but preclinical studies indicate that combining HDACi with other epigenetically active drugs can enhance their antineoplastic effects.23, 24 To identify epigenetic targets for rational drug combinations, we performed a pooled CRISPR/Cas9 knockout screen in SW480 cells using a custom sgRNA library directed against genes that modulate the chromatin state. We selected genes based on their annotated function and used the CRISPR Library Designer software to identify effective sgRNA.14 The resulting “Chromatin Modulator” library contains sgRNAs targeting 614 genes with 20 sgRNAs/gene and 250 nontargeting controls (Tables S5-S7). Pools of knockout cells were generated and treated with either 3 μM of the HDACi vorinostat or DMSO for 16 days. Subsequently, the abundance of sgRNA cassettes in each pool was determined by next-generation sequencing (Figure 1A). Quality control of the screen shows a nearly complete coverage of the library (99.0% of all sgRNA represented) and a high correlation between replicates (Figure S1). Comparison of sgRNA abundances between pools revealed a significant depletion for sgRNAs targeting the histone methyl transferases EHMT1 and EHMT2 upon HDACi (Figure 1B and Table S8). EHMT1 and EHMT2 are lysine methyltransferases that act in a heterodimeric complex and catalyze the mono- and dimethylation of H3K9.25 We found that all sgRNAs against EHMT1 and 14 of 20 against EHMT2 were depleted, which is in contrast to the equal distribution of nontargeting sgRNAs (Figure 1D). These results were confirmed by another CRISPR/Cas9 screen using the HDACi panobinostat. In this screen, sgRNAs against EHMT1 were also significantly depleted while those against EHMT2 showed a similar, but weaker phenotype (Figure 1C,E and Table S9). Together, these results demonstrated that knockout of EHMT1 and EHMT2 sensitizes CRC cells towards treatment with HDACi. Since both genes act in a heterodimeric complex and are druggable targets, we decided to characterize this synthetic lethal interaction.
3.2 EHMT2 is differentially expressed in CRC and protein levels correlate with clinical outcome
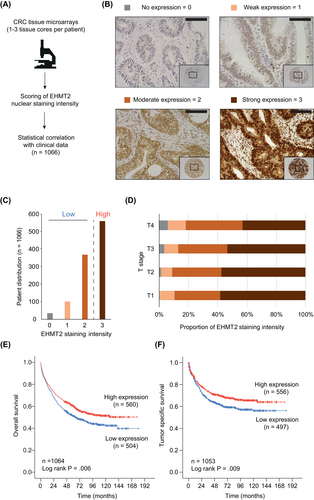
To determine EHMT1/2 protein expression in CRC and its correlations with tumor features and clinical outcomes, we performed immunohistochemistry on cancer tissue microarrays from 1066 CRC patients (Figure 2A). The clinical characteristics of the cohort are summarized in Table S10. For EHMT1, we tested several commercially available antibodies, but the quality of staining was insufficient for quantitative assessment of protein expression. In contrast, immunohistochemistry of EHMT2 was successfully established, and expression was determined by measuring nuclear staining intensities of tumor cells (Figure 2A,B). The majority of tumors (52.6%) showed a strong EHMT2 expression, while a minority (3.3%) had no detectable protein expression (Figure 2C). Comparison of EHMT2 levels with clinical characteristics demonstrated a significant correlation with the extent of tumor size/invasion, with low EHMT2 expression predominantly found in UICC (Union for International Cancer Control) stage T3/T4 cancers (Figure 2D, Table S10). Furthermore, patients with low intratumoral EHMT2 levels (score 0-2) showed a significantly poorer overall and tumor-specific survival (Figure 2E,F), particularly in UICC stage II cancers (Figure S2). In summary, these results demonstrate that EHMT2 is differentially expressed in CRC and that low EHMT2 protein expression is a prognostic marker for poor survival.
3.3 EHMT1/2 inhibitors synergize with HDACi to reduce tumor proliferation
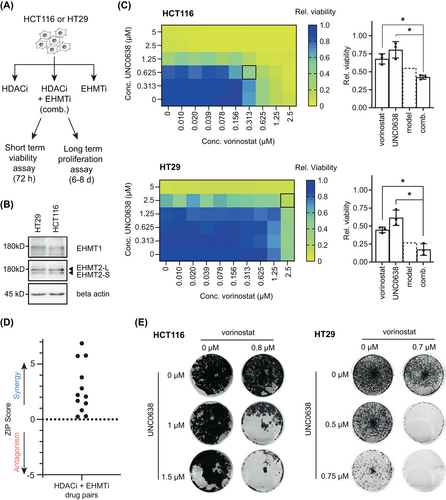
To further validate and characterize the interaction between HDACi and functional loss of EHMT1/2, we used four previously described, small molecule inhibitors of EHMT1/2 (BIX-01294,26 UNC0638,27 UNC0642,28 and A-36629). We tested the effect of combinations of EHMT1/2 inhibitors (EHMTi) with HDACi on tumor viability in two CRC cell lines with confirmed expression of EHMT1/2 (Figure 3A,B). In total, six different drug combinations were investigated, using four different EHMT1/2 and two different HDAC inhibitors (vorinostat, panobinostat). Compared to single agent treatment, the combination of UNC0638/vorinostat resulted in a stronger reduction of cell viability in both cell lines (Figure 3C). To analyze the quality of drug interactions, we calculated the ZIP synergy score30 and used the interaction barometer terminology,22 which is based on Bliss, Loewe and HSA synergy scores. Both the ZIP score and the interaction barometer showed a synergistic interaction between UNC0638 and vorinostat after short-term treatment (Figure 3D and Table S11). Similarly, the combination of UNC0638 and vorinostat synergistically reduced cell growth in long-term proliferation assays (Figure 3E). Other combinations of HDACi and EHMTi also showed a positive ZIP score, and the quality of interaction was predominantly synergistic (Table S11). Furthermore, in long-term proliferation assays, vorinostat was synergistic in combination with all EHMTi in HCT116, and synergistic with UNC0642 and BIX-01296 in HT29 cells (Figure S3), supporting a compound class-specific effect. Given the consistent synergistic interaction of vorinostat and UNC0638, we focused on this drug combination to characterize the underlying mechanisms, using drug concentrations that show a strong phenotype in long-term proliferation assays.
3.4 Combination treatment reduces cell proliferation by drug-specific modes of action
To uncover the biological mechanisms responsible for the synergistic antiproliferative effect, we used a bead-based, high-throughput Western blot assay (DigiWest). For this exploratory approach, we designed a custom panel containing 158 (phospho-specific) antibodies (Table S2) against proteins that are involved in 11 major cancer-associated cellular processes and pathways (Figure 4A). HT29 and HCT116 cells were treated with either DMSO or vorinostat/UNC0638 and protein samples were then analyzed by DigiWest. The results showed that many proteins were induced by the combination treatment, but only few depleted (Table S12). Amongst the most up-regulated proteins (log2 fold change >0.4), we identified candidates involved in apoptosis (pro-CASP8, cleaved CASP8), cell cycle regulation (p21, p27, Cyclin A), and autophagy (LC3B-II, ATG3, ATG7; Figure 4B), indicating that these processes were targeted.
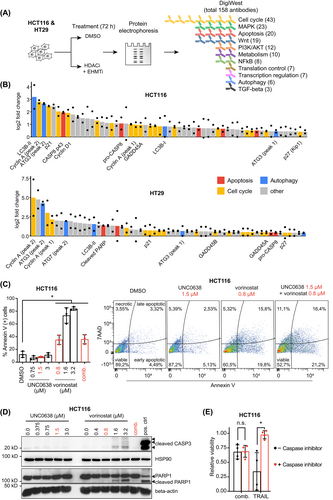
Next, we sought to discriminate the individual contribution of either vorinostat or UNC0638 to the dysregulation of the aforementioned processes. We focused on apoptosis induction first and found that treatment with UNC0638 neither increased levels of Annexin V-positive cells nor the cleavage of PARP1 or CASP3, the downstream caspase of CASP8. In contrast, vorinostat increased the number of apoptotic cells and cleavage of both proteins in a concentration-dependent manner (Figure 4C,D). However, when both compounds were combined at concentrations that synergistically reduced cell proliferation, only a minor increase of Annexin V-positive cells and no cleavage of CASP3 or PARP1 was observed (Figure 4C,D). This observation was consistent for HCT116 and HT29 (Figure S4A). To further determine if caspase-dependent apoptosis contributes to the viability effect of the combination treatment, we used the pan-caspase inhibitor Z-VAD(OMe)-FMK. While cell death caused by the apoptosis-inducing ligand TRAIL could be rescued by co-incubation with Z-VAD(OMe)-FMK, no such effect was observed when cells were treated with vorinostat/UNC0638 (Figures 4E and S4B). Taken together, these results indicated that the synergistic antiproliferative effects of low-dose vorinostat/UNC0638 combination do not rely on caspase-dependent apoptosis.
We then investigated effects on cell cycle regulation. As shown in Figure 5A, combined vorinostat/UNC0638 significantly reduced the proportion of HCT116 cells in the G1 phase and caused a cell cycle shift towards the G2 and S phase, while the effect of single agents was less pronounced. Results from the DigiWest assay demonstrated increased expression of the cell cycle regulators Cyclin A, Cyclin D1, p21 and p27 upon combination treatment (Figure 4B and Table S12). Induction of these proteins could be confirmed by immunoblot and was caused by vorinostat in HCT116 (Figure 5B). In HT29, vorinostat induced the expression of Cyclin D1 and A, but not p21 (Figure S5A). These findings demonstrated that the drug combination modulates the cell cycle and that this effect is mainly driven by vorinostat.
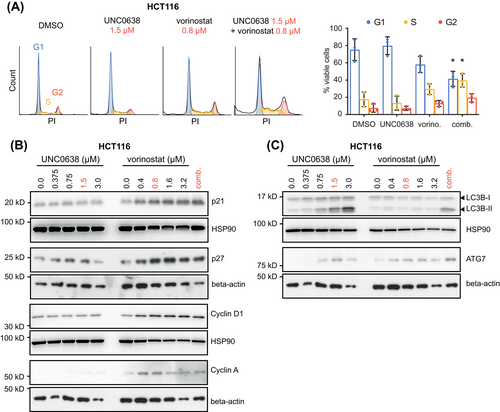
As the DigiWest assay revealed an up-regulation of autophagy markers, we assessed levels of LC3B-II, ATG3 and ATG7 by immunoblot. Upregulation of LC3B-II and ATG7 by the combination treatment was confirmed in HCT116 (Figure 5C) and HT29 (Figure S5B). While LC3B-II was only increased by UNC0638, expression of ATG7 was induced by vorinostat as well. In contrast, ATG3 levels were not consistently altered. Next, we investigated if changes in transcript levels of genes involved in autophagy are responsible for the induction of LC3B-II and ATG7. However, we only observed a significant downregulation of ATG12 and ATG5 levels upon combination treatment in HCT116 (Figure S6). Since induction of autophagy not only functions as a mechanism to limit cell proliferation, but also to rescue tumors from cell death,31 we sought to further investigate its role during UNC0638 treatment. To this end, we performed short-term viability assays combining UNC0638 with known inhibitors of late autophagy (chloroquine, Lys05), and observed a synergistic reduction of cell viability by these drug combinations (Figure S7A,B and Table S11). Together, these data indicated that autophagy induction is elicited primarily by EHMTi and that the autophagic flux is required for the survival of CRC cells, as blocking of late autophagy enhanced UNC0638-induced cell death.
A fundamental effect of EHMTi and HDACi is the alteration of specific histone marks.25, 32 Since we observed synergistic antiproliferative effects when vorinostat and UNC0638 were combined at low doses, we asked if histone modifications are already affected at these concentrations. To address this question, we analyzed global H3K9 mono- and dimethylation (H3K9me1 and 2) and acetylation (H3K9ac). In both HCT116 and HT29 cells, treatment with either UNC0638 or vorinostat alone resulted in a modest reduction of H3K9me2 (Figure S8A,B). A decrease of H3K9me1 levels was not consistently observed. In contrast, H3K9ac was induced by both inhibitors. Interestingly, the drug combination caused an even stronger induction of H3K9ac in HCT116. Together, these results indicate that low concentrations of vorinostat and UNC0638 are sufficient to affect histone marks and that the combination treatment can result in an enhanced induction of H3K9ac.
In summary, we demonstrated that combining EHMTi and HDACi reduces CRC cell viability by drug-specific modulation of cell cycle progression and autophagy. On an epigenetic level, both inhibitors could alter specific histone modifications.
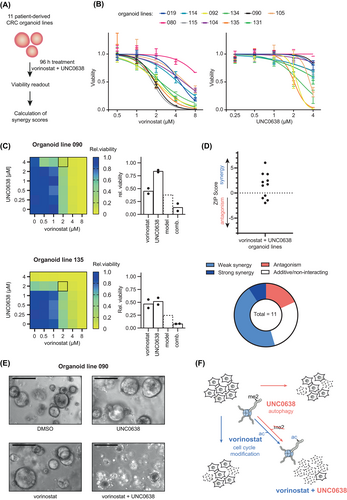
3.5 HDAC and EHMT1/2 inhibition synergistically reduce viability of patient-derived CRC organoids
Patient-derived cancer organoids closely reflect many characteristics of primary cancers, including their response to drugs.33 We systematically established PDO lines from CRC tissues for in vitro testing of compounds.19 To determine the response of PDOs to the combination of UNC0638 and vorinostat, we treated a panel of 11 lines representing diverse tumor stages.19 (Figure 6A). We found that the individual response of PDOs to single agent treatment was very heterogenous (Figure 6B). We then assessed the quality of drug interaction using the ZIP score, which showed that the drug combination was synergistic in the majority of PDO lines (Figure 6C and Table S11). Interestingly, synergistic effects were observed in PDO lines that were either insensitive (line 090) or highly sensitive (line 135) to UNC0638 (Figure 6D), and could be confirmed by microscopy-based imaging (Figure 6E). The synergistic antiproliferative effect in PDOs was also observed for the combination of vorinostat with two other EHMTi inhibitors, A366 and UNC0642 and (Figure S9A,B). Finally, we sought to investigate if the cellular processes altered by vorinostat/UNC0638 in cell lines were similarly modified in PDOs. To this end, we selected the PDO line 090 in which the drug combination was highly synergistic (Figure 6E). In this model, cycle markers (p27, p21) were induced by single vorinostat and UNC0638 treatment, but not by the drug combination (Figure S9C). In contrast, UNC0638 caused a clear induction of LC3B-II, which was even enhanced by the combination treatment (Figure S9D). We also observed that vorinostat increased H3K9ac while UNC0638 reduced H3K9me2 levels (Figure S9E). In summary, we showed that combining EHMT1/2 and HDAC inhibitors synergistically reduced proliferation of CRC PDOs, which was associated with similar cellular and epigenetic changes as observed in cell lines.
4 DISCUSSION
Epigenetic drugs, including HDACi, have been tested as monotherapy in early clinical trials for CRC, with only minor clinical efficacy.34 However, several preclinical and clinical studies suggest that the therapeutic potential of epigenetic drugs can be enhanced through combination with other anticancer drugs.9, 35 These findings advocate the search for effective combination partners for epigenetic drugs by exploiting the concept of synthetic lethality. Here, we applied a functional genomics approach using pooled CRISPR/Cas9 screens and identified that depletion of EHMT1 and EHMT2 renders CRC cell lines sensitive to HDACi, which was confirmed using small molecules inhibitors of EHMT1/2. By analyzing protein levels in a large array of CRC tissues, we showed that EHMT2 is differentially expressed in CRC. Mechanistically, we applied a proteomics approach and found that autophagy and cell cycle modulation were the main cellular processes induced by the combination therapy. Finally, we confirmed the synergistic effect of the drug combination in a panel of PDOs, suggesting that it is a promising treatment strategy for CRC.
EHMT1 and EHMT2 are histone methyltransferases that cooperate as a heterodimeric complex and are responsible for the methylation of H3K9, but also of other histone residues and nonhistone targets.25, 36 The important role of EHMT1/2 for tumor biology is highlighted by their abundant expression in many cancers.37, 38 In CRC, protein levels of EHMT2 are increased compared to nonneoplastic colon tissue,39 and copy number gains of EHMT2 are detected in 21% of tumors.40 The impact of EHMT2 expression on clinical outcome is highly dependent on the tumor entity. While high EHMT2 expression is associated with decreased survival in gastric cancer,37 an opposite correlation was observed in lung adenocarcinoma.38 A previous study found a significant correlation of high EHMT2 protein expression with advanced tumor stage in a small cohort of CRC patients.39 In contrast, our results demonstrate that EHMT2 expression is frequently reduced in T3/4 stage CRC, which is associated with a poor survival. Due to the abundant expression in many cancers, EHMT1/2 has been explored as a pharmacological target.41 In CRC, EHMT2 was found to maintain an embryonic stem-like state and depletion of EHMT2 reduces the tumor initiating capacity of cancer cells.42 Our results show that pharmacological inhibition of EHMT1/2 effectively reduces proliferation of CRC PDOs, supporting that EHMT1/2 is a potential target in CRC. However, it is not known how the cancer-intrinsic level of EHMT2, which we showed to be highly variable in CRC, affects the sensitivity of tumors to either EHMT1/2 and HDAC inhibition.
Mechanistically, we found that combined EHMTi and HDACi treatment modulates several biological processes that reduce cell proliferation. Induction of apoptosis is a well-known mechanism of HDACi and was recently also described upon EHMT1 knockdown.43 We also observed this effect at high concentrations of vorinostat, but not of EHMTi. However, low concentrations of HDACi were used in our combination treatment and under these conditions, caspase-dependent apoptosis is not required for the antiproliferative effect. Therefore, other modes of action are responsible for the antiproliferative effect of the drug combination. In this respect, we observed that HDACi causes a cell cycle shift towards G2 and S phase and an induction of important cell cycle regulators. These findings align with previous studies showing that cell cycle arrest in the S or G2/M phase is a main effect of HDACi.44, 45 In contrast, induction of autophagy markers is mainly caused by EHMTi. In fact, activation of autophagic cell death is a known mode of action of EHMTi in cancers.46 Our data suggests that induction of autophagy could also be a protective mechanism to overcome the antiproliferative effect of EHMTi, as parallel inhibition of late autophagy enhanced the cytotoxicity of EHMTi. Such a protective autophagic response to EHMTi was also observed in leukemia stem cells.47 Nonetheless, the exact mechanisms by which HDACi and EHMTi act synergistically can be more complex. Our study indicates that both drugs use independent mechanisms, that is, autophagy induction and cell cycle modulation, to restrict cell growth. However, given their pleiotropic effects, it is likely that they also share common targets, which we did not identify. Previously, it was shown that depletion or pharmacological inhibition of HDACs can inhibit late autophagy.48 Therefore, it is possible that the synergistic interaction between HDACi and EHMTi is partly due to a modulation of autophagy. Furthermore, H3K9 deacetylation and subsequent H3K9 methylation are required for proper cell cycle progression,49 and it was recently shown that knockdown of EHMT1 induces p21 expression and cell cycle arrest in lung cancer cells by decreasing H3K9me2 in the promotor region of p21.43 Thus, an epigenetic interdependence could explain a cooperative effect on cell cycle arrest. In fact, we observed that low concentrations of UNC0683 and vorinostat, which were sufficient to synergistically reduce cancer cell proliferation, also altered H3K9me2 and H3K9ac levels. The induction of H3K9ac was even further increased by the combination treatment in HCT116, suggesting synergistic epigenetic effects.
One main limitation of our proposed drug combination is the lack of data on in vivo activity of EHMT1/2 inhibitors. Of the pharmacological EHMT1/2 inhibitors used in our study, only UNC0642 has been recently shown to be suitable for in vivo studies.28 Whether UNC0642 also exhibits biological effects on CRC cells in murine models needs to be determined. Furthermore, protein expression of EHMT1 in CRC tissues could not be assessed in this study, due to the lack of functional antibodies. Hence, we do not know how the expression of EHMT1 differs from EHMT2 and affects the prognosis. However, since both proteins act as a heterodimer and are targeted by EHMT1/2 inhibitors, we expect that the synergistic effect will be observable despite differences in EHMT1 levels. Another open question is why PDOs respond differentially to combination treatment. As EHMT2 is uniformly expressed at high levels in our CRC organoid panel (data not shown), other tumor-intrinsic factors must affect the response to the inhibitors. To determine these factors, drug screens with large panels of PDOs must be combined with comprehensive multi-omics characterizations to enable specific correlations. Lastly, we noted that high micromolar concentrations of EHMT1/2 inhibitors are needed to reduce viability and act synergistically with vorinostat in our CRC models, while changes of histone methylation were reported to occur at much lower concentrations in other cell models.27 This discrepancy could be explained by tumor-specific differences in the on-target efficiency of the EHMT1/2 inhibitors, as we observed that H3K9me1 and H3K9me2 were only partly reduced in spite of high concentrations of the drug (Figure S8). Nevertheless, we are unable to rule out that our observations might be affected by potential off-target effects or caused by inhibition of nonhistone targets of EHMT1/2.
In summary, we used a CRISPR/Cas9-based functional genomics approach to demonstrate that combining HDAC and EHMT1/2 inhibitors can synergistically reduce proliferation of CRC cell and PDOs lines by eliciting specific cellular and epigenetic effects (see Figure 6F). Based on our findings, we propose that EHMT1/2 inhibitors with improved pharmacokinetics should be developed and tested in preclinical tumor models in combination with HDACi.
AUTHOR CONTRIBUTIONS
Conceptualization: Tianzuo Zhan and Michael Boutros; Investigation and data curation: Leonhard Valentin Bamberg, Tianzuo Zhan, Anna Maxi Wandmacher, Ambika Singh, Niklas Rindtorff, Johannes Betge, Julia Josten, Isabel Hinsenkamp, Gerrit Erdmann, Christoph Röcken, Johannes Werner, Olga Valerievna Skabkina. Resources: Christoph Röcken, Matthias P Ebert, Michael Boutros; Visualization: Leonhard Valentin Bamberg, Florian Heigwer, Tianzuo Zhan; Software and formal analysis: Florian Heigwer; Writing—original draft: Tianzuo Zhan, Leonhard Valentin Bamberg and Michael Boutros; Funding acquisition and supervision: Matthias P. Ebert, Elke Burgermeister, Tianzuo Zhan and Michael Boutros. The work reported in the paper has been performed by the authors, unless clearly specified in the text.
ACKNOWLEDGEMENTS
We are grateful to D. Kranz, L. Henkel and G. Ambrosi for helpful comments on the manuscript and valuable discussion, S. Krüger for performing immunohistochemical staining, K. Rippe for support with histone immunoblots, H. Behrens and S. Hetjens for helping with statistical analysis and T. Itzel for data processing. Open Access funding enabled and organized by Projekt DEAL.
FUNDING INFORMATION
Elke Burgermeister, Tianzuo Zhan and Isabel Hinsenkamp were supported by the SEED program of the Medical Faculty Mannheim, Heidelberg University. Leonhard Valentin Bamberg was supported by the MD scholarship program of the Medical Faculty Mannheim, Heidelberg University, and the German Academic Scholarship Foundation (Studienstiftung). Tianzuo Zhan was supported by the Clinician Scientist program “Interfaces and Interventions in Chronic Complex Conditions” funded by the German Research Foundation (EB 187/8-1). Matthias P. Ebert was supported by grants from the State of Baden-Württemberg for the “Center of Geriatric Oncology (ZOBEL)—Perspektivförderung” and “Biology of Frailty—Sonderlinie Medizin.” Johannes Werner and Julia Josten were supported by a Herbert-Steinbeisser MD fellowship of SFB1324. The groups of Michael Boutros, Johannes Betge and Matthias P. Ebert were supported by the Hector Foundation II.
CONFLICT OF INTEREST
Gerrit Erdmann is employed by the NMI TT GmbH which offers the DigiWest technology as a service. All other authors declare no conflict of interests.
ETHICS STATEMENT
Generation of and experiments with PDOs were approved by the Medical Ethics Committee II of the Medical Faculty Mannheim, Heidelberg University (2016-607N-MA). Immunohistochemical analysis of tumor microarrays was approved by the Medical Ethics Committee of the University of Kiel (AZ 140/99).50 All patients gave written informed consent.
Open Research
DATA AVAILABILITY STATEMENT
Raw sequencing reads of the CRISPR screens are available from the European Nucleotide Archive under PRJEB39827. Documented computer codes to reproduce all figures and raw sgRNA read counts are available as an R vignette from GitHub at https://github.com/boutroslab/Supp_Bamberg_2021. Further details and other data that support the findings of this study are available from the corresponding author upon request.


