The functional interlink between AR and MMP9/VEGF signaling axis is mediated through PIP5K1α/pAKT in prostate cancer
Abstract
Currently, no effective targeted therapeutics exists for treatment of metastatic prostate cancer (PCa). Given that matrix metalloproteinases 9 (MMP9) and its associated vascular endothelial growth factor (VEGF) are critical for tumor vascularization and invasion under castration-resistant condition, it is therefore of great importance to define the functional association and interplay between androgen receptor (AR) and MMP9 and their associated key survival and invasion pathways in PCa cells. Here, we found that there was a significant correlation between MMP9 and AR protein expression in primary and metastatic PCa tissues, and a trend that high level of MMP9 expression was associated with poor prognosis. We demonstrated that constitutive activation of AR increased expression of MMP9 and VEGF/VEGF receptors. We further showed that AR exerts its effect on MMP9/VEGF signaling axis through PIP5K1α/AKT. We showed that MMP9 physically interacted with PIP5K1α via formation of protein–protein complexes. Furthermore, elevated expression of MMP9 enhanced ability of AR to activate its target gene cyclin A1. The elevated sequential activation of AR/PIP5K1α/AKT/MMP9/VEGF signaling axis contributed to increased invasiveness and growth of metastatic tumors. Conversely, treatment with PIP5K1α inhibitor significantly suppressed invasiveness of PCa cells expressing constitutively activated AR, this was coincident with its inhibitory effect of this inhibitor on AR/MMP9/VEGF pathways. Our results suggest that AR and MMP9-associated network proteins may be effectively targeted by blocking PIP5K1α/AKT pathways using PIP5K1α inhibitor in metastatic PCa.
Abstract
What's new?
The androgen receptor (AR) is a key factor in prostate cancer (PCa) progression and metastasis. Given that matrix metalloproteinase 9 (MMP9) and the vascular endothelial growth factor (VEGF) pathway are critical for tumor vascularization and invasion under castration-resistant condition, it may be of importance to define the functional interplay between AR and MMP9 and their associated key survival and invasion pathways in PCa cells. This study identifies novel cooperative mechanisms involving AR, the MMP9/ VEGF signaling axis and PIP5K1α/AKT pathways driving tumor invasion. The findings provide new information to guide the development of targeted therapy for invasive castration-resistant prostate cancer.
Abbreviations
-
- AR
-
- androgen receptor
-
- DHT
-
- dihydrotestosterone
-
- DSF
-
- disease-free survival
-
- MMP9
-
- matrix metalloproteinase 9
-
- PCa
-
- prostate cancer
-
- PIP5K1α
-
- phosphatidylinositol 4-phosphate 5-kinase type-1 alpha
-
- VEGF
-
- vascular endothelial growth factor
Introduction
During the development of advanced prostate cancer (PCa), in particular, castration-resistant PCa (CRPC), elevated level of androgen receptor (AR) is necessary and sufficient to confer androgen-sensitive cells to invasive and castration-resistant phenotypes.1-4AR gene amplification, protein stabilization and duplication of AR gene enhancer are some of the mechanisms underlying AR overexpression.2, 3AR enhancer duplication was recently reported to be associated with inactivated tumor suppressor PTEN, a negative regulator of PI3K/AKT pathways.3, 4 Altered expression of coactivators of AR is another mechanism that affects AR signaling by inducing abnormal transactivation of their target genes to enable increased survival and invasiveness of PCa.2 Thus, AR-dependent mechanisms, including constitutively active or inappropriately restored of AR, or indirect AR activation by growth factors and cytokines in the castration or androgen-depleted environment, highlight a common feature of CRPC which is addiction to AR-associated signaling.5
Phosphatidylinositol 4-phosphate 5-kinase type-1 alpha (PIP5K1α) is a dominant lipid kinase that is responsible for producing PI(4,5)P2, also termed PIP2.6, 7 PIP2 is a lipid substrate used by phosphatidylinositol 3-kinase (PI3K) to produce phosphatidylinositol 3,4,5-trisphosphate (PIP3) for the activation of AKT family of serine/threonine kinases.6-8 PIP5K1α is thereby a key lipid kinase that acts on upstream of PI3K/AKT pathways. Alterations in AKT pathways are the most frequent events observed in various types of metastatic cancer.9 Only until recent years, owing to the discovery of new cancer biomarkers, an important role of PIP5K1α in cancer metastasis has been identified.10, 11 We, for the first time, showed that altered PIP5K1α expression significantly correlated with alterations in PI3K/AKT/PTEN pathways and was associated with poor prognosis in PCa patients.10 Amplification of the gene encoding for PIP5K1α is a frequent event in breast cancer.11 Our recent studies further provide evidence suggesting that PIP5K1α is a key player in the development of triple-negative breast cancer.12 Overexpression of PIP5K1α promoted tumor growth and invasiveness by increasing activity of PI3K/AKT in mouse xenograft models.12, 13
It is well-established that matrix metalloproteinase 9 (MMP9) is involved in degradation of ECM and vascular remodeling during tumor cell invasion.14 It has been shown that MMP9 expression is regulated by epidermal growth factor receptor (EGFR) via PI3K/AKT pathways in cancers of the lung, ovary and breast.15-18 EGFR is also up-regulated in MMP9 overexpressing PCa cells, which suggests that MMP9 is also associated with EGFR pathways in PCa.19 It has been shown that MMP9 regulates vascular endothelial growth factor (VEGF) signaling axis by cleaving membrane-bound VEGF, leading to the increased bioavailability for its receptor VEGFR2.20 Thus, MMP9 may amplify local angiogenesis due to its ability to elevating the level of VEGF in tumors.21 MMPs have considered as intriguing targets for therapeutic intervention for treatment of metastatic PCa. Various types of MMP inhibitors have been tested in several clinical trials, but failed to increase patient survivals, probably due to the lack of specificity and selectivity of these inhibitors.22 Given that the current understanding of MMP9 in cancer progression and metastasis mainly comes from its role in tumor-associated microenvironment,22 there is an unmet need to define the pathways that are associated with MMP9 and the role of intracellular MMP9 in PCa cells.
There are unmet needs for novel therapeutic agents that can effectively target and inhibit AR signaling pathways in metastatic PCa. Several novel approaches to inhibit interactions between coregulators and AR by using peptidomimetics have been tested in PCa cell lines and xenograft mice and showed promising effects.23 We have discovered a selective PIP5K1α inhibitor, ISA-2011B, which blocks PI3K and its downstream AKT phosphorylation at Serine 473 (pAKT S473) pathway through inhibition of PIP5K1α in PCa cells.12, 13 Treatment with ISA-2011B suppressed growth and invasion of PCa in xenograft mice.10, 12, 13 Interestingly, ISA-2011B treatment abolished AR expression by inducing degradation of AR, as PIP5K1α mediates AR stabilization in PCa cells.13
In our study, we investigated the clinical importance of MMP9 and its association with AR in primary and metastatic tissues from PCa patients. We further unrevealed molecular mechanisms underlying the interconnected pathways of AR, MMP9/VEGF and PIP5K1α/AKT in PCa cell lines and in tumor xenograft mouse model. Our results suggest that AR and MMP9-associated network proteins may be effectively targeted by blocking PIP5K1α/AKT pathways in CRPC and metastatic PCa.
Materials and Methods
Tissue specimens, tissue microarrays and mRNA expression data
Tissue microarrays (TMAs) containing primary PCa (n = 17) and metastatic PCa lesions in distant organs such as lymph node, lung, liver and bone (n = 43) from 14 PCa patients, and benign prostatic hyperplasia (BPH; n = 48) vs. matched PCa tissues (n = 48) from 48 patients were constructed at Department of Clinical Pathology and Cytology, Skåne University Hospital, Malmö.10 For mRNA expression and copy number alteration (CNA) data for MMP9, the disease-free survival (DFS) data were extracted from the open-access cBioPortal databases. MSKCC Prostate Oncogenenome Project dataset (for primary tumors, n = 181; for metastatic tumors n = 37) as described.10, 13 The follow-up time from diagnosis to disease recurrence known as biochemical recurrence (BCR) ranged from 1 to 60 months was used for analysis of DFS. The study was approved by the Ethics Committee, Region Skåne, and Ethics Committee, Umeå Region and the Helsinki Declaration of Human Rights was strictly observed.
Immunohistochemical analysis
Immunohistochemistry on tumor tissue microarrays (TMA) was performed as previously described.13 The staining of the tumor tissue was performed by using a semiautomatic staining machine (Ventana Inc, Tuscon, AZ). The specimens from the tumor tissues were evaluated and scored by four different scientists, including a pathologist. The stained slides were scored based on the staining intensity, as 0 (negative), 1 (weakly positive), 2 (moderately positive), 3 (strongly or very strongly positive) by using an arbitrary semiquantitative scale.
Cell culture and treatments
VCaP (RRID:CVCL_2235), PC-3 (RRID:CVCL_0035) and U-937 cells (RRID:CVCL_0007) were purchased from American Type Culture Collection (ATCC, Manassas, VA). All human cell lines have been authenticated using STR profiling within the last 3 years. All experiments were performed with mycoplasma-free cells. For treatment with dihydrotestosterone (DHT), medium containing 10% charcoal-stripped serum and 5 nM DHT or vehicle control 0.1% dimethyl sulfoxide (DMSO, Sigma-Aldrich, St. Louis, MO) were used. PIP5K1 alpha inhibitor: ISA-2011B, a diketopiperazine fused C-1 indol-3-yl substituted 1,2,3,4-tetrahydroisoquinoline derivative, ISA-2011B10 at a final concentration of 50 μM in 1% DMSO was used for treatment for 48 hr.
Immunoblot, immunoprecipitation analysis and subcellular fractionation
Subcellular fractionation, immunoblot and immunoprecipitation analysis were performed as described previously.10 Briefly, protein from different subcellular fractions (cytoplasmic and nuclear) was isolated by using NE-PER™ Nuclear and Cytoplasmic Extraction Reagents according to manufacturer's protocol (Thermo Fischer Scientific, Sweden). Signals were visualized and documented with an AlphaImager CCD system. Densitometric quantification of immunoblots was performed by the ImageJ Image Analysis Software (NIH, Baltimore, MD) and represented as fold change relative to control and was normalized relative to actin or GAPDH bands. For immunoprecipitation analysis, antibody against PIP5K1α was used to pull down the immune-complexes, and antibody to IgG (Thermo Fischer Scientific, Sweden) was used as a negative control.
Immunofluorescence analysis
PCa cells were seeded on glass coverslips and were subsequently treated with the different agents. Cells were fixed with 4% paraformaldehyde in PBS. For blocking background staining from nonspecific interactions, Image-iT™ FX signal enhancer (Molecular Probes, Inc, Eugene, OR) was used. The secondary antibodies including rabbit antidonkey conjugated to Rhodamine or Alexa Fluor 555 (Chemicon/Millipore International Inc, Temecula, CA) or antigoat conjugated to FITC antibodies and goat antirabbit Alexa Fluor 488 (Invitrogen, Stockholm, Sweden) were used. 4′,6-Diamidino-2-phenylindole counterstain (SERVA Electrophoresis GmbH, Heidelberg, Germany) was used to visualize cell nuclei. The images were viewed and taken under an Olympus AX70 fluorescent microscope or a Nikon Eclipse 90i Confocal microscope (Nikon DS-U1) and software ACT2U (ACT2U version. 1.5, Stockholm, Sweden) was used.
Plasmids and transfection
For transient transfection experiment, we used pCMV empty vector and pCVM vector containing full-length AR. For induction of MMP9 overexpression into the PCa cells, PLX-304 empty vector and PLX-304-MMP9 vector were used. TransIT-2020 kit (Mirus Bio, MIR5410, Madison, WI) was used by following the manufacturer's protocol.
Luciferase assays
PC-3 cells were transiently transfected with different vectors along with the reporter vector containing luciferase gene (Luc) or full-length cyclin A1 promoter in Luc reporter vector (cyclin A1-Luc) as indicated. The dual luciferase reporter assay kit was used according to the manufactures instructions (Promega, Madison, WI). The Firefly Luciferase and Renilla Luciferase activity were determined by using an Infinite® M200 multimode microplate reader (Tecan Sunrise™), equipped with dual injector.
Migration assay
Cell migration assays were performed using Transparent PET Membrane chambers (Corning, Germany). A total of 0.5–2 × 10⁵ cells in RPMI 1640 phenol red-free and serum-free medium were seeded in the upper chamber, and 50% FBS as a chemoattractant was loaded in the lower chamber to allow the migration to proceed for 18 hr. For examination of the migratory ability of the tumor spheroids, 30 spheroids (each spheroid consists of approximately 100 cells) from each group were subjected to the migration assay. The migrated cells were counted and microphotographs were taken under Nikon Eclipse microscope.
RNA purification and quantitative RT-PCR
mRNA was purified from VCaP cells after treatment. The following primers were used in PCR: PIP5K1α forward: 5′-AGA TTC CCT GCG TTC ACC TT-3′, reverse: 5′-TGA GGC TTT GCG CTT AAT GG-3′. GAPDH forward: 5′-AAC AGC GAC ACC CAC TCC TC-3′, reverse: 5′-GGA GGG GAG ATT CAG TGT GGT-3′. PCR was performed under the following cycling condition: DNA denaturation for 30 sec at 98°C, 18 cycles of 30 sec annealing at 65.5°C and 30 sec extension at 72°C, and final 10 min extension at 70°C. Semiquantification was performed using ImageJ Image Analysis Software (NIH, Bethesda, MD).
Tumor-spheroid formation assays
About 5 × 10³ single cell suspension were cultured in suspension in modified spheroid medium containing DMEM F-12, 3.151 g/l Glucose, l-Glutamine (Lonza, Morristown, NJ), 2x B27 (Thermo Fisher Scientific, Waltham, MA), 20 ng/ml EGF (Sigma-Aldrich) and 20 ng/ml FGFβ (Sigma-Aldrich). For tumor-spheroid formation assays from the PCa cells stimulated with U-937 cells, monocultures or PCa cells after stimulation with U-937 cells were made in single cell suspensions, 1 × 10⁵ PCa cells or 2 × 10⁵ U937 cells were subjected to the tumor-spheroid formation assays in modified spheroid medium for 10–14 days and then counted
Mouse model of PCa derived from tumor spheroids stimulated by myeloid cells
The animal studies were approved by the Swedish Regional Ethical Animal Welfare Committee. The animal welfare and guidelines were strictly followed. Athymic NMRI nude male mice (Charles River Biotechnology, Wilmington, MA) aged 6 weeks and weighing 25–29 g were used. Equal amount of single-cell suspension from 1,000 tumor-spheroids derived from pLX304-MMP9 or control transfected-VCaP cells prestimulated with U-937 cells was injected subcutaneously into mice (n = 5 mice/group). To assess the luciferase live-imaging, luciferin was injected into each mice 5–10 min before imaging. The in vivo imaging device (IVIS imaging system, PerkinElmer, MA) was used.
Statistical analysis
For statistical analysis, Student's t-test and Spearman rank correlation tests were performed by using the Statistical software, Social Sciences software (SPSS, version 21, Chicago, IL). All outcome variables are representative of at least three independent experiments. All statistical tests performed were two-sided and p-value < 0.05 considered as statistical significant.
Results
Expression of correlation between AR and MMP9 in bone metastasis in patient tissue
MMP9 is known to promote cancer invasion and metastasis.22 However, it remained unclear whether MMP9 expression might be correlated with AR expression and patient outcome in primary and metastatic tissues from PCa patients. We performed immunohistochemical analysis to examine expression AR and MMP9 on TMAs previously constructed to contain primary tumor tissues and metastatic lesions from PCa patient cohorts.24 Expression of AR was detected in both cytoplasmic and nuclear compartments in cancer cells (Fig. 1a). Expression of AR was significantly higher in metastatic lesions including lymph node, lung, liver and bone/bone marrow compared to that of the primary PCa tissues (p < 0.001; Fig. 1b). MMP9 expression was observed predominantly in cancer cells from the primary and metastatic tissues (Fig. 1c). MMP9 expression was higher in primary PCa tissues which expressed high level of AR than those expressed low level of AR, and this was statistically significant (p < 0.001; Fig. 1d). Spearman-rank correlation test revealed that there was a significantly positive correlation between AR and MMP9 protein expression (r2 = 0.405, p < 0.001) in PCa tissues from this patient cohort.
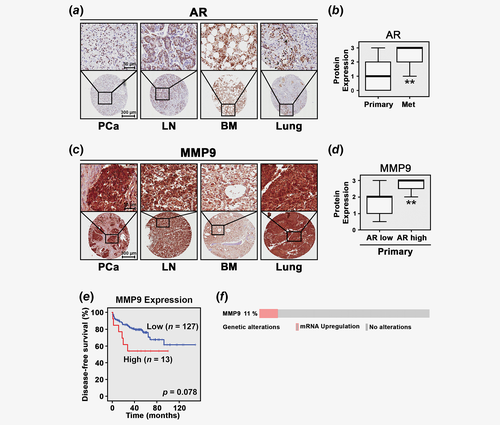
We next examined MMP9 mRNA expression in primary tumor tissues (n = 150) from a patient cohort by using MSKCC Prostate Oncogenome Project publicly available at cBioPortal Database.25 MMP9 mRNA expression was not statistically significantly higher in metastatic tissues compared to the primary PCa tissues. Furthermore, there was no statistically significant correlation between MMP9 and AR at mRNA levels. Next, we performed Kaplan–Meier survival analysis. We observed that there was a trend that patients with higher level of MMP9 mRNA expression (n = 127) suffered poorer DFS as compared to those with lower level (n = 13), but this difference was not statistically significant (p = 0.078; Fig. 1e). Further, alterations, in particular, amplification in MMP9 gene were detected in 11% of PCa cases (n = 150) from the MSKCC Prostate cBioPortal Database (Fig. 1f). These data suggested that patients with higher level of MMP9 mRNA expression may suffer cancer metastasis and poor outcome.
The link among AR, PIP5K1α and MMP9 pathways in VCaP cells
Next, we wanted to investigate whether elevated levels of AR and MMP9 expression in tumor tissues from PCa patients might be related to their roles in promoting PCa invasion and metastasis. To this end, we firstly examined the effect of AR overexpression on MMP9 protein level in VCaP cells, a castration-resistant PCa cell line. Overexpression of AR was induced into VCaP cells by transfecting the cells with pCMV-AR or pCMV control vectors, followed by the treatment of cells with DHT at 5 nM to further stimulate activation of AR. AR expression was significantly increased in VCaP cells transfected with pCMV-AR compared to that of the control (p < 0.001; Fig. 2a). Significantly, DHT also increased expression of endogenous AR and transfected AR in VCaP cells compared to that of the controls (p < 0.001; Fig. 2a), suggesting that ligand binding of AR-enhanced its protein expression. Furthermore, AR expression was predominantly nuclear in VCaP cells transfected with control pCMV vector and was markedly enhanced in AR-transfected or DHT-stimulated cells as determined by immunofluorescence analysis (Fig. 2b). We next examined the effect of induced AR overexpression and DHT stimulation on MMP9 expression. Interestingly, overexpression of AR resulted in a significant increase in MMP9 expression by approximately 24% of the control (mean values of MMP9 expression in pCMV control cells and pCMV-AR cells were 0.62 and 0.72, difference = 0.1, 95% CI = 0.70–0.74, p = 0.008; Fig. 2c). DHT treatment also significantly enhanced MMP9 expression (mean MMP9 in pCMV control cells and DHT-treated pCMV cells were 0.62 and 0.71, difference = 0.09, 95% CI = 0.69–0.73, p = 0.03; Fig. 2c), suggesting that AR affects MMP9 expression in VCaP cells. We have previously shown that lipid kinase PIP5K1α acts as cofactor of AR by forming protein–protein complexes with AR in PCa cells,10, 13 and PIP5K1α/pAKT is also functionally associated with MMP9. We therefore examined whether AR overexpression might also affect PIP5K1α/pAKT in VCaP cells. Significantly, AR overexpression resulted in increased PIP5K1α compared to the control (p < 0.001; Fig. 2d). Interestingly, DHT stimulation also led to a significant increase in PIP5K1α protein level (p = 0.002; Fig. 2d). Similarly, expression of phosphor-475 AKT, the downstream effector of PIP5K1α was remarkably increased in AR-transfected cells (p = 0.009) and in DHT-stimulated cells as well (p = 0.03; Fig. 2d). In agreement with our previous studies,10, 12, 13 our findings here provided new evidence suggesting that AR, MMP9 and PIP5K1α/AKT may be interconnected with each other in PCa cells.
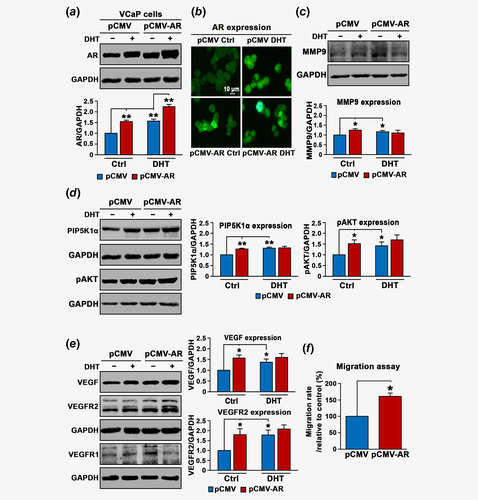
Given that VEGF is a growth factor critical for tumor vascularization and invasion under castration-resistant condition, and it is functionally related to MMP9, we wanted to examine whether AR overexpression might have impact on VEGF-associated angiogenic signaling. Indeed, expression of VEGF was significantly increased in VCaP cells overexpressing AR compared to that of the control (mean values of VEGF expression in pCMV control and pCMV-AR cells were 0.65 and 0.97, difference = 0.32, 95% CI = 0.95–0.98, p = 0.002), and in VCaP cells treated with DHT compared to cells treated with DMSO control (mean expression of VEGF expression in pCMV control and DHT-treated pCMV cells were 0.65 and 0.87, difference = 0.21, 95% CI = 0.84–0.89, p = 0.023; Fig. 2e). The similar effects of AR overexpression and DHT-stimulation on VEGFR2 were observed (mean expression of VEGFR2 in pCMV control and pCMV-AR cells were 0.4 and 0.69, 95% CI = 0.64–0.73, difference = 0.29, p = 0.024; mean expression of VEGFR2 in pCMV control and in DHT-treated pCMV cells were 0.4 and 0.72, difference = 0.32, 95% CI = 0.66–0.78, p = 0.01; Fig. 2e). AR overexpression increased expression of VEGFR1 (mean expression of VEGFR1 in pCMV control and pCMV-AR cells were 0.31 and 0.45, difference = 0.14, 95% CI = 0.45–0.46, p < 0.001), whereas DHT had no significant effect on VEGFR1 (Fig. 2e and Supporting Information Fig. S1).
Next, we wanted to elucidate the functional effect of AR on the behavior of VCaP cells. We observed that AR overexpression increased migratory ability of VCaP cells by 60% as compared to controls (p = 0.004, Fig. 2f). This suggests that AR-induced cascades of proteins MMP9, PIP5K1α/pAKT and VEGF signaling axis may have functional impact on the invasive behaviors of VCaP cells.
The functional link between AR and MMP9 is mediated by PIP5K1α
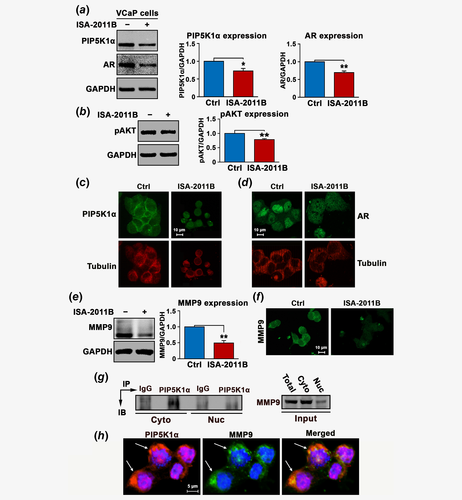
We hypothesize that AR may recruit PIP5K1α as a coregulatory protein to the AR complexes to trigger the activation of downstream pathways. To this end, we examined the effect of depletion of PIP5K1α from AR complexes on AR, pAKT, MMP9 and VEGF signaling axis in VCaP cells. Consistent with previous studies in PC-3 and LNCaP cells,10, 13, 19 PIP5K1α was inhibited by using its inhibitor ISA-2011B, which led to a significant down-regulation in PIP5K1α and phosphorylated AKT (for PIP5K1α, p = 0.003; for pAKT, p < 0.001; Figs. 3a and 3b). Treatment of VCaP cells with ISA-2011B resulted in decreased AR expression in VCaP cells (p < 0.001; Fig. 3a), also in agreement with our previous studies.10, 13, 19 Immunofluorescence analysis further revealed that ISA-2011B treatment remarkably reduced PIP5K1α in both cytoplasm and nucleus, which was accompanied with the reduced tubulin staining signals and disrupted membrane structure as well as the nuclear intensity of AR in VCaP cells (Figs. 3c and 3d). Similar inhibitory effects of ISA-2011B on MMP9 expression was observed (mean value of MMP9 expression in vehicle control and in ISA-2011B-treated cells were 2.32 and 1.23, difference = 1.09, 95% CI = 0.94–1.53; p < 0.001; Fig. 3e). The membrane/cytosolic expression of MMP9 was remarkably reduced in VCaP cells treated with ISA-2011B as determined by immunofluorescence analysis (Fig. 3f). Next, we examined whether PIP5K1α and MMP9 may be physically interact with each other in the subcellular compartments. To this end, we fractionated VCaP cells into membrane/cytoplasmic and nuclear fractions. The immunoprecipitation assays were performed by using lysates of membrane/cytoplasmic and nuclear fractions. We observed the presence of MMP9 in the PIP5K1α-associated protein-complexes predominantly in the membrane/cytosol compartments of VCaP cells (Fig. 3g). Immunofluorescence analysis of the double costained cells with antibodies against PIP5K1α (red) and MMP9 (green) under confocal microscope further confirmed the colocalization of PIP5K1α and MMP9 predominantly in the membrane/cytosol compartments of VCaP cells (orange; Fig. 3h). These findings suggest that MMP9 may physically interact with PIP5K1α to mediate the downstream signaling.
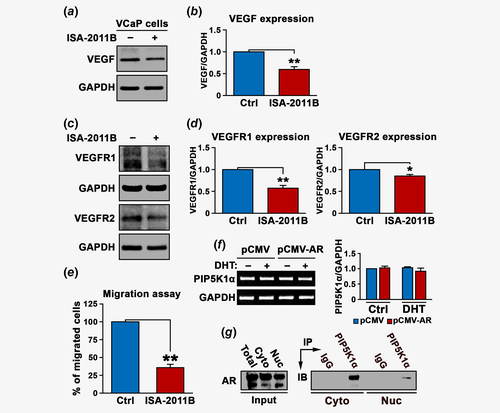
We next examined the effect of blocking PIP5K1α on VEGF signaling axis. ISA-2011B treatment efficiently blocked VEGF expression (mean value of VEGF expression in vehicle control and in ISA-2011B-treated cells were 0.71 and 0.45, difference = 0.26, 95% CI = 0.42–0.47; p < 0.001, Figs. 4a and 4b). Similarly, ISA-2011B treatment also led to a significant decrease in the expression of VEGFR1 (mean value of VEGFR1 expression in vehicle control and in ISA-2011B-treated cells were 0.73 and 0.41, 95% CI = 0.40–0.41; difference = 0.32, p < 0.001) and VEGFR2 in VCaP cells (mean value of VEGFR2 expression in vehicle control and in ISA-2011B-treated cells were 0.75 and 0.64, 95% CI = 0.63–0.64; difference = 0.11, p = 0.002; Figs. 4c and 4d). The effect of inhibition of PIP5K1α on invasive behaviors of VCaP cells was further assessed. Blocking PIP5K1α by ISA-2011B remarkably reduced the migratory ability of VCaP cells (p < 0.001; Fig. 4e). Thus, our findings pinpoint the PIP5K1α/AKT as primary key players that control the signaling molecules that are associated with AR and MMP9/VEGF signaling axis in PCa cells. To determine whether the regulation of PIP5K1α by AR might occur at transcriptional level, we examined effect of AR overexpression and DHT stimulation on mRNA expression of PIP5K1α using quantitative RT-PCR assay. Induced AR overexpression or DHT treatment did not have significant effect on PIP5K1α mRNA level (Fig. 4f). However, we found that AR and PIP5K1α formed immune-complexes in both cytosolic and nuclear compartments of VCaP cells as determined by immunoprecipitation assays (Fig. 4g). This suggests that AR rather influences PIP5K1α expression at protein level.
A direct functional link between MMP9 is mediated through PIP5K1α using PC-3 cells lacking AR
To further elucidate the precise interconnection among AR, PIP5K1α and MMP9 signaling pathways, we employed AR-negative cell line PC-3 cells. We examined the effect of induced AR in the absence or presence of DHT on PIP5K1α, pAKT and MMP9 signaling pathways in PC-3 cells (Figs. 5a, 5c and 5e). We observed that induction of exogenous AR significant increased expression of PIP5K1α and pAKT in PC-3 cells compared to the control (for PIP5K1α, p = 0.03; Fig. 5b, for pAKT, p = 0.01, Fig. 5e). Transfected-AR also increased MMP9 expression by threefold compared to the control (mean value of MMP9 expression in pCMV control cells and in pCMV-AR cells were 0.86 and 2.49, difference = 1.63, 95% CI = 2.14–2.85, p = 0.048, Fig. 5c). DHT stimulation of transfected AR had no significant effect on MMP9 expression (p = 0.67, Fig. 5c), indicating that AR is sufficient to affect MMP9 expression. Immunofluorescence analysis further revealed that the membrane and cytosol localization of MMP9 which was enhanced in PC-3 cells expressing pCMV-AR vector (Fig. 5d). Induction of exogenous AR also led to increased VEGF expression in PC-3 cells (mean value of VEGF expression in pCMV control cells and in pCMV-AR cells were 0.47 and 0.73, difference = 0.26, 95% CI = 0.7–0.76, p = 0.04, Figs. 5c and 5e). Similarly, Induced AR expression increased VEGFR1 and VEGFR2 (p = 0.03 vs. p = 0.03; Fig. 5f). This finding further validates a direct link between AR and MMP9/VEGF signaling axis.
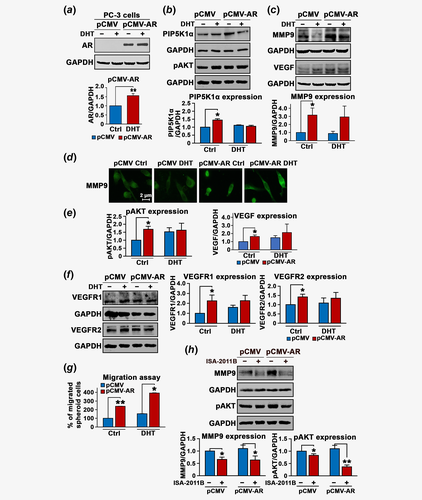
To further investigate whether induced AR expression may increase the invasive phenotype of PC-3 cells, we employed tumor-spheroid invasion assays to mimic the in vivo tumor conditions. To this end, AR-transfected PC-3 cells or control PC-3 cells were firstly subjected to formation of tumor-spheroids at three-dimensions for 10 days. The equal amount of tumor-spheroids were then subjected to the migration assay. Interestingly, cancer cells were able to release themselves from the tumor-spheroids and migrate to the lower chamber. AR-transfected tumor cells displayed a remarkably increase in the migration rate by 2.4-fold compared to control (p < 0.001; Fig. 5g). Interestingly, tumor cells derived from tumor spheroids which were formed by AR-transfected cells and were stimulated with DHT showed a greater increase by 3.4-fold of that of control vector-transfected cells treated with DHT (p = 0.014, Fig. 5g). In contrast, ISA-2011B treatment led to a significant decrease in MMP9 expression coincident with a decreased expression in pAKT in control PC-3 cells (for MMP9, p = 0.0012, for pAKT, p = 0.03) or PC-3 expressing AR (for MMP9, p = 0.043, pAKT, p < 0.001; Fig. 5h).
The role of AR and MMP9 in regulate downstream target gene cyclin A1
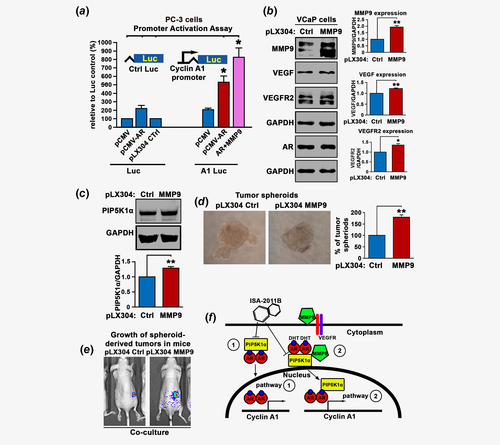
It is known that the coregulators allow interaction of the AR complex with the transcription apparatus to stimulate target gene transcription.26 To provide further mechanistic insights on the impact of MMP9 on AR transcriptional activity on its target gene in PCa cells, we utilized a cyclin A1 full-length promoter-luciferase reporter construct. We have previously shown that AR, VEGF and cyclin A1 promote PCa invasion and metastasis through feedback loops.27 We cotransfected PC-3 cells with PCMV-AR or PCMV control vectors with the cyclin A1 promoter-luciferase reporter construct (cyclin A1-Luc) or control luciferase reporter (Luc) construct. AR increased remarkably the cyclin A1-luciferase activity by approximately twofold as compared to that of control vector (p = 0.009; Fig. 6a). This suggests that AR is able to transactivate cyclin A1 transcriptional activity. Next, we examined whether induced MMP9 expression may enhance AR transcriptional activity on cyclin A1 promoter. Induced coexpression of MMP9 and AR remarkably increased cyclin A1 reporter luciferase activity as compared to that by AR alone (p = 0.02, Fig. 6a). This novel finding provides new evidence further supporting that AR and MMP9 are functionally associated with each other.
Functional consequence of induced MMP9 expression in PCa tumor-spheroids stimulated with myeloid cells in xenograft mouse model
To further gain mechanistic insights into the role of intracellular MMP9 and its downstream effectors in PCa cells, we induced MMP9 overexpression by transfecting VCaP cells with pLX304-MMP9 or control vectors. Immunoblot analysis confirmed the MMP9 overexpression in VCaP cells as compared to the control (p < 0.001; Fig. 6b). Interestingly, induced overexpression of MMP9 had no significant effect on the expression of AR (p = 0.47; Fig. 6b), but led to a significant increase in VEGF expression (p < 0.001) and VEGFR2 (p = 0.005; Fig. 6b). MMP9 overexpression had no significant effect on VEGFR1 expression in VCaP cells (p = 0.35, Supporting Information Fig. S2). As expected, overexpression of MMP9 resulted in a significant increase in PIP5K1α (p < 0.001; Fig. 6c).
Since the proteolytic MMP9 function can be activated after tumor cells being stimulated by their associated myeloid cells within the microenvironment during cancer invasion and metastasis.28 We prestimulated MMP9-transfected VCaP cells and control cells with U-937 cells, the myeloid cell line. We then subjected the cells to the tumor-spheroid formation assay. VCaP cells overexpressing MMP9 formed significantly higher numbers of tumor spheroids compared to controls (p < 0.001; Fig. 6d). Next, we implanted equal amount of tumor-spheroids derived from MMP9-transfected VCaP cells or control cells prestimulated by U-937 cells subcutaneously into the nude mice. Interestingly, the tumors from MMP9-overexpressing group appeared to be larger. Although the statistical significance was unable to be determined, it appeared that MMP9 group mice hade larger inflammatory signs around tumors (Fig. 6e).
Discussion
It is believed that AR is a key factor that promotes PCa progression and metastasis. However, the functional link between AR and the key proteins such as MMP9 and VEGF signaling axis that control PCa angiogenesis and metastasis remained largely unknown. In our study, we aimed to gain deeper understanding of the precise molecular mechanism and functional impact of AR, MMP9 and their associated PIP5K1α/pAKT and VEGF signaling in PCa. Our new findings illustrated the molecular mechanisms underlying the interplay of these key players in growth and invasion of PCa (Fig. 6f).
We observed that patients with elevated level of MMP9 mRNA suffered poorer DFS as compared to those with lower MMP9 expression level in their tumors, although this difference was not statistically significant. Both AR and MMP9 play important roles in promoting cancer cell invasion and metastatic dissemination to distant organs. We found that metastatic tumors had higher levels of AR and MMP9, and this suggests that patients had tumors expressing elevated levels of both AR and MMP9 may have high risk to experience cancer metastasis. MMP9 is one of the key factors which promote cancer metastasis and it is also a transcriptional target of AR, commonly present in metastatic PCa.
We showed that AR overexpression increased MMP9 protein level in AR-positive VCaP cells and AR-negative PC-3 cells. Also, AR overexpression significantly increased expression of PIP5K1α and phosphorylated AKT in PCa cells. This is in agreement with our previously reported studies suggesting that PIP5K1α and AR stabilize and enhance their protein expression by formation of protein–protein complexes with AR and CDK1.10, 13 Furthermore, AR-induced increase in MMP9 expression was mediated by PIP5K1α and phosphorylated AKT.
Thus, AR is sufficient to trigger the sequential activation of interconnected pathways including MMP9, PIP5K1α/AKT and VEGF signaling axis to promote PCa cell survival and invasion in an androgen-depleted environment by increasing the protein expression of AR. In addition, we showed that DHT enhanced the expression of AR without leading to an increase in protein expression of MMP9, PIP5K1α, pAKT and VEGF and VEFG2 in VCaP cells or PC-3 cells. Given that these proteins are the coactivators of AR, their expression may not be directly affected by DHT. Since the role of DHT as a ligand is to induce conformational change of AR leading to AR stabilization, binding to its coactivators, entering into the nucleus.2, 3
The effect of induced AR overexpression on MMP9 protein expression was mediated through PIP5K1α via posttranscriptional mechanisms. PIP5K1α/AKT appeared to be an important pathway which can lead to MMP9 activation, and our findings on that PIP5K1α forms protein–protein complexes with MMP9, which further suggests that MMP9 may directly acts as mediator of signal transduction in the cytosol.
It has been shown that MMP9 is associated with EGFR/PI3K/AKT pathways in PCa.19 In our study, we have identified MMP9 and PIP5K1α as important cofactors for AR, which play important roles in enhancing AR transcriptional activity on its target gene, cyclin A1. The elevated sequential activation of AR/PIP5K1α/AKT/MMP9/VEGF signaling axis contributed to increased invasiveness and growth of metastatic tumors. Conversely, treatment with PIP5K1α inhibitor significantly suppressed invasiveness of PCa cells expressing constitutively activated AR, coincident with its inhibitory effect on AR/MMP9/VEGF pathways. Further studies are needed to understand the precise mechanism that mediates the effect of AR/PIP5K1α on MMP9 expression during PCa metastasis.
Our new finding is in agreement with our previous studies in xenograft mice,10, 13 and further provides evidence suggesting that ISA-2011B exerts its effect on cooperative mechanisms involving AR, MMP9 and PIP5K1α/AKT pathways which drive PCa growth and invasion. Our findings provide new information to guide the targeted therapy for treatment of invasive castration-resistant PCa.
Acknowledgements
This work was supported by grants from the Swedish Cancer Society, The Swedish Children Foundation, H2020-MSCA-ITN-2018-European Commission, Malmö Cancer Foundation, the Government Health Innovation Grant, Kempe STF, Umeå University, Medical Faculty Grants Norland fund for Cancer Forskning, Umeå University and Medical Faculty Grants to JLP. The Grants from University of Copenhagen to NØ. The Royal Physiographical Foundation to MS. We sincerely thank Pirkko Härkönen (University of Turku, Turku) and Yvonne Lundberg Giwercman (Lund University, Lund) for providing reagents for our study. We also thank Kristina Ekström-Holka for technical help.
Open Research
Data availability
The data that support the findings of our study are available from the corresponding author upon reasonable request.


