Spatial and Temporal Variation in the Three Main Hydrological States of Temporary Streams in a Swiss Pre-Alpine Catchment
Funding: This work was supported by Swiss National Science Foundation, Grant Number: 159254 (project StreamEC).
ABSTRACT
There are three main hydrological states for temporary (i.e., non-perennial) streams: dry streambed, standing water (pools), and flowing water. These states and the changes between them uniquely influence the physical, chemical and biological conditions and processes in temporary streams. Therefore, it is important to characterise temporary stream dynamics based on the three states. However, there is a lack of high spatiotemporal resolution data of the three states across stream networks. In this study, a network of 30 multi-sensor monitoring systems was used to acquire 5-min data of the three states across a small pre-Alpine headwater catchment during a 3-month monitoring period. The standing water state was most common in the upper part of the catchment, while the flowing water state occurred more frequently downstream. The dry streambed state was dominant in a fault zone between two types of Flysch bedrock. The spatial variation of the hydrological state permanence was correlated to topography, specifically the local Topographic Wetness Index, channel slope and upslope contributing area, except for monitoring locations in the fault zone. The wetting pattern during precipitation events was a bottom-up pattern outside the fault zone and a top-down pattern in the fault zone. The spatial variation in the amount of precipitation prior to a state change and the soil moisture storage at the time of a state change were related to topography as well. The temporal variation in these wetness thresholds for state changes was influenced by the antecedent soil moisture conditions and precipitation intensity. Our findings highlight the influence of topography, geology, channel morphology and event characteristics on the variation of the three main hydrological states of temporary streams. Moreover, this work highlights the value of monitoring all three states and high temporal resolution state data. Monitoring only wet and dry states or at a lower temporal resolution (e.g., weekly) would not have captured any state changes for many of the monitoring locations, and, therefore, would have severely underestimated the temporary stream dynamics.
1 Introduction
Temporary streams (i.e., intermittent and ephemeral streams) are characterised by three main hydrological states: dry streambed, standing water (pools), and flowing water (Datry, Larned, and Tockner 2014; Gallart et al. 2017; Stubbington et al. 2017). The dominant flow pathways, residence and travel times, and physiochemical and biochemical processes differ for these states (Datry et al. 2018; McDonough, Hosen, and Palmer 2011). During the dry streambed and standing water states, the transport of water and nutrients is dominated by groundwater flow and hyporheic flow through the streambed (Bonada et al. 2020; Costigan et al. 2016; McDonough, Hosen, and Palmer 2011). Hyporheic flow is often more prominent during the standing water state. During the flowing water state, most transport occurs by streamflow. The residence and travel times are, therefore, generally longest during the dry streambed state and shortest during the flowing water state (Covino 2017). Solute concentrations are often higher in standing water than in flowing water, due to evapo-concentration and the relatively high contribution of groundwater (Gómez et al. 2017). Standing water can be more anoxic than flowing water due to the breakdown of accumulated organic material and low water turnover rates, especially when subsurface inputs are minimal. Because of these anoxic conditions, denitrification rates are often highest during the standing water state (von Schiller et al. 2011), while nitrification is favoured in aerobic dry streambeds (Merbt et al. 2016). CO2 efflux rates are highest during the dry streambed state due to a close linkage of CO2 production and gas flux in dry sediments and lowest during the standing water state because turbulence is higher in flowing water (von Schiller et al. 2014).
The three hydrological states also provide distinct habitats and fulfil unique ecological functions for different species. Dry streambeds serve as habitats and migration corridors for terrestrial species (Sánchez-Montoya et al. 2016; Steward et al. 2012), and egg or seed banks for aquatic biota (Williams 2006). Standing water functions as habitats for lentic species, refugia for lotic species, (Lake 2011), and sheltered ovipositional sites for (semi-)aquatic biota (Wilkins and Peterson 2000), while flowing water provides habitats for lotic species, and spawning and rearing sites for fish (Wigington Jr et al. 2006).
The conditions during the transitions between the three hydrological states (i.e., state changes) can be distinct from those during the preceding and succeeding states. For example, a state change from a dry streambed or standing water to flowing water can cause rapid transport of substantial amounts of water that can be relatively saline (Jacobson et al. 2000) or anoxic (Hladyz et al. 2011), and relatively rich in nutrients, organic matter, biota (Corti and Datry 2012), and sediment (Fortesa et al. 2021). A state change from flowing water to standing water or from standing water to a dry streambed can lead to a significant decrease in biomass and biodiversity until the arrival of new species and the establishment of new abiotic and biotic equilibriums (Bonada et al. 2017).
Thus, the permanence of the three hydrological states and the timing of the changes between the states have a significant influence on physical, chemical and biological conditions and processes in temporary streams (Bogan, Boersma, and Lytle 2015; Harjung et al. 2019; Shumilova et al. 2019). Moreover, the variation in the hydrological state permanence across stream networks and the timing of state changes during and following different precipitation events affect the hydrological connectivity (Godsey and Kirchner 2014), biochemical processing lengths (Fisher et al. 1998), and habitat mosaics and linkages (Bunn et al. 2006) in catchments. This, in turn, influences the water quantity (Phillips, Spence, and Pomeroy 2011), water quality (von Schiller et al. 2017), and ecology (Datry et al. 2017) of downstream perennial reaches. Therefore, it is important to characterise temporary stream dynamics, including during and following precipitation events, and the influence of site and event characteristics based on the three main hydrological states of temporary streams.
So far, the majority of temporary stream studies have collected data on the hydrological state of temporary streams during field surveys (Durighetto et al. 2020; Godsey and Kirchner 2014; Zimmer and McGlynn 2017). By necessity, these data have a low temporal resolution and can therefore only be used to determine the seasonal variation in the hydrological states (Eastman et al. 2021; Sefton et al. 2019). This tends to apply to surveys by aerial photography (Malard et al. 2006), LiDAR (Hooshyar et al. 2015), or drones (Spence and Mengistu 2016) as well. Several studies have used networks of low-cost temperature sensors (Constantz et al. 2001; Sando and Blasch 2015), electrical resistivity (ER) sensors (Goulsbra, Evans, and Lindsay 2014; Jaeger and Olden 2012; Jensen et al. 2019; Paillex et al. 2020; Peirce and Lindsay 2015) or float switch sensors (McDonough et al. 2015) to collect data on the hydrological state of temporary streams. These sensor networks allow the collection of high spatiotemporal resolution data, which can be used to determine the variation in the hydrological states during precipitation events. However, these sensors can only distinguish between two states: wet and dry, or, if the sensors are strategically installed on ripples or steps in the stream, flow and no flow. These data lump together the flowing water and standing water states or the standing water and dry streambed states, and hence do not allow the standing water state to be considered separately.
To characterise temporary streams dynamics in more detail, it is important to collect high spatiotemporal resolution data of all three hydrological states across stream networks (Eastman et al. 2021; Sefton et al. 2019). This will allow for a better representation of temporary streams in models and thus more robust assessments of their hydrological and ecological sensitivity to extreme weather conditions and changes in climate, land use and water use. However, there is currently a lack of high spatiotemporal resolution data of the three hydrological states. Bhamjee, Lindsay, and Cockburn (2016) and Assendelft and van Meerveld (2019) used combinations of low-cost sensors, including flow sensors, to distinguish between the three hydrological states of temporary streams but these setups were only used in field tests to evaluate the performance of the sensors. Time-lapse cameras can also be used to differentiate between the three hydrological states (Assendelft and van Meerveld 2019), but in practice have only been used to differentiate between two states (e.g., Durighetto et al. 2023; Kaplan et al. 2019).
- How do hydrological state permanence and temporary stream regime vary across the stream network, and how do site characteristics influence this variation?
- How does the timing of the state changes during and following precipitation events vary across the stream network, and how persistent is the order in which the state changes occur?
- How do the conditions at the time of the state changes vary across the stream network and between different events, and how do site and event characteristics influence this variation?
2 Methods
2.1 Study Site
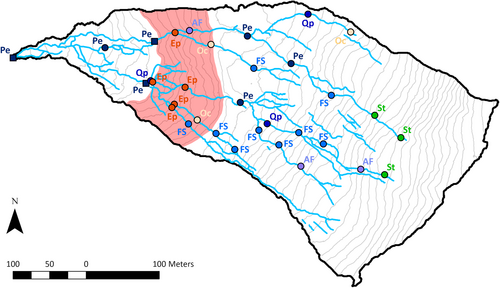
This study was conducted in the upper Studibach catchment, a 0.12 km2 headwater catchment in the Alptal in the Swiss pre-Alps (Figure 1). The catchment elevation ranges between 1421 and 1656 m.a.s.l. The topography consists of alternating steep (> 20°) slopes and flatter areas, resulting from landslides and soil creep. The mean slope is 23°. The slopes are covered by open forest in the lower part of the catchment, and a mixture of grasslands and open forest in the upper part. The flatter areas are generally more open and covered by (wet) meadows.
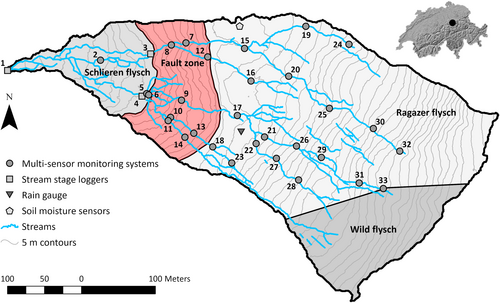
Soil type and depth in the catchment are related to the topography. On the steep slopes, the soils are umbric Gleysols, and in the flatter areas, the soils are mollic Gleysols (Schleppi et al. 1998). Soil depth ranges from 0.5 m on the steep slopes to 2.5 m in the flatter areas (van Meerveld et al. 2018). Groundwater levels are generally lower on the steep slopes than in the flatter areas (Rinderer, van Meerveld, and Seibert 2014).
The bedrock consists of three types of Tertiary Flysch (Figure 1), which are sequences of sedimentary rock that include argillite and bentonite schists, calcareous schists, marls and sandstone (Mohn et al. 2000). The boundary between the Wägitaler Flysch and Ragazer Flysch is characterised by relatively steep (channel) slopes, shallow soils, as well as large boulders and fractured rock outcrops in the streams. In the remainder of the text, this area is referred to as the fault zone.
Despite the high mean annual precipitation of 2266 mm (Stähli et al. 2021), most of the streams in the catchment are temporary streams. The drainage density is high (29 km/km2) and the flowing stream density increases more than five-fold between extremely dry conditions and large precipitation events during wet conditions (van Meerveld et al. 2019). The streams are relatively small and have a step-pool morphology. The bankfull width ranges between 10 and 200 cm, and the bankfull depth between 15 and 70 cm. The bankfull width to depth ratio is generally highest in the lower part of the catchment and lowest in the upper part. The channel slope varies between 3° and 32°, and is steepest in the fault zone. The dominant bed material ranges from silt in the upper part of the catchment, to boulders in the fault zone. For more information on the Studibach and Alptal catchments, see van Meerveld et al. (2018) and Stähli et al. (2021), respectively.
2.2 Hydrometric Measurements
Hydrometric measurements were taken during a 3-month monitoring period in the late summer and fall of 2017.
Hydrological state data of the streams were collected every 5 min, using a network of the multi-sensor monitoring systems designed and extensively tested in the field (over the course of several months during two field seasons) by Assendelft and van Meerveld (2019). Each multi-sensor monitoring system consists of an Arduino Pro Mini microcontroller board, an SD-card data logger shield and four sensors: an ER sensor, temperature sensor, float switch sensor, and flow sensor. The ER, temperature, and float switch sensors can be used to collect data on the presence of water, but in this study, we primarily used the data from the ER sensor because it was found to be the most reliable sensor in the field tests of Assendelft and van Meerveld (2019). The data from the temperature and float switch sensors were used to check the ER sensor data. The flow sensor was used to determine the occurrence of flow.
The multi-sensor monitoring systems were installed at 30 approximately evenly spaced locations along the main tributaries. More specifically, the multi-sensor monitoring systems were installed along contour lines (Figure 1). At each monitoring location, the ER, temperature and float switch sensors were installed in a pool, and the flow sensor was installed at the edge of the pool (or the step).
Precipitation and soil moisture content were measured in a relatively flat open area of the catchment, upslope of the fault zone (Figure 1). Precipitation was measured using a 0.2 mm resolution tipping bucket (Davis Instruments, CA, USA) connected to an Odyssey logger (Dataflow Systems Pty Ltd., New Zealand). Soil moisture content (in m3/m3) was measured every 5 min at 10 and 20 cm below the soil surface using GS3 soil moisture sensors connected to an Em50 logger (METER Group AG, Germany). To determine the total soil moisture storage in the upper 20 cm of the soil (in mm), the soil moisture content for each sensor was multiplied by the 100 mm depth interval and then summed. In the remainder of the text, this soil moisture storage is referred to as the soil moisture index (SI), as it is calculated similar to the widely used antecedent soil moisture index (ASI) (e.g., Detty and McGuire 2010; Penna et al. 2015; Scaife and Band 2017), with the difference that it is not only calculated for the start of a precipitation event but for every 5-min timestep. Even though the soil moisture content was only measured at one location and spatial variation in soil moisture content can be large, we used the temporal variation in SI at this location to represent the temporal variation in the overall soil moisture conditions across the catchment. We assume that the SI dynamics at this location represent the overall soil moisture dynamics across the catchment.
Stream stage (in cm) was measured every 5 min at the catchment outlet and two locations just below the fault zone (Figure 1) using DCX-22 CTD pressure transducers (Keller AG, Switzerland). The pressure was converted into stage based on the atmospheric pressure (adjusted for elevation) measured at the Erlenhöhe meteorological station (1210 m.a.s.l.) using a DCX-22 pressure transducer (Keller AG, Switzerland). Previous mapping of the stream network (van Meerveld et al. 2019) indicates that streamflow at these three locations is perennial. The stream stage measurements were mainly used to confirm the presence of water in the stream. Additionally, the stream stage at the catchment outlet was converted into discharge (in L/s) using a rating curve that was established using salt dilution gauging (Rinderer, van Meerveld, and Seibert 2014).
2.3 Site Characteristics
For each stream monitoring location (including the locations where the stream stage was measured), we determined a range of characteristics for the channel and the upslope contributing area. The characteristics for the channel include the bankfull width, bankfull depth, bankfull width to depth ratio, flood prone width, entrenchment ratio (i.e., the flood prone width to bankfull width ratio), slope, local Topographic Wetness Index (TWI; Beven and Kirkby 1979), and the size of the dominant bed material. The characteristics for the upslope contributing area include the size, mean elevation, mean slope, mean curvature, mean TWI, and percentage forest cover. The bankfull width, bankfull depth, and flood prone width were measured using a measurement tape. The size of the dominant bed material was based on the Wentworth grainsize scale (Wentworth 1922). The channel slope was measured using an inclinometer. The other topographic characteristics were derived from a 2 m resolution digital elevation model (swissALTI3D; Federal Office of Topography Swisstopo). However, the local TWI was calculated using the channel slope measured in the field instead of the slope derived from the digital elevation model, as this was considered to be more accurate. The percentage forest cover was based on an aerial photograph of the catchment that was manually converted into a forest cover raster file. Note that many of the site characteristics are highly correlated with each other (Table S1). For example, monitoring locations with a higher local TWI generally had coarser bed material and monitoring locations with a larger upslope contributing area generally had deeper channels.
2.4 Data Analyses
2.4.1 Hydrological State Permanence and Temporary Stream Regime
For each stream monitoring location, we determined the permanence of the three hydrological states and the temporary stream regime for the 3-month monitoring period. The permanence of a hydrological state was defined as the percentage of time during the monitoring period that the stream was in that state. The temporary stream regime was based on the permanence of the three states according to the classification of Gallart et al. (2017). For an overview and the descriptions of the different temporary stream regimes see Table S2.
The Spearman rank correlation (ρ, Spearman 1904) was used to determine how the variation in the permanence of the three hydrological states across the stream network was related to the site characteristics. Because the fault zone significantly influenced the permanence of the hydrological states (see results), the correlation was calculated once for all stream monitoring locations (including those in the fault zone) and once excluding the monitoring locations in the fault zone.
2.4.2 State Changes and Wetness Thresholds
For each stream monitoring location, we determined the timing of the state changes during and following precipitation events. We defined a precipitation event as any amount of precipitation separated by at least 2 h without precipitation. The state changes during events are from a dry streambed to standing water (D-S) and from standing water to flowing water (S-F). The state changes following events are from flowing water to standing water (F-S) and from standing water to a dry streambed (S-D). There was rarely a direct change (i.e., within one 5-min interval) from a dry streambed to flowing water (D-F) or vice versa. Therefore, these state changes were not considered in the analyses. For the descriptive statistics of the precipitation events and inter-event periods, including the number of D-S, S-F, F-S, and S-D state changes see Table S3 and S4.
For each precipitation event, we determined the order in which the state changes occurred across the stream network. More specifically, for each event we determined the rank of the state changes for every stream monitoring location. The Spearman rank correlation was used to compare the order of the state changes for the different events. This was done for all event pairs for which the same state change occurred for five or more monitoring locations. A correlation of one indicates that the order in which the state change occurred was the same for both events.
In addition to the timing of the state changes, we determined the conditions at the time of the state changes. We refer to these conditions as wetness thresholds (Table 1) because the state changed after the threshold was passed. For the state changes during precipitation events (i.e., D-S and S-F), these included the total amount of precipitation between the start of an event and the time of the state change (P threshold, in mm) and the total soil moisture storage in the upper 20 cm of the soil at the time of the state change (SI threshold, in mm). For the state changes following events (i.e., F-S and S-D), these included the time between the state change and the last precipitation (i.e., the end of an event), which we refer to as the dry period threshold (DP threshold, in days), and again the total soil moisture storage in the upper 20 cm of the soil at the time of the state change (SI threshold, in mm). For each stream monitoring location, we determined these wetness thresholds for every event for which there was a state change.
| State changes | Wetness thresholds | Event characteristics |
|---|---|---|
| During events: dry streambed to standing water (D-S) and standing water to flowing water (S-F) | Precipitation (P) threshold: the total amount of precipitation between the start of an event and the time of the state change | Antecedent soil moisture index (ASI): the total soil moisture storage in the upper 20 cm of the soil at the start of an event |
| Following events: flowing water to standing water (F-S) and standing water to dry streambed (S-D) | Soil moisture index (SI) threshold: the total soil moisture storage in the upper 20 cm of the soil at the time of the state change | Precipitation (P) intensity: the precipitation intensity between the start of an event and the time of the state change |
| Dry period (DP) threshold: the time between the end of an event and the state change | Precipitation (P) surplus: the amount of precipitation that has fallen after the initial state change (i.e., D-S or S-F) |
Similar to the permanence of the hydrological states, the Spearman rank correlation was used to assess the relation between the wetness thresholds and the site characteristics. This was done separately for all precipitation events for which a state change occurred for five or more stream monitoring locations, as well as for the mean wetness threshold values for the monitoring locations. This correlation was, again, calculated once for all monitoring locations and once excluding the monitoring locations in the fault zone.
To better understand the temporal variation in the wetness threshold values for the different precipitation events, we determined the correlation between the wetness threshold values and specific event characteristics (Table 1). This was done for each stream monitoring location for which we could determine a wetness threshold for four or more events. The variation in the P threshold values for a monitoring location was related to the antecedent soil moisture index (ASI, in mm) as we expected that less precipitation would be needed for a state change if the antecedent conditions were wet. The ASI was defined as the SI at the start of an event. The variation in the SI threshold values for a monitoring location was related to the precipitation intensity between the start of an event and the time of the state change (P intensity, in mm/h) because we expected the states to change at a lower moisture condition during more intense events and also to change back at a lower moisture condition following more intense events. The variation in the DP threshold values for a monitoring location was related to the surplus precipitation (P surplus, in mm), which was defined as the amount of precipitation that had fallen after the initial state change during an event (i.e., D-S or S-F), because we expected the period of drying to be longer if there was a larger amount of surplus precipitation during an event.
3 Results
3.1 Hydrological State Permanence and Temporary Stream Regime
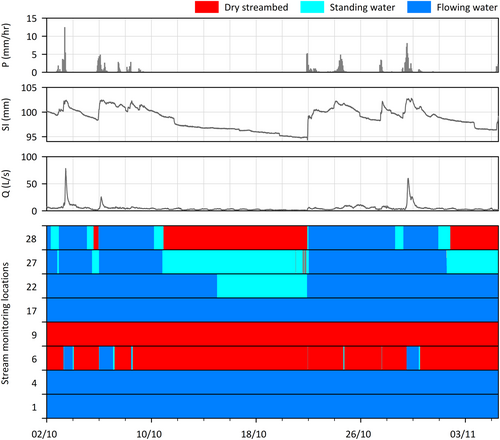
Figure 2 shows the time series of the hydrological state for eight stream monitoring locations along one of the main tributaries of the stream network for October 2017. During this period, the stream was continuously flowing at the monitoring locations downstream of the fault zone and was mainly dry in the fault zone. Just above the fault zone the stream was also mostly flowing, but at the monitoring locations further upstream (i.e., towards the ridge) there were periods of standing water. Close to the stream head, the stream occasionally dried up. For the time series of the hydrological state for all monitoring locations for October 2017 see Figure S1.
A similar pattern was observed for the hydrological state permanence across the whole stream network for the 3-month monitoring period (Figure 3). The flowing water permanence was 92%–100% for the stream monitoring locations below the fault zone and as high as 100% for some monitoring locations just above the fault zone. However, further upstream, the flowing water permanence decreased to as low as 23%. Conversely, the standing water state was mostly absent for the monitoring locations downstream of the fault zone, except for monitoring location 5 (8% of the time). Above the fault zone, the standing water permanence increased towards the ridge (up to 77%). At the monitoring locations in the fault zone, the flowing and standing water permanence were less than 16% and 10%, respectively. The dry streambed permanence was 79% or more in this part of the catchment. Exceptions were monitoring locations 7 and 14, which had a relatively high flowing water permanence (67% and 82%, respectively). Only five monitoring locations outside the fault zone (16, 24, 27, 28, and 31) experienced a dry streambed during the monitoring period (1%–64% of the time). These monitoring locations were located close to the stream heads. At the other monitoring locations close to the stream heads, standing water persisted. The flowing water permanence was generally higher at the monitoring locations close to the stream heads that experienced a dry streambed than at the ones where standing water persisted.
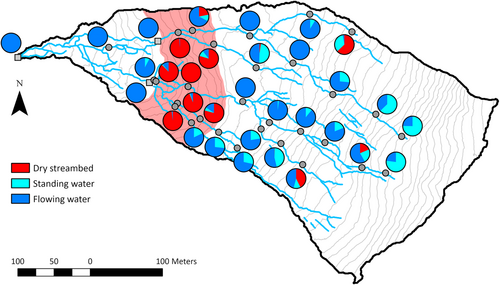
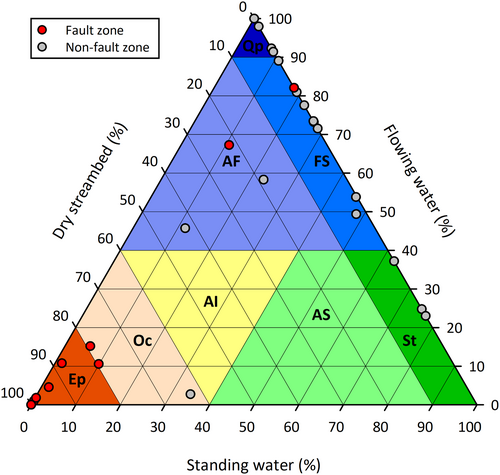
Based on the permanence values for the three hydrological states, the most common regime according to the classification of Gallart et al. (2017) was fluent-stagnant (Figure 4). The regime was perennial or quasi-perennial for the monitoring locations downstream of the fault zone, and occasional or episodic for the monitoring locations in the fault zone, except for monitoring locations 7 and 14 for which the regime was alternate-fluent and fluent-stagnant, respectively (Figure 5). Above the fault zone, the regime changed with distance upstream. For example, in one of the main tributaries the regime changed from perennial to quasi-perennial to fluent-stagnant to alternate-fluent to stagnant in the upstream direction.
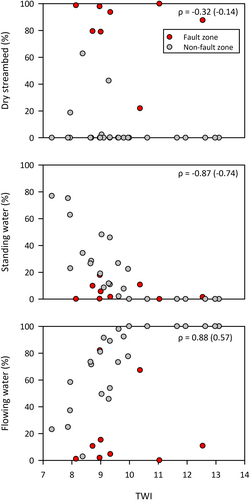
For the stream monitoring locations outside the fault zone, the standing water and flowing water permanence were both strongly correlated (|ρ| ≥ 0.60) to the bankfull depth, channel slope, local TWI, dominant bed material size, upslope contributing area, and mean elevation of the upslope contributing area (Table 2). The correlation to the local TWI was the strongest (ρ = −0.87 for the standing water permanence and 0.88 for the flowing water permanence) (Figure 6). When the monitoring locations in the fault zone were included, the strength of the correlations decreased considerably. The dry streambed permanence was not strongly correlated to any of the site characteristics, but the occurrence of the dry streambed state was clearly related to the location of the fault zone (Figure 3). The monitoring locations close to the stream heads that experienced a dry streambed generally had higher bankfull width to depth ratios and coarser dominant bed material than the monitoring locations close to the stream heads where standing water persisted, but, conversely, also higher local TWI values.
| Channel characteristics | Upslope contributing area characteristics | ||||||||||||||
|---|---|---|---|---|---|---|---|---|---|---|---|---|---|---|---|
| State (change) | Bankfull width | Bankfull depth | Bankfull w/d ratio | Floodprone width | Entrenchment ratio | Slope | TWI | Dominant bed material | Size | Mean elevation | Mean slope | Mean curvature | Mean TWI | Forest cover | |
| Hydrological state permanence | D | 0.14 (0.22) | 0.00 (−0.06) | 0.15 (0.38) | −0.26 (−0.25) | −0.29 (−0.32) | 0.34 (0.35) | −0.32 (−0.14) | −0.26 (0.21) | −0.28 (0.02) | 0.17 (−0.31) | 0.17 (−0.33) | −0.03 (0.14) | 0.08 (0.23) | 0.30 (0.03) |
| S | −0.64 (−0.57) | −0.71 (−0.48) | −0.47 (−0.55) | −0.19 (−0.18) | 0.29 (0.21) | 0.61 (0.44) | −0.87 (−0.74) | −0.82 (−0.76) | −0.85 (−0.77) | 0.60 (0.59) | 0.26 (0.29) | 0.20 (0.22) | −0.06 (−0.09) | 0.33 (0.23) | |
| F | 0.56 (0.22) | 0.63 (0.42) | 0.42 (0.00) | 0.25 (0.26) | −0.19 (0.06) | −0.67 (−0.55) | 0.88 (0.57) | 0.81 (0.21) | 0.82 (0.41) | −0.64 (−0.05) | −0.36 (0.15) | −0.17 (−0.25) | 0.07 (−0.10) | −0.44 (−0.16) | |
| Mean P threshold | D-S | 0.14 (0.21) | −0.05 (−0.09) | 0.15 (0.40) | −0.18 (−0.20) | −0.23 (−0.28) | 0.25 (0.29) | −0.33 (−0.15) | −0.29 (0.18) | −0.33 (0.00) | 0.14 (−0.31) | 0.17 (−0.32) | 0.06 (0.18) | 0.00 (0.18) | 0.23 (0.02) |
| S-F | −0.43 (−0.14) | −0.47 (−0.31) | −0.35 (0.04) | −0.21 (−0.23) | 0.17 (−0.07) | 0.67 (0.56) | −0.79 (−0.50) | −0.75 (−0.17) | −0.72 (−0.34) | 0.59 (0.02) | 0.57 (−0.04) | 0.13 (0.21) | −0.24 (0.03) | 0.64 (0.24) | |
| Mean SI threshold | D-S | 0.15 (0.22) | −0.06 (−0.09) | 0.16 (0.41) | −0.19 (−0.21) | −0.24 (−0.30) | 0.22 (0.27) | −0.33 (−0.14) | −0.30 (0.20) | −0.34 (−0.01) | 0.11 (−0.36) | 0.16 (−0.36) | 0.03 (0.18) | −0.02 (0.17) | 0.24 (0.01) |
| S-F | −0.55 (−0.23) | −0.65 (−0.46) | −0.39 (0.01) | −0.30 (−0.27) | 0.14 (−0.06) | 0.70 (0.53) | −0.84 (−0.54) | −0.76 (−0.22) | −0.78 (−0.40) | 0.63 (0.05) | 0.32 (−0.16) | 0.20 (0.29) | −0.03 (0.10) | 0.41 (0.16) | |
| F-S | −0.55 (−0.22) | −0.69 (−0.49) | −0.40 (0.05) | −0.15 (−0.23) | 0.30 (−0.01) | 0.69 (0.51) | −0.87 (−0.56) | −0.83 (−0.22) | −0.85 (−0.44) | 0.67 (−0.03) | 0.30 (−0.25) | 0.39 (0.45) | 0.02 (0.14) | 0.45 (0.13) | |
| S-D | 0.18 (0.23) | 0.02 (−0.08) | 0.18 (0.40) | −0.42 (−0.28) | −0.46 (−0.35) | 0.24 (0.32) | −0.23 (−0.11) | −0.21 (0.22) | −0.19 (0.05) | 0.06 (−0.36) | 0.06 (−0.38) | −0.08 (0.13) | 0.15 (0.25) | 0.36 (0.02) | |
| Mean DP threshold | F-S | 0.53 (0.16) | 0.67 (0.43) | 0.38 (−0.09) | 0.12 (0.21) | −0.31 (0.04) | −0.69 (−0.53) | 0.86 (0.54) | 0.82 (0.17) | 0.84 (0.42) | −0.67 (0.05) | −0.31 (0.26) | −0.41 (−0.44) | −0.04 (−0.16) | −0.40 (−0.12) |
| S-D | −0.18 (−0.25) | −0.02 (0.05) | −0.18 (−0.41) | 0.42 (0.29) | 0.46 (0.37) | −0.24 (−0.34) | 0.23 (0.11) | 0.21 (−0.25) | 0.19 (−0.06) | −0.06 (0.36) | −0.06 (0.39) | 0.08 (−0.13) | −0.15 (−0.28) | −0.36 (−0.02) | |
| P threshold for individual events | D-S | N/A | N/A | N/A | N/A | N/A | N/A | N/A | N/A | N/A | N/A | N/A | N/A | N/A | N/A |
| (0.09–0.16) | (−0.06 to −0.15) | (0.33–0.41) | (−0.07 to −0.23) | (−0.11 to −0.27) | (0.15–0.35) | (−0.09 to −0.16) | (0.26–0.36) | (0.02–0.09) | (−0.28 to −0.49) | (−0.27 to −0.46) | (0.11–0.31) | (0.04–0.19) | (0.00 to −0.08) | ||
| S-F | −0.23 to −0.43 | −0.30 to −0.51 | −0.16 to −0.34 | 0.10 to −0.69 | 0.21 to −0.22 | 0.50–0.70 | −0.63 to −0.80 | −0.56 to −0.76 | −0.54 to −0.73 | 0.41–0.61 | 0.04–0.52 | −0.04 to 0.51 | −0.20 to 0.53 | 0.27–0.60 | |
| (0.01 to −0.15) | (−0.21 to −0.39) | (0.04–0.30) | (−0.01 to −0.39) | (−0.02 to −0.19) | (0.22–0.66) | (−0.26 to −0.62) | (−0.21–0.24) | (−0.10 to −0.40) | (0.11 to −0.38) | (−0.02 to −0.42) | (0.08–0.46) | (−0.01–0.27) | (0.00–0.34) | ||
| SI threshold for individual events | D-S | N/A | N/A | N/A | N/A | N/A | N/A | N/A | N/A | N/A | N/A | N/A | N/A | N/A | N/A |
| (0.06–0.14) | (−0.07 to −0.21) | (0.29–0.40) | (−0.21–0.15) | (0.12 to −0.20) | (0.15–0.40) | (−0.03 to −0.11) | (0.26–0.31) | (0.04–0.18) | (−0.20 to −0.42) | (−0.24 to −0.42) | (0.10–0.31) | (−0.11–0.28) | (−0.01 to −0.16) | ||
| S-F | −0.22 to −0.44 | −0.37 to −0.49 | −0.16 to −0.33 | 0.01 to −0.59 | −0.07 to 0.21 | 0.45–0.57 | −0.61 to −0.66 | −0.53 to −0.64 | −0.54 to −0.65 | 0.43–0.48 | 0.04–0.37 | −0.09 to 0.29 | −0.17 to 0.31 | 0.30–0.58 | |
| (0.15 to −0.25) | (−0.10 to −0.41) | (−0.01–0.43) | (−0.01 to −0.41) | (0.02 to −0.25) | (0.22–0.66) | (−0.13 to −0.50) | (−0.19–0.31) | (0.02 to −0.32) | (0.12 to −0.47) | (−0.01 to −0.42) | (0.08–0.42) | (−0.05–0.34) | (0.02–0.34) | ||
| F-S | 0.40–0.55 | 0.55–0.63 | 0.16–0.42 | 0.11–0.32 | −0.10 to −0.34 | −0.21 to −0.42 | 0.55–0.70 | 0.64–0.71 | 0.66–0.75 | −0.05 to −0.47 | 0.36 to −0.58 | −0.12 to −0.42 | 0.52 to −0.60 | 0.00 to −0.32 | |
| (0.16–0.52) | (0.35–0.43) | (−0.21–0.55) | (−0.04–0.32) | (−0.05 to −0.17) | (−0.32 to −0.40) | (0.33–0.54) | (0.13–0.80) | (0.33–0.50) | (0.39 to −0.61) | (−0.34–0.55) | (−0.20 to −0.36) | (0.19 to −0.47) | (−0.13–0.15) | ||
| S-D | N/A | N/A | N/A | N/A | N/A | N/A | N/A | N/A | N/A | N/A | N/A | N/A | N/A | N/A | |
| (−0.11 to −0.16) | (0.11–0.11) | (−0.32 to −0.35) | (0.21–0.24) | (0.19–0.25) | (−0.20 to −0.37) | (0.06–0.15) | (−0.16 to −0.25) | (0.01 to −0.10) | (0.25–0.34) | (0.28–0.36) | (−0.11 to −0.28) | (−0.23 to −0.26) | (0.03–0.10) | ||
| DP threshold for individual events | F-S | 0.22–0.50 | 0.47–0.67 | 0.04–0.32 | −0.07 to 0.36 | 0.10 to −0.38 | −0.21 to −0.59 | 0.62–0.81 | 0.72–0.79 | 0.71–0.82 | −0.04 to −0.55 | 0.32 to −0.54 | −0.25 to −0.44 | 0.25 to −0.54 | −0.14 to −0.57 |
| (0.05–0.64) | (0.32–0.46) | (−0.29–0.35) | (0.06–0.57) | (0.03 to −0.05) | (−0.33 to −0.70) | (0.43–0.70) | (0.09–0.29) | (0.35–0.52) | (−0.23–0.42) | (0.03–0.55) | (−0.31 to −0.37) | (0.02 to −0.25) | (0.13 to −0.20) | ||
| S-D | N/A | N/A | N/A | N/A | N/A | N/A | N/A | N/A | N/A | N/A | N/A | N/A | N/A | N/A | |
| (−0.14 to −0.18) | (0.09–0.10) | (−0.34 to −0.39) | (0.22–0.24) | (0.22–0.27) | (−0.21 to −0.37) | (0.10–0.16) | (−0.17 to −0.30) | (0.01 to −0.07) | (0.26–0.43) | (0.29–0.44) | (−0.16 to −0.32) | (−0.19 to −0.23) | (0.01–0.06) | ||
- Abbreviations: D, dry streambed; DP, dry period; F, flowing water; P, precipitation; S, standing water; SI, soil moisture index; TWI, Topographic Wetness Index.
3.2 State Changes and Wetness Thresholds
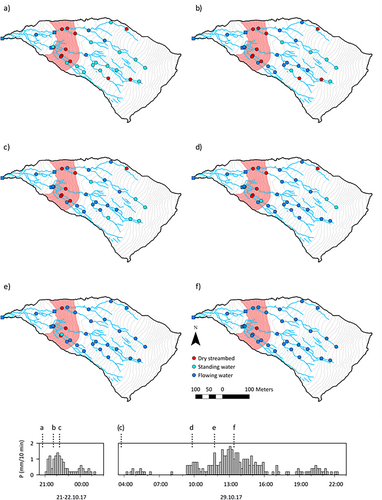
During most precipitation events, the hydrological state changed at only a small number of stream monitoring locations (n ≤ 6; Table S3). Figure 7 shows the wetting pattern (i.e., the order of the D-S and S-F state changes) across the stream network for two events (on 21–22 and 29 October 2017, respectively). At the monitoring locations above the fault zone, the wetting included mostly S-F state changes, while at the monitoring locations in the fault zone, there were both D-S and S-F state changes. The general wetting pattern was a bottom-up pattern from just above the fault zone towards the ridge, followed by a top-down pattern in the fault zone. The order of the D-S and S-F state changes in the fault zone was the same. There were almost no state changes at the monitoring locations below the fault zone because flow was mostly perennial in this part of the catchment. The drying pattern following the events was the reverse of the wetting pattern (not shown).
The order of the state changes was similar for the other events during the monitoring period. For most event pairs, the order was strongly correlated (ρ ≥ 0.60). The median ρ ranged between 0.80 for the S-D state change and 0.90 for the D-S and F-S state changes (Table 3). The percentage of event pairs for which ρ ≥ 0.60 was 91% for the D-S state change (11 event pairs), 94% for the S-F state change (16 event pairs), 78% for the F-S state change (9 event pairs) and 83% for the S-D state change (6 event pairs). Per state change, there were only one or two event pairs for which the order was not strongly correlated (ρ < 0.60). The moderate or weak correlation for these event pairs was often related to the small number of stream monitoring locations for which the same state change occurred, in combination with one or two outliers.
| State change | D-S | S-F | F-S | S-D |
|---|---|---|---|---|
| Number of event pairs (n) | 11 | 16 | 9 | 6 |
| Mean ρ | 0.80 | 0.85 | 0.75 | 0.77 |
| Median ρ | 0.90 | 0.85 | 0.90 | 0.80 |
| Range (min–max) ρ | 0.50–1.00 | 0.50–1.00 | 0.30–1.00 | 0.40–1.00 |
| ρ ≥ 0.60 (% of event pairs) | 91 | 94 | 78 | 83 |
- Abbreviations: D, dry streambed; F, flowing water; S, standing water.
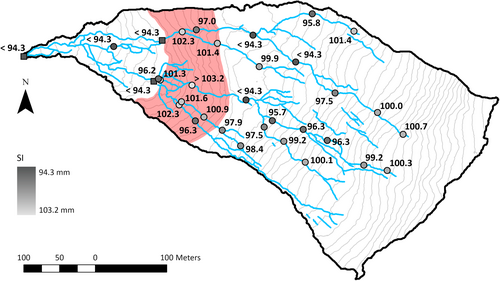
The general order of the state changes during and following precipitation events was reflected in the wetness threshold values for the state changes. The P and SI thresholds were generally lowest for the stream monitoring locations downstream of the fault zone and just above the fault zone, and highest in the fault zone. Above the fault zone, these threshold values increased towards the ridge, while in the fault zone they increased in the downstream direction. This pattern was observed for individual events and for the mean wetness threshold values (see Figure 8 for the mean SI threshold values for the F-S state change). The opposite pattern was observed for the DP thresholds.
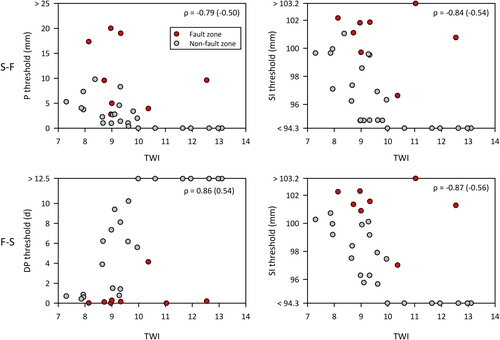
Similar to the results for the standing water and flowing water permanence, the spatial variation in the wetness threshold values for the S-F and F-S state changes was strongly correlated (|ρ| ≥ 0.60) to the channel slope, local TWI, dominant bed material size and upslope contributing area, when the stream monitoring locations in the fault zone were excluded (Table 2). This was true for most of the precipitation events and for the mean wetness threshold values. The moderate correlations for some of the events were related to the small number of monitoring locations for which the state changes occurred, in combination with one or two outliers. The strongest correlations were between the mean wetness threshold values for the S-F and F-S state changes and the local TWI (Figure 9). The correlations between the wetness thresholds for the D-S and S-D state changes and the site characteristics were generally weak (|ρ| < 0.40).
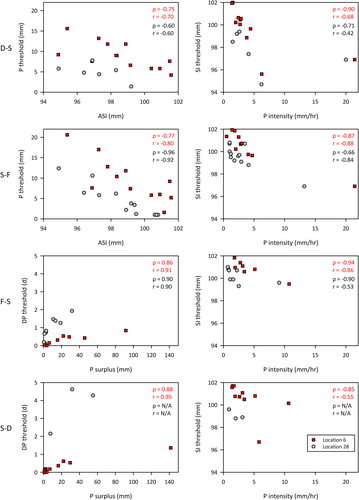
The variation in the wetness threshold values for the different precipitation events was for most stream monitoring locations for which we could determine a wetness threshold for four or more events (linearly) correlated to the event characteristics (Table 4, and Figure 10 for two example monitoring locations, one outside the fault zone [location 28] and one inside the fault zone [location 6]). However, the correlations were not always significant at the 0.05 level because for many of these monitoring locations there was only a small number of events for which there was a state change (median: 6 events). The P threshold for the D-S state change was strongly negatively correlated (ρ ≤ −0.60) to the ASI for 75% of the monitoring locations for which the D-S state change occurred during four or more events. For the S-F state change, this was the case for 81% of the monitoring locations. Similarly, the DP threshold for the F-S state change was strongly positively correlated (ρ ≥ 0.60) to the P surplus for 91% of the monitoring locations. For the S-D state change this was the case for 80% of the monitoring locations. The SI thresholds for the D-S, S-F, F-S and S-D state changes were strongly negatively correlated to the P intensity for most monitoring locations. However, for a number of monitoring locations, the SI thresholds and the P intensity were moderately correlated (−0.60 < ρ ≤ −0.40) due to several outliers for very high intensity precipitation events (e.g., see Figure 10).
| P threshold vs. ASI | SI threshold vs. P intensity | DP threshold vs. P surplus | ||||||
|---|---|---|---|---|---|---|---|---|
| Stream monitoring locations | D-S | S-F | D-S | S-F | F-S | S-D | F-S | S-D |
| 1–5, 9, 14–15, 17, 19–22, 25, 26, 29 | N/A | N/A | N/A | N/A | N/A | N/A | N/A | N/A |
| 6 | −0.75 (−0.70) | −0.77 (−0.80) | −0.90 (−0.68) | −0.87 (−0.88) | −0.94 (−0.86) | −0.85 (−0.55) | 0.86 (0.91) | 0.88 (0.95) |
| 7 | N/A | −0.94 (−0.92) | N/A | −0.89 (−0.68) | N/A | N/A | N/A | N/A |
| 8 | −0.63 (−0.74) | −1.00 (−0.96) | −0.40 (−0.43) | −0.40 (−0.42) | N/A | N/A | N/A | N/A |
| 10 | −0.63 (−0.61) | −1.00 (−0.92) | −0.74 (−0.61) | −0.50 (−0.46) | −0.50 (−0.49) | −0.61 (−0.81) | 0.70 (0.99) | 0.73 (0.99) |
| 11 | −0.41 (−0.80) | −0.41 (−0.81) | −0.31 (−0.45) | −0.31 (−0.45) | −0.60 (−0.52) | −0.60 (−0.59) | 0.90 (0.83) | 0.70 (0.92) |
| 12 | −0.84 (−0.74) | −0.89 (−0.92) | −0.70 (−0.57) | −0.68 (−0.58) | −0.71 (−0.64) | −0.49 (−0.80) | 0.83 (0.74) | 0.47 (0.35) |
| 13 | −0.92 (−0.91) | −0.99 (−0.94) | −0.73 (−0.93) | −0.88 (−0.97) | −1.00 (−0.92) | −0.70 (−0.78) | 0.80 (0.85) | 0.90 (0.89) |
| 16 | N/A | −0.77 (−0.88) | N/A | −0.72 (−0.52) | −0.50 (−0.53) | N/A | 0.76 (0.78) | N/A |
| 18 | N/A | −0.60 (−0.80) | N/A | −0.30 (0.05) | N/A | N/A | N/A | N/A |
| 23 | N/A | 0.10 (0.04) | N/A | −0.90 (−0.89) | N/A | N/A | N/A | N/A |
| 24 | −0.20 (−0.26) | N/A | −0.80 (−0.94) | N/A | N/A | N/A | N/A | N/A |
| 27 | N/A | −0.94 (−0.93) | N/A | −0.54 (−0.89) | −0.80 (−0.95) | N/A | 0.60 (0.50) | N/A |
| 28 | −0.60 (−0.60) | −0.96 (−0.92) | −0.71 (−0.42) | −0.66 (−0.84) | −0.90 (−0.53) | N/A | 0.90 (0.90) | N/A |
| 30 | N/A | −0.40 (−0.92) | N/A | −0.80 (−0.87) | −0.20 (−0.41) | N/A | 1.00 (0.97) | N/A |
| 31 | N/A | −1.00 (−0.93) | N/A | −0.20 (−0.98) | N/A | N/A | N/A | N/A |
| 32 | N/A | −0.83 (−0.77) | N/A | −0.79 (−0.89) | −0.60 (−0.90) | N/A | 0.66 (0.99) | N/A |
| 33 | N/A | −0.80 (−0.97) | N/A | −0.80 (−0.69) | −0.80 (−1.00) | N/A | 0.80 (0.88) | N/A |
| n ≥ 4 | 8 | 16 | 8 | 16 | 11 | 5 | 11 | 5 |
| |ρ (r)| ≥ 0.60 (%) | 75 (88) | 81 (94) | 75 (50) | 63 (63) | 73 (55) | 80 (60) | 100 (91) | 80 (80) |
| |ρ (r)| ≥ 0.40 (%) | 88 (88) | 94 (94) | 88 (100) | 81 (94) | 91 (100) | 100 (100) | 100 (100) | 100 (80) |
- Abbreviations: ASI, antecedent soil moisture index; D, dry streambed; DP, dry period; F, flowing water; P, precipitation; S, standing water; SI, soil moisture index.
4 Discussion
4.1 Spatial Variation in Hydrological State Permanence and State Changes
The high permanence of the flowing water and standing water states at the stream monitoring locations outside the fault zone suggests that the streams in this part of the catchment were mainly gaining streams (McDonough, Hosen, and Palmer 2011). This is consistent with the groundwater level data collected in the Studibach catchment by Rinderer, van Meerveld, and Seibert (2014), who showed that in most places groundwater levels are relatively close to the soil surface. Conversely, at the monitoring locations in the fault zone, the streams were mostly dry and only flowed during and shortly after large precipitation events. Together with the top-down wetting pattern in this part of the catchment, this indicates that the streams in the fault zone were losing streams (McDonough, Hosen, and Palmer 2011), and that the water coming from the upstream areas only made it down through the fault zone as streamflow when the inflow from the upstream areas exceeded the infiltration losses in the fault zone (Buttle et al. 2012).
The general wetting pattern during precipitation events (i.e., the order of the D-S and S-F state changes) in the sections of the tributaries outside the fault zone was a bottom-up pattern. This pattern closely resembles the headward expansion model described by Bhamjee and Lindsay (2011). The top-down pattern in the fault zone resembles their downstream expansion model. The high similarity in the order of the state changes for the different events is an indication that the site characteristics have a large influence on the variation in the hydrological states across the stream network, and that the order of the state changes is thus predictable (Botter and Durighetto 2020; Bujak-Ozga et al. 2023; Goulsbra, Evans, and Lindsay 2014).
The standing water and flowing water permanence, and the wetness thresholds for the S-F and F-S state changes for the stream monitoring locations outside the fault zone were strongly correlated with the local TWI, channel slope and upslope contributing area. This highlights the substantial effect of topography on the hydrological state of the streams. Several studies with two-state (wet/dry or flow/no flow) approaches have similarly shown that the channel slope and upslope contributing area can be used as predictors for the variation in the hydrological state across stream networks (Goulsbra, Evans, and Lindsay 2014; Jensen et al. 2019; Kaplan, Blume, and Weiler 2020; Pate, Segura, and Bladon 2020; Prancevic and Kirchner 2019). The strong correlations with the bankfull depth, dominant bed material size and mean elevation of the upslope contributing area were probably the result of the strong correlation between these site characteristics and the local TWI, channel slope and upslope contributing area (Table S1). There was no strong correlation between the dry streambed permanence or the wetness thresholds for the D-S and S-D state changes and any of the site characteristics for the monitoring locations outside the fault zone, possibly because only a few monitoring locations in this part of the catchment experienced a dry streambed during the monitoring period. However, these monitoring locations were located close to the stream heads. This indicates that the streams outside the fault zone first dry up at the stream heads and, therefore, that the occurrence of the dry streambed state outside the fault zone is potentially also influenced by topography.
The decrease in the strength of the correlations with the topographic site characteristics when the monitoring locations in the fault zone were included in the analysis, and the dominance of the dry streambed state in the fault zone, implies that the site characteristics in the fault zone override the influence of topography on the hydrological state of the streams. Previous studies have described the effects of site characteristics similar to those in the fault zone on flow permanence. These include transmission losses related to coarse streambed sediment (Levick et al. 2008; Sando and Blasch 2015) and bedrock fractures (Buttle et al. 2012; Lovill, Hahm, and Dietrich 2018), low storage capacity due to shallow soils (Durighetto et al. 2020; Jencso and McGlynn 2011) and shorter residence times of water because of steep (channel) slopes (Wohl et al. 2017).
The spatial variation in the flowing water and dry streambed states and the influence of topography and geology fits the conceptual model of Godsey and Kirchner (2014). In their model, the occurrence of surface flow at any point in the stream network is controlled by the balance between water delivery from the upslope contributing area and subsurface transmissivity. They expressed water delivery from the upslope contributing area as the precipitation minus the evaporation for that area. Subsurface transmissivity was expressed as the product of the cross-sectional area of the valley bottom hyporheic zone, the channel slope and the hydraulic conductivity of the subsurface material. For our results to fit this concept, we need to assume that the precipitation and evaporation are uniform across the small study catchment. We, furthermore, need to assume that the cross-sectional area of the valley bottom hyporheic zone is related to the bankfull width and depth, and the hydraulic conductivity of the subsurface material is related to the dominant bed material size. All three assumptions seem reasonable. For the stream monitoring locations outside the fault zone, the upslope contributing area, bankfull width and depth, and dominant bed material size generally increase in the downstream direction, but the magnitude of the increase for the upslope contributing area is considerably larger than for the other variables. The channel slope generally decreases in the downstream direction. Together these changes explain the increase in flowing water permanence in the downstream direction, the bottom-up wetting pattern during precipitation events, and, thus, the strong positive correlations with the local TWI and upslope contributing area and the strong negative correlation with the channel slope. In the fault zone, the hydraulic conductivity of the streambed is relatively high due to the large boulders and fractured rock outcrops. The channel slopes are relatively steep and increase in the downstream direction. Together this results in an increase in subsurface transmissivity in the downstream direction that outweighs the influence of the increased upslope contributing area on the occurrence of surface flow. This explains the dominance of the dry streambed state and the poor correlation between flowing water permanence and topography in this part of the catchment, as well as the top-down wetting pattern during events. The relatively low dry streambed permanence (27%) at monitoring location 7 can be attributed to the large upslope contributing area relative to that for the other monitoring locations in the fault zone. At monitoring location 14, located just below the upper edge of the fault zone, the dry streambed state was absent. Possibly, the subsurface transmissivity at this location is comparable to that just above the fault zone. This would explain why the permanence of the hydrological states for monitoring location 14 were more in line with the monitoring locations just above the fault zone.
The conceptual model does not specifically address the persistence of standing water. Our results show that for most stream monitoring locations outside the fault zone, standing water persisted after flow ceased. This suggests that the strong negative correlation of the standing water permanence with the local TWI and upslope contributing area, and the strong positive correlation with the channel slope, can be attributed to the strong positive correlations of the flowing water permanence with the local TWI and upslope contributing area, and the strong negative correlation with the channel slope. To assess the influence of the site characteristics on the persistence of standing water, we have to look at the monitoring locations close to the stream heads. Several of these monitoring locations experienced a dry streambed, while at the others standing water persisted. The monitoring locations that experienced a dry streambed generally had a higher bankfull width to depth ratio and coarser dominant bed material than the monitoring locations where standing water persisted. Interestingly, however, the local TWI and the flowing water permanence was often also higher for the monitoring locations that experienced a dry streambed. This indicates that the local channel morphology and the size of the bed material are particularly important for the persistence of standing water, more so than for the persistence of flowing water, and, therefore, that these site characteristics are more able to override the influence of topography on the permanence of standing water than on the permanence of flowing water.
4.2 Temporal Variation in Wetness Thresholds
While the order of the state changes was similar for the different precipitation events, the wetness threshold values for the state changes varied between events. This implies that the event characteristics influenced the timing of the state changes during and following events, but rarely changed the order of the state changes across the stream network.
The P threshold for the state changes during precipitation events (i.e., D-S and S-F) was generally strongly negatively correlated to the ASI. This suggests that a larger amount of precipitation was needed for a state change to occur when the soils in the catchment were dry prior to an event. The larger amount of precipitation is needed to overcome the storage deficit, increase groundwater levels and establish a hydrological connection between the hillslopes and streams (cf. Detty and McGuire 2010; Penna et al. 2011). Several studies with a two-state (wet/dry or flow/no flow) approach have described a similar influence of antecedent soil moisture conditions on the timing of state changes during events (Goulsbra, Evans, and Lindsay 2014; Jensen et al. 2019; Perez et al. 2020; Zimmermann et al. 2014).
The SI threshold was generally strongly negatively correlated to the P intensity. This implies that state changes occurred at a lower soil moisture level when the precipitation was more intense. Precipitation intensity has been shown to be an important control on the timing of state changes in a handful of other studies as well (Durighetto et al. 2020; Welter and Fisher 2016; Zimmermann et al. 2014). Higher intensity precipitation can promote overland flow and biomat flow, which reaches the stream more quickly than subsurface flow. Once the precipitation and these flow paths cease, the state can change back rapidly as well. Overland flow and biomat flow have been observed in the upper Studibach catchment and their occurrence was linked to precipitation intensity (van Meerveld et al. 2018).
The DP threshold for the state changes following precipitation events (i.e., F-S and S-D) was generally strongly positively correlated to the P surplus. This indicates that it took a longer time without precipitation for a state to change back when a larger amount of precipitation fell after the initial state change (i.e., D-S or S-F). A large amount of (surplus) precipitation will cause groundwater levels on the hillslopes to increase and groundwater source areas to expand (Rinderer, van Meerveld, and McGlynn 2019), and, thus, increases the hydrological connectivity between the hillslopes and streams. As a result, groundwater flow towards the streams and, therefore, surface water and flow in the streams will persist longer. A number of studies have found a comparable relation between the amount of precipitation that falls during an event and the timing of state changes following events (Costigan, Daniels, and Dodds 2015; Peirce and Lindsay 2015; Welter and Fisher 2016; Zimmermann et al. 2014).
These findings, combined with the strong correlation between the wetness thresholds and the topographic site characteristics, suggest that water balance models that track soil moisture storage (and thus SI and ASI) can be used together with precipitation data (to determine the P amount, P intensity, and DP length) to predict the timing of state changes for any location in the catchment outside the fault zone. They also suggests that models that take the temporal variation in the wetness threshold values into account will work better than models based on a single threshold value (e.g., models that only use a single P threshold, without accounting for the ASI). These types of data driven topography-based models can then be used to simulate stream network expansion and contraction with the three main hydrological states (cf. Botter and Durighetto 2020; Bujak-Ozga et al. 2023; Durighetto et al. 2022 for two states), and to predict the location of stream habitats across the catchment (but this is out of the scope of this study).
4.3 The Value of Monitoring the Three Main Hydrological States
Two-state (wet/dry or flow/no flow) monitoring approaches have been very useful in characterising stream network expansion and contraction and identifying related drivers. However, monitoring the three main hydrological states allows for a more detailed characterisation of the temporary stream dynamics because it permits the standing water state to be considered separately. This is particularly important in catchments where pools are common, such as at our study site.
If we would have used a monitoring setup that only allowed for the distinction between wet and dry states (cf. Constantz et al. 2001; Jaeger and Olden 2012; Jensen et al. 2019; Peirce and Lindsay 2015; Sando and Blasch 2015), we would not have observed any variation in the state for 12 of the 17 stream monitoring locations outside the fault zone that experienced a state change during the monitoring period, because for these 12 monitoring locations the state only alternated between standing water and flowing water. For the other five monitoring locations, 61% of the state changes would not have been observed. For the monitoring locations in the fault zone that experienced a state change during the monitoring period, 41% of the state changes would not have been observed. As a result, we would have severely underestimated the spatial and temporal variation in the state of the streams in the catchment, and, therefore, the influence of site and event characteristics would have been less clear. More specifically, there would have been no strong correlation between the state permanence or the wetness thresholds for state changes and any of the site characteristics for the monitoring locations outside the fault zone. Furthermore, it would not have been possible to identify the bottom-up wetting pattern outside the fault zone during precipitation events or the reverse pattern following events. It would also not have been possible to determine the correlations between wetness thresholds and event characteristics for any of the monitoring locations outside the fault zone, except for monitoring locations 24 and 28.
If we would have used a monitoring setup that only allowed for the distinction between flow and no flow states (cf. Goulsbra, Evans, and Lindsay 2014; McDonough et al. 2015; Paillex et al. 2020), more variation in the state would have been observed because at most stream monitoring locations the two dominant states were either standing water and flowing water or dry streambed and flowing water. However, this setup is less suitable for monitoring the variation in the state during drier summer months, when the two dominant states for a large part of the stream network are dry streambed and standing water.
4.4 The Value of High Temporal Resolution State Data
Some agencies, such as the Environment Agency in the United Kingdom (Eastman et al. 2021; Sefton et al. 2019) and the French Biodiversity Agency (Onde Network) monitor the three main hydrological states for temporary streams. Their data are collected during field surveys at intervals ranging from weeks to months. Similarly, the aerial photographs, images from Google Street View and interviews with inhabitants by Gallart et al. (2017) provide low temporal resolution data of the three hydrological states. These data are useful when characterising larger, less responsive temporary streams, or if the temporary character of a stream is seasonal.
High temporal resolution state data is especially useful when characterising temporary streams in headwater catchments, such as at our study site, where streams are dynamic and responsive. For most of the stream monitoring locations, the least dominant state(s) (e.g., the standing water and flowing water states for the monitoring locations in the fault zone) only lasted for several hours to a few days. Therefore, if we had monitored the hydrological states at a weekly resolution (e.g., every Monday), we would not have observed any state change for 10 of the 25 monitoring locations that experienced a state change during the monitoring period. For the other 15 monitoring locations, more than 75% of the state changes would not have been observed. In addition to the reduced temporal variation in the state of the streams in the catchment, we would, therefore, have observed less spatial variation in the state. This would have substantially decreased the strength of the correlations with the site characteristics and thus made the influence of the site characteristics less clear. More importantly, low temporal resolution state data would not have allowed us to determine the order of the state changes during and following precipitation events, nor the spatial and temporal variation in wetness thresholds and their relation with site and event characteristics.
5 Conclusions
In this study, a network of multi-sensor monitoring systems was used to collect high spatiotemporal resolution data of the three main hydrological states of temporary (i.e., non-perennial) streams across a small pre-Alpine headwater catchment in Switzerland. The data were used to characterise the temporary stream dynamics in the catchment.
The streams in the upper part of the catchment were mostly in the standing water state but further downstream, the streams were more often in the flowing water state. In the fault zone, the dry streambed state was dominant. The general wetting pattern during precipitation events (i.e., the order of the state changes from a dry streambed to standing water and from standing water to flowing water) was a bottom-up pattern outside the fault zone and a top-down pattern in the fault zone. The general drying pattern following events (i.e., the order of the state changes from flowing water to standing water and from standing water to a dry streambed) was the reverse of the wetting pattern. The persistent order of the state changes across the stream network was reflected in the spatial variation in the precipitation and soil moisture storage thresholds for the state changes during events, and the dry period and soil moisture storage thresholds for the state changes following events. Although the temporal variation in the values of these wetness thresholds for the different events were strongly influenced by the antecedent soil moisture storage, precipitation intensity and precipitation surplus, these event characteristics rarely influenced the order of the state changes.
The spatial variation in the permanence of the hydrological states and the wetness threshold values for the stream monitoring locations outside the fault zone was strongly correlated to the topography, more specifically the local Topographic Wetness Index, channel slope and upslope contributing area. However, for the monitoring locations in the fault zone, the losing stream conditions due to the relatively steep channel slopes, coarse bed material and fractured rock outcrops in the streams overrode the effect of the topography. The persistence of standing water near the stream heads was influenced by the local channel morphology and the size of the bed material.
This study thus highlights the influence of topography, geology, channel morphology, and event characteristics on the variation of the three main hydrological states of temporary streams. Moreover, it highlights the value of monitoring all three states and the collection of high temporal resolution state data, especially in catchments where pools are common and the streams are dynamic and responsive. A monitoring setup that only allowed for the distinction between wet and dry states would not have captured any variation in the state for the large number of stream monitoring locations for which the state only alternated between standing water and flowing water. Low temporal resolution state data (e.g., weekly) would have captured only a fraction of all state changes during the monitoring period because for most monitoring locations the least dominant state(s) only lasted for a relatively short period. As a result, the temporary stream dynamics in the catchment would have been severely underestimated and, therefore, the influence of the site and event characteristics would have been less clear.
Acknowledgements
The authors would like to thank Oskar Sjöberg for his help with the initial stream mapping and Leonie Kiewiet and Kirsti Hakala for their support in the field. This research was funded by the Swiss National Science Foundation, grant number 159254 (project StreamEC: Stream network expansion and contraction - patterns, controls and importance). Open access publishing facilitated by The University of Melbourne, as part of the Wiley - The University of Melbourne agreement via the Council of Australian University Librarians.
Open Research
Data Availability Statement
The data that support the findings of this study are available from the corresponding author upon reasonable request.


