The effect of hedgerow wild-margins on topsoil hydraulic properties, and overland-flow incidence, magnitude and water-quality
Abstract
Overland and shallow-subsurface flows from agricultural catchments are believed to contribute towards flood-risk and water-quality degradation across the globe. Hedgerows are commonplace agricultural features that may disrupt these rapid hydrological pathways. Research into the hydrological functioning of hedgerows is very limited however, with no field-based quantitative comparison of overland-flows within hedgerows versus other land-uses. This research is the first globally to observe changes in overland-flow incidence, volume and water-quality, alongside topsoil hydraulic and physico-chemical properties, induced by a hedgerow and adjoining wild-margin within a grassland landscape. Observations were conducted within two replicated paired-plots between a hedgerow wild-margin and a bordering pasture, within Cumbria, UK. Compared to adjacent pasture, hedge-margins significantly reduced topsoil dry bulk-density and increased porosity, and significantly increased the topsoil median permeability by a factor of 22–27. Overland-flow models, based on direct observations, highlight that hedge-margins are slower to produce overland-flows than pastures, requiring an equal or greater amount of saturation before the onset of overland-flow generation. Hedge-margins resultantly produced less overland-flow volume, likely due to increased infiltration, percolation and/or evapotranspiration. Soil saturation models, also based on direct observations, confirm pastures saturate faster than hedge-margins, with hedge-margins having extremely variable dynamics in relation to precipitation, whereas pastures have more moderate and consistent dynamics. Overland-flow water-quality from ‘wash-off’ experiments highlight that hedge-margins may store substantially more nitrate (70–260%), nitrate-nitrite (640–650%), and loose sediment (540–3970%) on the ground surface compared to pastures; although further experimentation is needed to determine contaminant mobilization potential.
Abbreviations
-
- P1
-
- agriculturally-improved pasture plot one
-
- P2
-
- agriculturally-improved pasture plot two
-
- AIP
-
- agriculturally-improved pasture
-
- DOC
-
- dissolved organic carbon
-
- DTP
-
- dissolved total phosphorus
-
- M1
-
- Hedgerow wild-margin plot one
-
- M2
-
- Hedgerow wild-margin plot two
-
- HWM
-
- Hedgerow wild-margin
-
- OFP
-
- overland-flow plot
-
- PTP
-
- particulate total phosphorus
-
- δ
-
- pure time-delay
-
- RIV
-
- refined instrumental variable
-
- Ksat
-
- saturated hydraulic conductivity
-
- ρb
-
- soil dry bulk-density
-
- η
-
- soil porosity
-
- θv
-
- soil volumetric wetness
-
- SRP
-
- soluble reactive phosphorus
-
- SSG
-
- steady-state-gain
-
- YIC
-
- Young's Information Criterion
1 INTRODUCTION
Hedgerows are commonplace landscape features that provide a wide range of ecosystem and agricultural services (Baudry, Bunce, & Burel, 2000; Blanuša, Garratt, Cathcart-James, Hunt, & Cameron, 2019; Wolton, Pollard, Goodwin, & Norton, 2014). Post Second World War agricultural mechanization, alongside land consolidation and occasional land abandonment, has lowered the prevalence of managed hedgerows throughout Western Europe (Arnaiz-Schmitz, Herrero-Jáuregui, & Schmitz, 2018; Burel & Baudry, 1990; Deckers, Kerselaers, Gulinck, Muys, & Hermy, 2005; Petit, Stuart, Gillespie, & Barr, 2003; Sánchez, Lassaletta, McCollin, & Bunce, 2009; van Apeldoorn, Kempen, Sonneveld, & Kok, 2013), and indeed further afield (Schmucki, de Blois, Bouchard, & Domon, 2002; Sklenicka et al., 2009). In 1945, England and Wales contained approximately 1.4 million km of hedgerows, with the latest 2007 estimate at 456000 km (Carey et al., 2008; O'Connell et al., 2004).
Hedgerow removal within temperate climates of Europe has been associated perceptually with increasing flood frequency and magnitude, but very limited experimental evidence shows the moderating effect of hedgerows on flood-generation processes or water-quality (Wolton et al., 2014). Consequentially, the understanding of the hydrological functioning of hedgerows remains incomplete and requires greater attention (Table S1: Carluer & De Marsily, 2004), with the current state of knowledge summarized below:
1.1 Wet-canopy evaporation and transpiration of hedgerows
Hedgerows support enhanced evapotranspiration due to extensive root networks which enables considerable water-uptake, low stomatal resistance to facilitate transpiration, naturally low albedo causing high net-radiation, intensive air turbulence that supports air exchanges, and dense foliage to encourage wet-canopy evaporation (Ghazavi et al., 2008; Grimaldi, Fossey, Thomas, Fauvel, & Mérot, 2012; Herbst, Roberts, Rosier, & Gowing, 2007; Ryszkowski & Kędziora, 1987, 1993). Within Western France, Ghazavi et al. (2008) quantified hedgerow trees to intercept 2.4% of rainfall without foliage, and 5.6% when in leaf. Within Southern England, Herbst, Roberts, Rosier, and Gowing (2006) quantified hedgerow interception storage as 2.6 mm when leaved, and 1.2 mm when leafless, an amount comparable to many forest types. Herbst et al. (2006) additionally quantified hedgerow wet-canopy evaporation at 24% with foliage, and 19% when leafless. Further, Herbst et al. (2007) showed that unit-area hedgerow transpiration rates in Southern England are higher than many temperate woodlands. In a modelling study within Western France, Benhamou, Salmon-Monviola, Durand, Grimaldi, and Mérot (2013) simulated hedgerow trees to increase grid-scale (20 m2) evapotranspiration by 20%, with a lightly-hedged scenario increasing catchment-scale (5 km2) evapotranspiration by 3.3%.
1.2 Effect of hedgerows on streamflow
Prior studies (all in Western France) suggest that hedgerows/hedgerow trees may affect flood-risk and discharge at the micro/small-catchment scale. In a paired-catchment study (each 0.32 km2), Mérot (1978), cited in Mérot (1999), concluded that a hedged catchment could reduce peak flows by 33–50%, and runoff coefficients from 15 to 5%, compared to an unhedged adjacent catchment. Viaud, Durand, Mérot, Sauboua, and Saadi (2005) employed a water-balance modelling approach for a 5 km2 catchment, outlining that a heavily-hedged catchment (200 m/ha) could halve discharge compared to a hedgeless catchment in drier years. Benhamou et al. (2013) modelled a 5 km2 catchment with and without 1.5% hedgerow cover, highlighting that hedgerows could lower channel discharges by 4.5%. Within three 15 km2 catchments, Viel, Delahaye, and Reulier (2014) using a ‘hydrological connectivity model’, suggested that despite high hedgerow density, slopes may not be fully-partitioned and may still be hydrologically connected, although hedgerows could potentially store or direct overland-flow into the soil.
1.3 Effect of hedgerows on soil drying
Hedgerow roots can range 10 m beyond their peripheries and at considerable depths (Caubel, Grimaldi, Mérot, & Grimaldi, 2003; Caubel-Forget, Grimaldi, & Rouault, 2001; Ghazavi et al., 2008). This expansive root network enables substantial water-uptake to support transpiration, and can cause localized soil drying (Albéric, Vennink, Cornu, Bourennane, & Bruand, 2009; Hao et al., 2014; Thomas, Ghazavi, Mérot, & Granier, 2012; Thomas, Molénat, Caubel, Grimaldi, & Mérot, 2008). If situated close to the water-table, roots can constantly access water, facilitating enhanced transpiration (Thomas et al., 2008, 2012).
Root water-uptake by the hedgerow dries the soil in spring and summer, possibly delaying autumnal rewetting (Caubel et al., 2003; Ghazavi et al., 2008; Ghazavi, Thomas, Hamon, & Mérot, 2011). Hedgerow-induced soil dryness may impede shallow-subsurface flow, reducing slope connectivity and increasing pollutant residence-times (Ghazavi et al., 2008, 2011). Utilizing the Kirkby Topographic Index (Beven & Kirkby, 1979), Mérot and Bruneau (1993) showed that hedgerow banks may influence the distribution of saturated areas.
1.4 Effect of hedgerows on water-quality
Several studies throughout France have suggested hedgerows may influence local soil hydrochemistry. Comparing hedgerows to pastures, Albéric et al. (2009) highlights soil-water beneath hedgerows to contain higher concentrations of major ions; likely caused by drying cycles and a lack of dilution from precipitation. Grimaldi, Thomas, Fossey, Fauvel, and Mérot (2009) similarly highlight soil-water beneath hedgerows contain higher chloride concentrations due to soil drying.
Hedgerows can strongly influence the distribution of nitrates within groundwaters (Caubel-Forget et al., 2001; Thomas & Abbott, 2018). Hedgerows are highly effective at nitrate removal from shallow groundwater when compared with pasture vegetation or arable crops, and could potentially ameliorate groundwater contamination and transport to streams (Caubel-Forget et al., 2001; Grimaldi et al., 2012; Thomas & Abbott, 2018). Effective nitrate removal is augmented by a combination of plant water-uptake, and denitrification due to increased organic carbon, heterogeneous redox conditions, and heightened microbial processes (Caubel-Forget et al., 2001; Grimaldi et al., 2012; Thomas & Abbott, 2018). Furthermore, Thomas, Abbott, Troccaz, Baudry, and Pinay (2016) demonstrate how hedgerow density influences stream hydrochemistry and nitrate fluxes within three headwater catchments in Western France (2.3–10.8 km2). Benhamou et al. (2013) modelled a potential 3.3% drop in streamflow NO3-N due to the hedgerow presence.
1.5 Effect of hedgerows on surface hydrology
Despite these studies, substantial knowledge gaps remain around the hydrological functioning of hedgerows within temperate regions, with quantitative studies particularly lacking (Table S1: Blanuša & Hadley, 2019; Hao et al., 2014; Holden et al., 2019; Wolton et al., 2014). A significant component of this is how hedgerows influence surface and near-surface hydrology, including infiltration-capacity, overland-flow and water-quality. Carluer and De Marsily (2004) hypothesise that hedgerows could significantly increase infiltration, although highlight a lack of observations to support this assumption and subsequent modelling. Thomas et al. (2008) similarly acknowledge the lack of data regarding how hedgerows alter hydraulic conductivities.
Holden et al. (2019) is the only study to directly measure hedgerow topsoil permeability, noting a hedgerow in North Yorkshire, UK, was significantly more permeable than nearby pasture or arable fields (Table S1). Likewise, Blanuša and Hadley (2019) are the first to demonstrate that common temperate hedgerow species such as Hawthorn (Crataegus monogyna) significantly delay and reduce runoff in plant-pot and model trench experiments (Table S1). These studies underline that no field-based observations exist regarding how hedgerows alter overland-flow, with this information dearth substantially hindering modelling studies, and consequentially limiting the hydrological understanding of hedgerows.
- To compare soil and topographic properties that may influence the topsoil saturated hydraulic conductivity, moisture status, and overland-flow occurrence between permanent pasture plots and plots in an adjacent hedgerow wild-margin.
- To contrast the measured topsoil saturated hydraulic conductivities between the two aforementioned land-uses.
- To compare the incidence and magnitude of overland-flow produced from natural precipitation events between the two aforementioned land-uses.
- To compare the hydrological response of the two aforementioned land-uses to an artificial-rainfall experiment in relation to soil moisture, surface hydrological pathways and overland-flow incidence and magnitude.
- To compare the water-quality of overland-flow produced from the two aforementioned land-uses following a ‘wash-off’ experiment.
2 MATERIALS AND METHODS
2.1 Study site
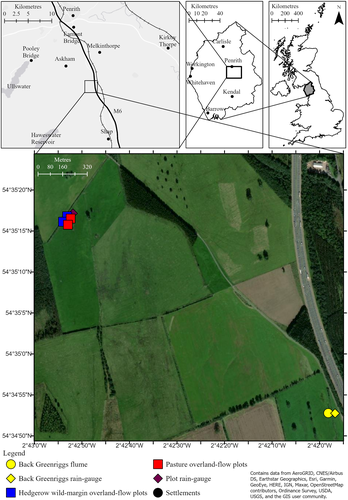
A study site (centre 54°35′16.38″N, 2°42′53.43″W) was established in the River Leith catchment (Cumbria, UK), 8 km SSE of Penrith and 7 km NNW of Shap (Figure 1). The local climate from Shap weather station (54°30′49″N, 2°40′40″W: 301 masl) is wet temperate, with annual average maximum and minimum temperatures of 11. 5 and 4.1°C, respectfully, and a long-term (1981–2010) annual rainfall average of 1779 mm (Met Office, 2020). Average potential evapotranspiration for the experimental site (1981–2010) is 1.29 mm/d, with a summer average of 2.43 mm/d and a winter average of 0.33 mm/d (Robinson et al., 2016).
The study site belongs to the 713 g Brickfield soil-series, equivalent to an FAO Eutric Stagnosol, or an Aquic soil within USDA soil taxonomy (Jarvis et al., 1984; USDA, 1999; WRB, 2015). Brickfield soils are slowly permeable with clay subsurface horizons impeding drainage (wetness class IV/V), increasing overland and shallow-surface flow susceptibility (Jarvis et al., 1984). The soil profile is developed from slowly permeable glacial drift (Hankin et al., 2018). The solid geology beneath the site is the Yoredale Group (Alston Formation), consisting of bioclastic limestone, mudstone, siltstone and sandstone (Arthurton & Wadje, 1981).
2.2 Plot-pairing
The study site comprises two replicated paired-plots spanning an agriculturally-improved pasture and an adjacent uncultivated hedgerow wild-margin, running perpendicular with the hillslope contours (Figure 2). The two agriculturally-improved pasture (AIP) replicates are termed pasture plot one (P1) and pasture plot two (P2). Plots P1 and P2 are perennial ryegrass (Lolium perenne) monocultures, with a root mat extending 3–6 cm below the surface. Some stinging nettle (Urtica dioica) is well-established within P1. During the study the permanent pasture was stocked with ewes (approximately 6 ha−1), lambs (approximately 11 ha−1), and occasionally heifer beef cattle (approximately 1 ha−1), averaging approximately 1.8 livestock units ha−1. Intensive agricultural practices were previously applied to AIP (ploughing, slurrying, reseeding etc.), although none have occurred since August 2018.
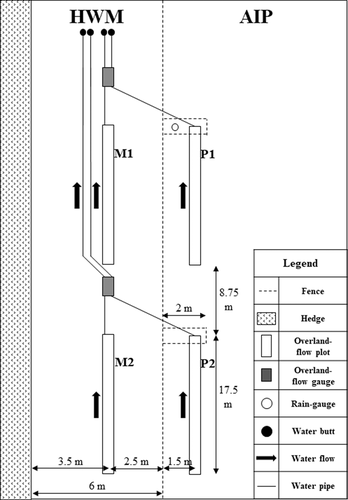
The hedgerow wild-margin (HWM) comprises the alternate plots. HWM includes a hedgerow planted in 2003, consisting of 50% hawthorn, 40% blackthorn (Prunus spinosa), with the remainder mostly dog rose (Rosa canina) and hazel (Corylus avellana), as well as an adjacent 6-m wide wild-margin (grazing exclusion zone) which was fenced off from the pasture. This wild-margin was sparsely planted with trees in 2013 as part of an environmental higher-level stewardship agreement.
The first HWM replicate is wild-margin plot one (M1) which has a 0.6–0.9 m scrub layer of perennial ryegrass, stinging nettle, and various brambles (Rubus spp.). Two immature hazel trees are directly within M1, with an immature hazel and an immature holly (Ilex aquifolium) immediately adjacent. Wild-margin plot two (M2) has a very dense 1.2−1.5 m scrub layer of stinging nettle, brambles, creeping thistle (Cirsium arvense), and immature blackthorn. Directly within M2 are three mature blackthorn trees and one mature hawthorn tree. Immediately adjacent to M2 are sixteen mature blackthorn trees, one immature hazel and one immature oak (Quercus robur).
Paired-plots are separated by approximately 4 m across the slope, with AIP plots positioned 1.5 m into the pasture and HWM plots positioned 2.5 m into the hedgerow wild-margin (Figure 2). The HWM plots are located approximately 3.5 m from the hedgerow. Upper and lower plots are separated by 8.75 m.
2.3 Overland-flow plots
Four replicated overland-flow plots (OFPs) were established within AIP and HWM (Figure 2). Each OFP involved embedding 30 cm of galvanized steel lawn edging in a 17.5 m by 0.5 m rectangle (8.75 m2), with 5 cm remaining above the surface to retain overland-flow. At the terminus of each OFP, a 0.5 m wide ‘Gerlach (collection)-trough’ was installed to collect overland-flow (Gerlach, 1967). The trough lip was hammered into the topsoil to 8 cm depth (just below observable root mats) to ensure all overland-flow was captured. Specifically, the OFPs capture both overland-flow (i.e., water flowing across the soil surface and within the litter-layer), as well as near-surface lateral flows within the topsoil. Collection-troughs were sealed with Montmorillionite clay to prevent leakage and each AIP trough was fenced off for protection. Care was taken during installation to avoid plot disturbance.
The collection-troughs were connected to a gravity-fed underground pipe network (4 cm diameter) to funnel overland-flow into enclosures buried within HWM. Each enclosure contained two KIPP100 tipping-bucket counters (METER group), each having a 100 cm3 tip volume. The tipping-bucket counters were connected to a H21 HOBO datalogger (Onset computer corporation) to record the timing of each tip. Pipes exit the enclosures into four sealed water butts for subsequent water-quality analyses. To ensure no leakage (or addition) of water, known volumes of deionized water were passed through the system.
The overland-flow gauges recorded the incidence and volume of overland-flow between 10th April 2019–10th March 2020. A rain-gauge 2 km to the South-East (Back Greenriggs rain-gauge) provided precipitation data, with a plot rain-gauge providing supplementary precipitation data between 10th April 2019–7th February 2020 before equipment malfunction (Figure 1; Figure S1).
2.4 Artificial-rainfall experiment
Standardized, artificial-rainfall experiments were conducted on the 11th (P1 and M1) and the 15th April 2019 (P2 and M2). Prior to each experiment, the collection system was flushed with deionized water and electrical conductivity tests confirmed no contaminants remained in the collection network. Each experiment involved a laboratory-made rainfall generator that delivered a constant 22.5 mm/hr rainfall intensity. This rainfall intensity is marginally above the maximum observed precipitation intensity from a local rainfall record (21.2 mm/hr: see Wallace & Chappell, 2019), and is therefore plausible for extreme conditions at this locality.
Immediately upslope of the collection-troughs, 1 m2 of each OFP was enclosed with the rainfall-generator positioned centrally. The artificial-rainfall experiment ran for two consecutive hours in an attempt to generate overland-flow. Throughout the experiment, a simplified Time-Domain Reflectometer probe (Delta Ltd ML3 Theta-probe: Gaskin & Miller, 1996) was positioned centrally 10 cm upslope of the collection-trough, to quantify volumetric wetness over the surface 0–6 cm of the litter layer and upper topsoil (θv: and by combining with porosity the degree of saturation), and therefore the likelihood of saturation-excess overland-flow incidence. The moisture-probe was additionally used to assist in the identification of near-surface hydrological pathways, and therefore to improve the understanding of the saturation process(es) occurring between treatments prior to overland-flow generation.
The goal of the artificial-rainfall experiment was: (a) to determine if infiltration-excess overland-flow could be generated from each OFP at plausible precipitation intensities, (b) to quantify at what degree of saturation did overland-flow occur from each OFP (possibly highlighting saturation-excess overland-flow when combined with porosities), and (c) to determine the required elapsed time of extreme rainfall before overland-flow occurred from each OFP given the naturally variable baseline conditions. The tipping-bucket counters would also record the volumes of overland-flow.
2.5 Wash-off experiment
Following each artificial-rainfall experiment, a ‘wash-off’ experiment was undertaken by applying a 20-L pulse of water in 30 s (2400 mm/hr) to generate overland-flow on the surface of each plot to transport potential contaminants from the plot surface into the collection system. This precipitation intensity is well beyond observed rates. The aim of the experiment was not to reproduce natural ‘wash-off’ events, but to show what contaminants are present on the plot surfaces.
Water-samples taken during the experiment underwent laboratory analysis for the determination of physico-chemical properties. Samples were stored in a cool-room from approximately 90 min after each experiment, with all chemical analysis conducted within 24 hr. Total sediment concentrations were determined by evaporating 750 ml of sample at 105°C and weighing the residue. Dissolved organic carbon (DOC) concentrations were estimated via ultraviolet–visible spectroscopy using a Jenway 7315 spectrophotometer, with absorbance at 254 and 400 nm (Tipping et al., 2009). Nitrate (NO3−), nitrate-nitrite (NO3− NO2−), soluble reactive phosphorus (SRP), dissolved total phosphorus (DTP) and particulate total phosphorus (PTP) were measured using a Seal AQ2 Discrete Analyzer. Electrical conductivity was measured on-site using a WTW 340i electrical conductivity meter.
2.6 Supporting hydrological, pedological and topographic measurements
Topsoil permeability measurements were taken surrounding the four OFPs on the 29th–30th April 2019. Permeability was determined via a Talsma ring permeameter (Chappell & Ternan, 1997; Talsma, 1960). The ring permeameter is a constant-head device that provides measurements of the coefficient of permeability, also known as the saturated hydraulic conductivity (Ksat). Permeability was determined via Darcy's law once equilibrium was attained (i.e., the core was fully saturated). The procedure detailed in Chappell and Ternan (1997) was followed exactly, except that measurements were conducted whilst cores remained in the ground to account for underlying soil properties (Sherlock, Chappell, & McDonnell, 2000; Wallace & Chappell, 2019).
To determine soil physico-chemical properties, topsoil surrounding the OFPs was extracted in 221 cm3 bulk-density cores on the 25th November 2019. Samples were sieved to 2 mm and oven-dried at 105°C for 24-hr for soil dry bulk-density (ρb) calculation. Organic matter content was determined from oven-dried soil via a 550°C 6-hr loss-on-ignition test. Particle-size analysis involved mixing furnace-dried soil with 1% sodium polymetaphosphate for 48-hr, followed by manual aggregate breaking. Samples then underwent high-power sonication for 5-min and laser diffraction (Beckman Coulter, LS-13-320). Porosity (η) determination involved gradually submerging each soil core with deionized and de-aired water over 48 hr, before measuring saturation with the moisture-probe. The topography of each OFP was measured using a total station (Trimble, Robotic-S6) to derive slope angles.
2.7 Statistical analysis and data-based mechanistic analysis
Soil properties (excluding texture) were contrasted via the Mann–Whitney-Wilcoxon test. The Mann–Whitney-Wilcoxon is a robust, non-parametric statistical test suited to small sample sizes (eight per plot), and was therefore deemed appropriate. To contrast Ksat values, permeability measurements first underwent Anderson-Darling and Shapiro–Wilk normality tests. Permeability distributions were then contrasted via the two-sample t-test due to satisfying normality assumptions, as well as the Mann–Whitney-Wilcoxon test due to limited and unequal sample sizes (minimum of seven per plot). All analysis was conducted within Matlab (The Mathsworks, Inc) using the ranksum, adtest, swtest (Bensaïda, 2019), and ttest functions, with significance levels of 0.05, 0.01, and 0.001.
A transfer-function modelling approach within the Data-Based Mechanistic framework was applied to both the artificial-rainfall experiment and the overland-flow response to natural-rainfall events (see Young, 2011). Transfer-functions—expressed as ratios of polynomials in complex variables—are a useful alternative form of differential or difference equation with linear dynamics. Their convenience comes from the ease of interpretation of the complex variables as either a Laplace operator (derivative in time-domain) or a backwards shift operator (easily expressing finite differences). Transfer-functions may be manipulated algebraically with several well-established methods of identifying their orders and estimating their parameters. As functions in the time-domain, they map an input data-series into the modelled response—the output data-series (see Appendix A).
During the artificial-rainfall experiments, rainfall (input) was used to predict the observed θv response (output). In these experiments, the artificial-rainfall failed to generate overland-flow, and thus, overland-flow could not act as system output. The transfer-function for each OFP during each experiment could be separated into different response components, which may represent different hydrological components (Chappell, Jones, Tych, & Krishnaswamy, 2017; Jones, Chappell, & Tych, 2014; Ockenden & Chappell, 2011).
Different streamflow-thresholds were required for each OFP to produce the best fitting models, highlighting that different levels of catchment-integrated saturation were necessary for overland-flow generation for each OFP. Stronger non-linearity suggests increased influence of streamflow on overland-flow production (Young & Beven, 1994). The ASI and non-linearity were then combined with the Back Greenriggs rainfall time-series to produce effective rainfall (i.e., rainfall that produced plot-scale overland-flow: see e.g., Kretzschmar, Tych, Chappell, & Beven, 2016). Sampling-lags (up to an hour) were included to incorporate the potential timing differences between OFP-response and the streamflow-response.
The Data-Based Mechanistic modelling philosophy makes no a priori assumptions about the system under analysis, and states that observations must dictate the identified structure of the modelled system processes (Young, 1999). The identified structures must however, have real-world interpretations and be feasible at the studied locality. Transfer-function models of the system's dynamics were identified and estimated using the Refined Instrumental Variable (RIV) functions within CAPTAIN (Computer Aided Program for Time-Series Analysis and Identification of Noisy systems) toolbox (Taylor, Pedregal, Young, & Tych, 2007), in either continuous or discrete-time, as appropriate (Young & Garnier, 2006; Young & Jakeman, 1979, 1980). At the model identification stage a range of different candidate model structures are evaluated, and the statistically optimal model selected according to a combination of model fit measured using Rt2 (a simplified Nash-Sutcliffe criterion), and Young's Information Criterion (YIC), an information criterion taking into account the residuals' form and a measure of variation coefficients of the estimated parameters (Appendix B; Young & Jakeman, 1979; Young, 2011). The main dynamic characteristics: Time-constants, pure time-delays (δs), and steady-state-gains (SSGs), of each identified component were extracted from the selected models (Chappell et al., 2017; Jones et al., 2014; Young, 2011).
3 RESULTS
3.1 Soil and topographic properties that may influence hydraulic properties
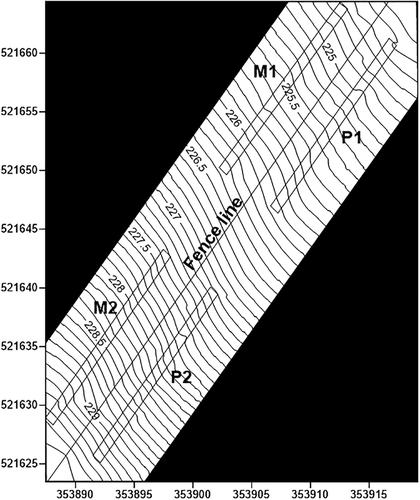
The topography for each OFP is given in Figure 3. Slopes for P1, M1, P2 and M2 are 8.9, 9.4, 13.1 and 12.6%, respectively. Slopes remain fairly-uniform throughout each OFP; although the upper plot-pairing is notably steeper than the lower plot-pairing.
All four soil profiles below OFPs lacked defined soil horizons, with topsoil properties given in Table 1. Plot P1 was 100% silt loam, whilst P2 was silty clay loam (62.5%) and silt loam (37.5%). Plot M1 was mostly silt loam (75%), with some loam (25%); whilst M2 was 100% silt loam. All OFPs have similar soil textures, although AIP contains slightly more clay and slightly less sand than HWM.
| Site | ρb (g/cm−3) | η (%) | OM (%) | pH | Particle size distribution (%) | N | ||||
|---|---|---|---|---|---|---|---|---|---|---|
| >2 μm | 2–20 μm | 20–60 μm | 60–200 μm | 200–2000 μm | ||||||
| Pasture plot 1 | 9.3 × 10⁻¹ (2.5 × 10⁻²) | 58.0 (0.2) | 10.4 (0.7) | 5.8 (0.1) | 16.7 (2.6) | 35.1 (6.5) | 27.6 (2.4) | 20.3 (8.7) | 0.3 (0.5) | 8 |
| Pasture plot 2 | 8.8 × 10⁻¹ (5.8 × 10⁻²) | 59.1 (0.2) | 11.5 (1.6) | 5.8 (0.3) | 27.8 (7.7) | 49.8 (7.3) | 17.0 (7.3) | 5.4 (7.3) | 0.0 (0.0) | 8 |
| Agriculturally Improved-Pasture | 9.0 × 10⁻¹ (5.1 × 10⁻²) | 58.5 (0.6) | 10.9 (1.3) | 5.8 (0.2) | 22.2 (8.0) | 42.4 (10.1) | 22.3 (7.6) | 12.8 (11.0) | 0.2 (0.4) | 16 |
| Wild-margin plot 1 | 5.6 × 10⁻¹ (1.1 × 10⁻¹) | 59.2 (0.2) | 16.5 (5.6) | 5.9 (0.3) | 13.8 (3.4) | 33.2 (9.5) | 26.0 (3.5) | 23.9 (10.2) | 3.1 (3.3) | 8 |
| Wild-margin plot 2 | 7.6 × 10⁻¹ (3.8 × 10⁻²) | 60.7 (0.4) | 14.8 (7.0) | 5.6 (0.2) | 16.8 (4.5) | 40.9 (13.0) | 25.1 (6.2) | 16.8 (12.3) | 0.5 (1.3) | 8 |
| Hedgerow Wild-Margin | 6.6 × 10⁻¹ (1.3 × 10⁻¹) | 59.9 (0.8) | 15.6 (6.2) | 5.7 (0.3) | 15.3 (4.1) | 37.0 (11.7) | 25.6 (4.9) | 20.3 (11.5) | 1.8 (2.8) | 16 |
Statistical tests of topsoil properties are given in Table 2. Soil ρb was significantly higher in AIP than HWM, overall and in both replicates (p ≤ .001). Pasture plots had statistically similar ρb (p ≤ .130), although wild-margin plots were statistically dissimilar (p ≤ .001). Soil η was significantly higher in HWM than AIP within both replicates and overall (p ≤ .001), with η significantly different between all plots (p ≤ .001). Organic matter content was significantly higher in HWM than AIP overall (p ≤ .001), and significantly higher in M1 compared to P1 (p ≤ .001), although statistically similar between P2 and M2 (p ≤ .328). Organic matter content between pasture plots was statistically different (p ≤ .050), although wild-margin plots were statistically similar (p ≤ .328). All plots had a statistically similar pH.
| Mann–Whitney Wilcoxon Tests | ||||
|---|---|---|---|---|
| Site | Pasture plot 1 | Wild-margin plot 1 | Wild-margin plot 2 | Hedgerow Wild-Margin |
| ρb | ||||
| Pasture plot 1 | - | 0.001c | ||
| Pasture plot 2 | 0.130 | 0.001c | ||
| Agriculturally-Improved Pasture | 0.001c | |||
| Wild-margin plot 2 | 0.001c | - | ||
| η | ||||
| Pasture plot 1 | - | 0.001c | ||
| Pasture plot 2 | 0.001c | 0.001c | ||
| Agriculturally-Improved Pasture | 0.001c | |||
| Wild-margin plot 2 | 0.001c | - | ||
| OM | ||||
| Pasture plot 1 | - | 0.001c | ||
| Pasture plot 2 | 0.050a | 0.328 | ||
| Agriculturally-Improved Pasture | 0.001c | |||
| Wild-margin plot 2 | 0.328 | - | ||
| pH | ||||
| Pasture plot 1 | - | 0.590 | ||
| Pasture plot 2 | 0.898 | 0.205 | ||
| Agriculturally-Improved Pasture | 0.157 | |||
| Wild-margin plot 2 | 0.195 | - | ||
| Ksat | ||||
| Pasture plot 1 | - | 0.001c | ||
| Pasture plot 2 | 0.613 | 0.001c | ||
| Agriculturally-Improved Pasture | 0.001c | |||
| Wild-margin plot 2 | 0.955 | - | ||
| Two sample t test | ||||
|---|---|---|---|---|
| Site | Pasture plot 1 | Wild-margin plot 1 | Wild-margin plot 2 | Hedgerow Wild-Margin |
| Ksat | ||||
| Pasture plot 1 | - | 0.001c | ||
| Pasture plot 2 | 0.002b | |||
| Agriculturally-Improved Pasture | 0.001c | |||
- a Significant at the 0.05 significance level.
- b Significant at the 0.01 significance level.
- c Significant at the 0.001 significance level.
3.2 Topsoil permeability
Statistical normality tests highlight Ksat surrounding the OFPs satisfy normality (Table 3). Mann–Whitney-Wilcoxon and two-sample t tests (Table 2) highlight the topsoil surrounding wild-margin OFPs is significantly more permeable than by the pasture OFPs (least significant result ρ ≤ 0.002). Median Ksat is 2700% larger in M1 than P1, and 2200% larger in M2 than P2 (Table 3). Pasture plots have similar Ksat (ρ ≤ 0.613), as do the wild-margins (ρ ≤ 0.995).
| Parameter | P1 | M1a | P2 | M2a | P1:M1 ratio | P2:M2 ratio | P1:P2 ratio | M1:M2 ratio |
|---|---|---|---|---|---|---|---|---|
| Ksat geometric mean (mm/hr) | 3.43 × 10² | 7.65 × 10³ | 2.82 × 10² | 7.64 × 10³ | 1:22.3 | 1:27.1 | 1:0.822 | 1:1.00 |
| Ksat arithmetic mean (mm/hr) | 4.09 × 10² | 8.72 × 10³ | 3.18 × 10² | 8.46 × 10³ | 1:21.3 | 1:26.6 | 1:0.778 | 1:0.970 |
| Ksat median (mm/hr) | 3.17 × 10² | 8.78 × 10³ | 3.24 × 10² | 7.29 × 10³ | 1:27.7 | 1:22.5 | 1:1.02 | 1:0.830 |
| Ksat minimum (mm/hr) | 1.68 × 10² | 3.27 × 10³ | 1.19 × 10² | 4.02 × 10³ | 1:19.5 | 1:33.8 | 1:0.708 | 1:1.23 |
| Ksat maximum (mm/hr) | 8.92 × 10² | 1.78 × 10⁴ | 4.75 × 10² | 1.35 × 10⁴ | 1:20.0 | 1:28.4 | 1:0.533 | 1:0.758 |
| σ (mm/hr) | 2.63 × 10² | 4.57 × 10³ | 1.42 × 10² | 3.98 × 10³ | 1:17.4 | 1:28.0 | 1:0.540 | 1:0.871 |
| CoV. (%) | 64.2 | 52.4 | 44.8 | 47.0 | 1:0.816 | 1:1.05 | 1:0.698 | 1:0.897 |
| N | 8 | 8 | 7 | 7 | 1:1 | 1:1 | 1:0.875 | 1:0.875 |
| AD (ρ) | 0.229 | 0.309 | 0.229 | 0.252 | NA | NA | NA | NA |
| SW (ρ) | 0.178 | 0.223 | 0.201 | 0.207 | NA | NA | NA | NA |
- a Due to the rapid emptying of the permeameter, and potential violation of Darcy's Law, these are approximate values only.
3.3 Overland-flow generated by natural precipitation events
Between 10th April 2019–10th March 2020, the Back Greenriggs rain-gauge recorded 1357 mm of rainfall (Figure 4). The maximum 5-min rainfall-intensity during monitoring was 5.6 mm (equivalent to 67.2 mm/hr). In November 2019, the P2 plot was damaged by agricultural traffic, and thus, overland-flow results after this date have been excluded for this plot.
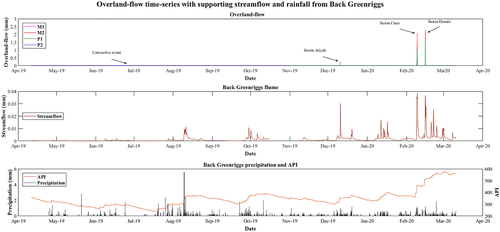
Only four overland-flow events were generated during the whole monitoring period (Figure 5: Table S2). The first event occurred on the 24th June 2019, and produced a small amount of overland-flow in a single 5-min period from P2, M1 and M2. The three-remaining overland-flow events occurred on 10th December 2019 (following Storm Atiyah, classified in the United Kingdom), 8th–9th February 2020 (Storm Ciara), and 15th–16th February 2020 (Storm Dennis). The latter three storms produced hydrographs suitable for transfer-function modelling with the Back Greenriggs rain-gauge.
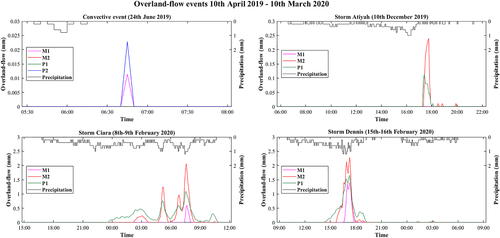
Storm Atiyah produced 38 mm of rainfall, which generated 0.57 mm (1.5% of rainfall), 0.00 mm (0% of rainfall) and 1.10 mm (2.9% of rainfall) of overland-flow from plots P1, M1 and M2, respectively. Storm Ciara produced 98.2 mm of rainfall, which generated 37.63 mm (38.3% of rainfall), 2.45 mm (2.5% of rainfall) and 27.52 mm (28% of rainfall) of overland-flow from plots P1, M1 and M2, respectively. Storm Dennis produced 67.6 mm of rainfall, which generated 31.68 mm (46.9% of rainfall), 11.21 mm (16.6% of rainfall) and 27.51 mm (40.7% of rainfall) of overland-flow from plots P1, M1 and M2, respectively. Over the whole 11-month record, overland-flow in P1 amounted to 5.2% of total rainfall, while the adjacent hedge-margin plot (M1) produced a much smaller 1% of total rainfall. Overland-flow in the wild-margin plot further upslope (M2) accounted for 4.1% of total rainfall.
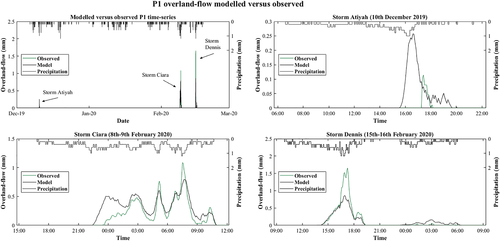
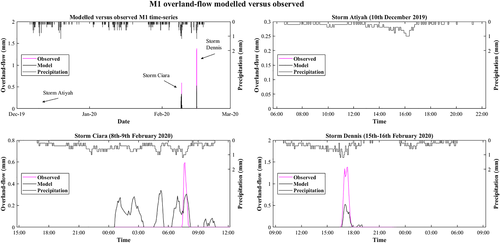
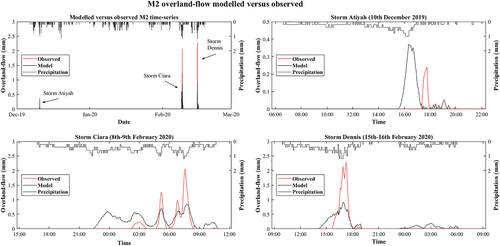
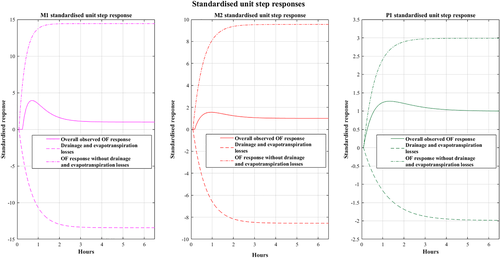
In order to get an understanding of the rainfall to overland-flow system, the RIV algorithm was used to identify a single parameter set capable of simulating the three overland-flow events. The optimal simulation for P1 is presented in Figure 6, for M1 in Figure 7, and for M2 in Figure 8, with model parameters in Table 4. Overall simulation performance is weak for M1 (36.7%), moderate for M2 (51.0%) and good for P1 (77.2%). The standardized unit step response provides an illustration of the simulated water balance for each model (Figure 9).
| Overland-flow plot | Response component | Model structure [n, m, δ] | δ (min) | TC (min) | SSG (mm/mm) | Qc (mm) | α | Rt2 | YIC |
|---|---|---|---|---|---|---|---|---|---|
| P1 | Gain | [1, 1, 0] | 0 | 33.2 | 121.4 | 0.017 | 1 | 0.772 | −9.188 |
| Loss | [1, 1, 0] | 0 | 61.1 | −80.8 | |||||
| M1 | Gain | [1, 1, 2] | 10 | 17.9 | 3.4 | 0.031 | 0.1 | 0.367 | −7.575 |
| Loss | [1, 1, 2] | 10 | 34.4 | −3.2 | |||||
| M2 | Gain | [1, 1, 1] | 5 | 28.8 | 230.6 | 0.017 | 0.9 | 0.510 | −7.571 |
| Loss | [1, 1, 1] | 5 | 37.3 | −206.4 |
3.4 Identifying hydrological responses in the litter layer and upper topsoil to artificial-rainfall
The artificial-rainfall experiment delivered a constant rainfall rate of 22.5 mm/hr for two consecutive hours (45 mm total) in an attempt to generate overland-flow on the four OFPs. Despite the high short-term rainfall intensity, neither infiltration-excess overland-flow nor saturation-excess overland-flow could be generated within any OFP. During the relatively dry conditions of 11th–15th April 2019 (Figure 4), the moisture-probe data confirmed that the topsoil in each OFP did not reach saturation (i.e., where θv equals η) during the artificial-rainfall experiments (Figure 10; Table 1).
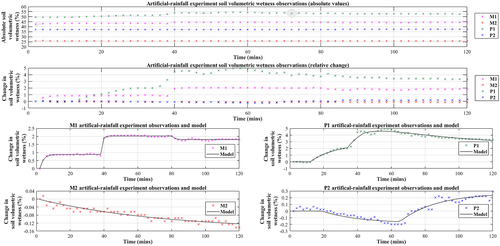
Whilst no OFP reached saturation in the litter layer and upper topsoil (strictly over 0–6 cm as measured by the moisture-probe), the θv in each OFP responded differently to the same artificial-rainfall input (Figure 10). For each plot-pair, the initial θv was lowest within HWM. Plot M1 had a higher initial θv than P2 however, although this may be due to evapotranspiration between experiments (four clear days with moderate temperatures).
The P1 and M1 artificial-rainfall experiments were conducted on the 11th April 2019 (Figure 10). The RIV functions identified three responses (hydrological response components in the litter layer and upper topsoil) for each OFP. Models fit both OFP time-series extremely well (minimum Rt2 > 0.99), with the YIC indicating that the models are parsimonious, i.e., are not overfitting the data (Table 5). Each identified response was represented by a single hydrological component (rather than a combination of components); thus, all components were identified as first-order. Hydrological components were assumed identical between P1 and M1 given plot-proximity and response timing.
| Overland-flow plot | Response component | Model structure [n, m, δ] | δ (min) | TC (min) | SSG (m3 m−3 mm−1 hr−1) | Rt2 | YIC |
|---|---|---|---|---|---|---|---|
| P1 (Continuous-time) | 1—Macropore | [1, 1, 5] | 10 | 14.7 | 0.12 | 0.993 | −8.881 |
| 2—Wetting front | [1, 1, 16] | 32 | 12.1 | 3.41 | |||
| 3—Loss | [1, 1, 21] | 42 | 42.6 | 3.51 | |||
| M1 (Discrete-time) | 1—Macropore | [1, 1, 1] | 2 | 2.1a | 0.04 | 0.999 | −7.482 |
| 2—Wetting front | [1, 1, 19] | 38 | 0.9a | 1.15 | |||
| 3—Loss | [1, 1, 40] | 80 | 1.7a | 0.23 | |||
| P2 (Continuous-time) | 1—Loss | [1, 1, 9] | 18 | 22.7 | 0.01 | 0.913 | −5.291 |
| 2—Wetting front | [1, 1, 32] | 64 | 20.1 | 0.42 | |||
| M2 (Continuous-time | 1—Loss | [1, 1, 0] | 0 | 150.0 | 0.01 | 0.964 | −7.454 |
- a As the sampling frequency for soil volumetric wetness during the experiment was every 2 min, having time-constants equal to or faster than the sampling frequency suggest that a higher sampling frequency was needed to capture these dynamics. These time constants therefore contain a relatively high level of uncertainty, and should only be taken as approximate values. It is generally suggested to have a sampling interval several times faster than the fastest time constant.
The P2 and M2 rainfall experiments were conducted on the 15th April 2019 (Figure 10). Plot M2 did not respond to the precipitation stimulus, with θv declining throughout the experiment. Plot P2 responded similarly to M2 for approximately half of the experiment, before a gradual increase began. The above response(s) were identified and models produced very good fits (minimum Rt2 > 0.91: Table 5). As before, all components were represented by individual, first-order components.
3.5 Overland-flow water-quality from wash-off experiments
Physico-chemical properties of overland-flow collected from the ‘wash-off’ experiment are presented in Table 6. Soluble reactive phosphorus within water-samples was almost identical between paired-plots, and roughly double in the upslope plots (P2 and M2) that of downslope plots (P1 and M1). Within the downslope plot-pair, DTP was roughly four times higher and PTP roughly a quarter higher in P1. For the upslope plot-pair, DTP in M2 was double that of P2, with PTP three-quarters higher within M2.
| Parameter | P1 | M1 | P2 | M2 | P1:M1 ratio | P2:M2 ratio | P1:P2 ratio | M1:M2 ratio |
|---|---|---|---|---|---|---|---|---|
| SRP (mg P L−1) | 3.1 × 10⁻² | 3.6 × 10⁻² | 7.1 × 10⁻² | 7.2 × 10⁻² | 1:1.2 | 1:1 | 1:2.3 | 1:2 |
| DTP (mg P L−1) | 1.17 × 10⁻¹ | 3.1 × 10⁻² | 1.00 × 10⁻¹ | 2.00 × 10⁻¹ | 1:0.26 | 1:2 | 1:0.855 | 1:6.5 |
| PTP (mg P L−1) | 3.04 × 10⁻¹ | 2.38 × 10⁻¹ | 1.50 × 10⁻¹ | 2.62 × 10⁻¹ | 1:0.783 | 1:1.75 | 1:0.493 | 1:1.10 |
| NO3− (mg N L−1) | 1.43 | 5.14 | 2.20 | 3.75 | 1:3.59 | 1:1.70 | 1:1.54 | 1:0.730 |
| NO3− NO2− (mg N L−1) | 6.6 × 10⁻² | 4.96 × 10⁻¹ | 7.2x10⁻² | 5.36 × 10⁻¹ | 1:7.5 | 1:7.4 | 1:1.1 | 1:1.08 |
| DOC (mg L−1) | 4.65 | 1.04 × 101 | 5.00 | 1.02 × 101 | 1:2.24 | 1:2.04 | 1:1.08 | 1:0.981 |
| TS (mg L−1) | 3.29 × 10² | 1.34 × 10⁴ | 8.57 × 10² | 5.51 × 10³ | 1:40.7 | 1:6.43 | 1:2.60 | 1:0.411 |
| EC (S m−1) | 2.37 × 101 | 8.37 × 101 | NA | NA | 1:3.53 | NA | NA | NA |
Nitrogenous compounds, DOC, total sediment and electrical conductivity were higher/more concentrated in HWM than AIP. Nitrate was 260% higher in M1 than P1, and 70% higher in M2 than P2. Nitrate-nitrite was 650% larger in M1 than P1, and 640% larger in M2 than P2. Overland-flow DOC was 125% higher in M1 than P1, and 100% higher in M2 than P2. Overland-flow total sediment was 3970% higher within M1 than P1 and 540% higher within M2 than P2. Electrical conductivity was recorded for the downslope plots only, and was 250% larger within M1.
4 DISCUSSION
4.1 Soil and topographic properties that may influence hydraulic properties (objective I)
Plot-pairings are shown to have similar topographies, and therefore topography should not bias differences between land-uses (Figure 3). The variety in slopes between upper and lower plot-pairings captures some natural variation in gradient, and possibly some natural variability in hydrological functioning. Similarities in soil texture, type, pH and profiles, as well as gradient and geologies, justifies the study site as being identical prior to intervention.
Higher ρb and lower η in AIP is likely due to topsoil compaction caused by livestock grazing and agricultural machinery within the pasture (Alaoui, Rogger, Peth, & Blöschl, 2018; Drewry, Littlejohn, & Paton, 2000; Heathwaite, Burt, & Trudgill, 1989, 1990). The wild-margins are sheltered from these pressures and vegetation growth in HWM creates an extensive root system that likely reduces topsoil compaction. Walter, Mérot, Layer, and Dutin (2003) similarly observed lower ρb values around hedgerows. Holden et al. (2019) found hedgerow topsoil to have significantly lower ρb than pastures, but found similar ρb between hedge-margins and pastures. Elevated ρb and reduced η within AIP may negatively influence soil macroporosity in particular, thus lowering topsoil permeability and potentially increasing the likelihood of overland-flow generation (Beven & Germann, 1982).
Increased organic matter overall within HWM compared to AIP may be due to higher leaf-litter inputs (Bernacki, 2003; Hongve, 1999; Walter et al., 2003). Organic matter likely increases aggregate and structural stability, thereby increasing permeability and reducing overland-flow likelihood, as well as increasing water-holding capacity (Chandler & Chappell, 2008; Chaney & Swift, 1984). Elevated organic matter in HWM may additionally suggest an abundant food supply for soil fauna such as earthworms; which can strongly influence soil hydraulic properties (Capowiez et al., 2009; Capowiez, Sammartino, & Michel, 2014). Hof and Bright (2010) noted that arable fields with grassy margins had higher earthworm abundance than fields without margins. Holden et al. (2019) did not observe significant differences in earthworm biomass and density between hedge-margins and pastures however.
Highly similar soil pH is likely because of similar soils, as well as plot-proximity and identical historical management. The fairly neutral conditions (Table 1) are likely because of historic liming (Holland et al., 2018; Wallace & Chappell, 2020). Acidic soils have increased sensitivity to disturbance, and therefore a greater likelihood of reduced topsoil permeability and increased overland-flow likelihood (Chappell, Stobbs, Ternan, & Williams, 1996).
4.2 Topsoil permeability (objective II)
Permeability was substantially higher in HWM than AIP, with all summary statistics at least 20 times higher (Table 3). Permeability measurements within HWM are approximate values, as at such a high permeability flow through macropores may become turbulent and so not accurately represented by Darcy's Law (Chappell & Ternan, 1997). Holden et al. (2019) observed similar Ksat values between hedge-margins and pastures, although higher Ksat directly within hedgerows compared to pastures.
Four provisional mechanisms are proposed to explain the significantly higher Ksat observed within HWM. Firstly, extensive hedgerow/shrub root networks can promote the creation of macropores within the soil-matrix, even following root death (Beven & Germann, 1982). Soil biota that improve macroporosity could also differ between land-uses (Capowiez et al., 2009, 2014; Hof & Bright, 2010). Holden et al. (2019) observed similar macropore-flow distributions between pasture and hedge-margin soils however. Secondly, HWM is largely sheltered from compacting forces such as agricultural traffic and livestock (Alaoui et al., 2018). This is further supported by ρb and η (Tables 1 and 2). Fewer compacting forces may suggest that macropores/structural-cracks within HWM are slower to re-seal, and thus, permeability is maintained (Bouma & Dekker, 1978).
Thirdly, extensive root systems within HWM support substantial water uptake to facilitate transpiration, with consequential soil drying. This is likely amplified by rain sheltering and wet-canopy evaporation provided by the hedgerow (Ghazavi et al., 2008; Herbst et al., 2006). Soil desiccation encourages structural-cracks, increasing macroporosity (Bouma & Dekker, 1978). Soil cracking is frequently observed on desiccated gleysols/stagnosols during extended warm weather (Beven & Germann, 1982; Chappell & Lancaster, 2007), and has been observed for nearby catchments during this period (Wallace & Chappell, 2019). Holden et al. (2019) observed significantly drier soil in the winter underneath hedge-margins compared to pastures, with Ghazavi et al. (2008) and Holden et al. (2019) observing the same process for hedgerows versus pastures in both summer and winter.
Lastly, higher organic matter concentrations in HWM soils may improve aggregate structure (Tables 1 and 2), with stable soils capable of supporting macropores in larger numbers (Chaney & Swift, 1984). Follain, Walter, Legout, Lemercier, and Dutin (2007) observed hedgerow soils to contain high levels of organic carbon. The resultant structural improvement may increase Ksat (Baffet, 1984, cited in Walter et al., 2003).
4.3 Overland-flow generated by natural precipitation events (objective III)
During the 11-month monitoring period, only four overland-flow events were observed, suggesting overland-flow is a rare phenomenon and only occurs during very large rain-events. Overland-flow occurred surrounding three named mid-latitude cyclones, which resulted in the highest streamflows of the monitoring period (although not necessarily the highest rainfall intensities), as well as during a probable convective event on the 24th June 2019. The latter event was likely convective as no rainfall was observed at the Back Greenriggs rain-gauge during this period, although the plot rain-gauge observed short, intense rainfall (Figure S1). Overland-flow from this event was possibly linked to the development of hydrophobicity of the vegetation root-mat and litter-layer following a dry period (Burch, Moore, & Burns, 1989; Mao, Nierop, Rietkerk, Sinninghe Damsté, & Dekker, 2016).
All plots confirm that streamflow generation is primarily sourced from subsurface flow. During saturated conditions however, overland-flow can become an active hydrological pathway and contribute water to lower slopes. The importance of the antecedent saturation conditions on overland-flow is emphasized given that Storm Dennis was a considerably smaller rain-event than Storm Ciara, yet produced much higher proportions of overland-flow in respect to the rainfall input. The overland-flow data for this site is of considerable value, as so few experimental sites have such measurements, and this is the first site globally to capture field-based observations of overland-flow from hedgerows/wild-margins. Results underline that considerably more overland-flow may be produced from pastures in comparison to wild-margins, and that overland-flow can be an active hydrological component during large rain-events in upland United Kingdom.
Single-parameter sets for the three overland-flow events highlight that while the P1 performance is reasonable, the magnitude and timing of the smaller rainstorm (Storm Atiyah) is missed completely (Figure 6). This would indicate that the representation of the non-linearity in the rainfall to overland-flow dynamics is poorly represented by the state of the Back Greenriggs streamflow. Representing the build-up of saturation in the litter layer and topsoil to generate saturation-excess overland-flow may need a better index of topsoil wetness than catchment-integrated streamflow generated primarily by deeper flow pathways (Ockenden & Chappell, 2011).
The streamflow-threshold for the onset of overland-flow in the modelling is identical between P1 and M2 plots, outlining effective rainfall begins at the same degree of catchment-integrated saturation for both OFPs. Both P1 and M2 also demonstrated strong non-linearity in the rainfall to overland-flow response, implying a strong influence of catchment-integrated saturation upon overland-flow generation. Plot M1 had a much higher streamflow-threshold, implying a higher degree of saturation was required before overland-flow occurred, although M1 also contained a weaker non-linearity.
The time-constants of the overland-flow response (or ‘residence-times’) for each plot once saturated is comparable at 33 min (P1), 18 min (M1) and 29 min (M2; Table 4). Such flashy overland-flow responses are slower than those observed on tropical hillslopes on Borneo (Chappell et al., 2004), but much faster than micro-catchment responses dominated by subsurface flow observed elsewhere in the United Kingdom (e.g., Jones & Chappell, 2014). Model δs are the delay between effective rainfall and the onset of overland-flow. Only δs up to 10 minutes were considered due to computational limitations. Hedgerow wild-margin plots had longer δs than P1 (Table 4), suggesting they are slower to produce overland-flow once the streamflow-threshold was reached.
The SSG is the ratio of output to input at steady-state, and therefore infers the conversion of precipitation into overland-flow once the saturation-threshold has been reached. The relative SSG of the loss and gain components within HWM plots were very similar, suggesting fairly small amounts of overland-flow production, likely because of high drainage and evapotranspiration rates (Table 4: Figure 9). The larger gain relative to the loss component in P1 suggests that pastures produce a much higher proportion of overland-flow compared to wild-margins, as was observed (Figure 9). Due to the system being non-linear with threshold-enabled phenomenon, Figure 9 is only interpretable above the specified saturation-thresholds. These piecewise linear models provide both proof and quantification of the conceptual model (Figure S2).
4.4 Identifying hydrological responses in the litter layer and upper topsoil to artificial-rainfall (objective IV)
The artificial-rainfall experiments support the natural precipitation overland-flow time-series by demonstrating that overland-flow is not easily generated even with sustained extreme precipitation intensities, further suggesting that saturation is a key component in overland-flow generation. During the P1 and M1 artificial-rainfall experiments, the initial gain in θv (component 1) is likely macropore-flow, as this is likely the fastest hydrological pathway present in the OFPs. The instantaneous M1 response suggests a well-developed macropore structure capable of rapid transport; with the delayed P1 response suggesting a less effective macropore system. Both of these findings are strongly supported by Ksat measurements, and to a lesser extent by ρb and η (Tables 1-3). The second θv gain (component 2) within both plots is likely a slower, soil-matrix wetting front. This occurs almost simultaneously between OFPs, suggesting similar travel times, and could be explained by a wetting front resulting from the similar soils. The final response (component 3) indicates a θv loss, and is possibly evapotranspiration as the drainage rate is assumed quasi-constant throughout the experiment. Artificial-rainfall experiments were conducted on warm, clear days with moderate winds, which may facilitate evapotranspiration. It is likely that uncompensated temperature drift and inherent uncertainty (±2% θv) within the moisture-probe contributed towards this loss component (see Gaskin & Miller, 1996).
The time-constants for M1 were very small throughout the artificial-rainfall experiment, highlighting fast system dynamics which concurs with observed responses from the natural overland-flow time-series (admittedly at probable different θv contents). Some of the time-constants for M1 were below the artificial-rainfall experiment moisture-monitoring frequency, indicating that faster sampling (ideally 10–15 s) is necessary to accurately quantify hydrological dynamics near the surface. Plot P1 came relatively close to saturation and showed much larger time-constants, and therefore slower dynamics, which additionally concurs with observations from the natural overland-flow time-series (broadly comparable time-constant to Table 4). Differences in time-constants between P1 and M1 suggest that wild-margin soils respond more rapidly to precipitation stimuli than pasture soils (Table 5).
The SSG in this instance infers the conversion of precipitation into θv. Smaller SSGs for M1 compared to P1 suggest that less rainfall is being converted into θv accumulation in the litter layer and upper topsoil (Table 5). This suggests that although wild-margins may respond more rapidly than pastures to precipitation stimuli (smaller time-constants), they are likely to be slower to saturate and produce overland-flow, further confirming overland-flow observations.
Within M2 and P2, the θv loss component is likely evapotranspiration, as meteorological conditions were similar to previous experiments. As before, inherent uncertainty and uncompensated temperature drift within the moisture-probe likely contributed towards this (Gaskin & Miller, 1996), especially since observed θv changes are so small (Figure 10). The gain component within P2 is likely a soil-matrix wetting front, as P2 is the most clay-rich OFP (Table 1), and therefore may have slower matrix-flow than other OFPs. This gain component could be macropore-flow, however Tables 2 and 3 highlight similar permeability between pastures, although unsaturated flow is not accurately represented by Ksat.
The time-constant (longer than the experiment) and δ (non-existent) values for M2 underline no observable response to the artificial-rainfall. This is reinforced by small SSG values, which suggests that no input (i.e., rainfall) is being converted into output (i.e., θv). The complete lack of response in M2 during the artificial-rainfall experiment is likely caused by the dry initial conditions, and therefore underlines the importance of including non-linearity within the overland-flow models.
The SSG of the loss component was identical between P2 and M2. The P2 gain dynamics were roughly half as fast as the P1 gain dynamics, and much slower than M1. This suggests pastures have more consistent dynamics in relation to precipitation compared to hedgerow wild-margins, which have both extremely fast (M1) and extremely slow (M2) dynamics, possibly due to more homogenous vegetation and land management. The pastures contained notably different response (latency) times however (different δ values), with P2 having a considerably longer delay and therefore requiring a longer time to saturate. This was likely caused by differing initial θv, alongside soil and topographic variations.
4.5 Overland-flow water-quality from wash-off experiments (objective V)
The similar SRP concentrations in overland-flow between plot-pairs suggests losses are identical between land-uses. Reduced SRP concentrations in the lower paired-plots implies that it is less available downslope. Total phosphorus concentrations (DTP and PTP) revealed inconsistent patterns however.
Higher NO3− and NO3− NO2− in overland-flow from HWM highlights that the surface of wild-margins can release considerably larger quantities of nitrogenous compounds in a flush of overland-flow compared to pastures following rewetting. This is substantial given that improved-pastures are prone to nitrate flushing (Gordon, Haygarth, & Bardgett, 2008; Mian, Riaz, & Cresser, 2008). Nitrates are known to accumulate within hedgerow wood and leaf-litter, with soil dryness within HWM decreasing denitrification, organic matter mineralization, and microbial immobilization, all of which may increase nitrate flushing (Benhamou et al., 2013; Bernacki, 2003; Gordon et al., 2008; Grimaldi et al., 2012). Higher DOC within HWM overland-flow is possibly due to leaf-litter accumulation, as well as increased soil organic matter (Table 1; Hongve, 1999). Higher DOC in overland-flow alongside higher soil organic matter may suggest higher mineralization within HWM soils, which could further amplify nitrate flushing (Holden et al., 2019).
Higher sediment concentrations within HWM overland-flow suggests that wild-margins contain substantially more loose material on the soil surface than pastures, possibly because of aeolian sheltering, increased soil binding, and reduced overland-flow (Angima, Stott, O'Neill, Ong, & Weesies, 2002; Walter et al., 2003). The dense grass sward may also have protected the underlying soils within AIP. This sediment disparity was not detectable with the phosphorus chemistry however, suggesting HWM soils to be much less phosphorus-rich. Higher electrical conductivity in HWM overland-flow highlights a greater concentration of ions, and therefore supports that an increased number of pollutants are stored on the surface of wild-margins in comparison to pastures.
The wash-off experiments highlight that overland-flow water-quality is considerably worse from HWM in comparison to AIP, particularly in relation to NO3−, NO3− NO2− and sediment. The impact of hedge-margins on water-quality during real events is much less clear-cut however, given that natural precipitation intensities (including the artificial-rainfall experiment) rarely generated overland-flow, and HWM produced considerably less overland-flow than AIP. Further experimentation under more natural rainfall conditions is needed to determine the true mobilization potential of contaminants, and therefore to determine if hedge-margins may act as sinks or sources of potential contaminants in agricultural catchments.
5 IMPLICATIONS AND CONCLUSIONS
Hedgerows are commonplace landscape features that provide an array of ecosystem and agricultural services. Despite their widespread presence, minimal data exists regarding how hedgerows influence near-surface hydrology, with no field-based studies directly observing changes to overland-flow (and entrained contaminants) induced by hedgerows. This study has quantified changes to topsoil hydraulic properties and overland-flow incidence, magnitude and water-quality following the conversion of a pasture to a hedgerow wild-margin after only a relatively short time-period.
- Hedgerow wild-margins had significantly lower soil dry bulk-density and significantly higher porosity than the pastures. This implies that introducing wild-margins can fairly rapidly improve soil physico-chemical properties.
- Wild-margins had significantly higher permeability than the pastures (median 2200–2700% higher). Wild-margins may therefore provide flood-mitigation benefits for agricultural catchments, particularly where soils are less permeable (see Wallace & Chappell, 2019). This supports prior modelling assumptions and provides quantitative permeability estimates for future studies.
- Overland-flow observations and models based on natural precipitation highlight that overland-flow only becomes an active hydrological pathway during large rain-events in upland UK catchments, almost entirely occurring during periods of peak streamflow. Wild-margins were found to generate considerably less overland-flow than pastures, possibly due to increased drainage and/or evapotranspiration. The systems modelling produced a proof and quantification of model concept, outlining that wild-margins require an equal or greater threshold of streamflow (catchment-integrated saturation) for the onset of overland-flow in comparison to pastures, and wild-margins were slower to produce overland-flow once this threshold had been reached. Systems modelling additionally highlights rapid dynamics within overland-flow responses. Future work could repeat this analysis on individual events to assess stationarity in model structure/parameters, as well as contrast overland-flow and streamflow hydrographs. Improved representation of the non-linearity due to topsoil saturation is also required.
- The artificial-rainfall experiments confirm that pastures saturate faster than hedge-margins, highlighting wild-margins to have extremely variable dynamics in response to precipitation, whereas pastures have more moderate and consistent (but still variable) dynamics. Variable dynamics in both land-uses was likely caused by non-linearity due to differing initial moisture conditions and/or spatial-variability between plots. Future work could repeat this experiment with pre-saturated plots and differing precipitation intensities/durations.
- Water-quality results outline that wild-margins may contain considerably larger quantities of nitrogenous compounds and sediment on the ground surface compared to pastures. Further experimentation is needed to determine contaminant mobilization potential during natural rainfall events. Future researchers conducting similar experiments are advised to incorporate soil chemistry/microbiology for improved interpretations.
ACKNOWLEDGEMENTS
The authors appreciate land access provided by the Lowther Estate Trust, especially David Bliss and Anne Forrester. The authors also acknowledge the contribution of field assistants. Gratitude is owed to John Crosse, John Quinton, Annette Ryan, Vassil Karloukovski and Catherine Wearing for laboratory access. This project was funded by the European Regional Development Trust Fund and Eden Rivers Trust as part of CGE Project 50, with support from Natural Environment Research Council (NERC) Grant NE/R004722/1.
CONFLICT OF INTEREST
The authors declare no conflicts of interest.
Open Research
DATA AVAILABILITY STATEMENT
The data that support the findings of this study are available from the corresponding author upon reasonable request.


