Transcriptomic analysis reveals the crosstalk between type 2 diabetes and chronic pancreatitis
Youlan Chen and Lixiao Hao contributed equally to this work and share first authorship.
Abstract
Background and Aims
Mounting evidence highlights a strong association between chronic pancreatitis (CP) and type 2 diabetes (T2D), although the exact mechanism of interaction remains unclear. This study aimed to investigate the crosstalk genes and pathogenesis between CP and T2D.
Methods
Transcriptomic gene expression profiles of CP and T2D were extracted from Gene Expression Omnibus, respectively, and the common differentially expressed genes (DEGs) were subsequently identified. Further analysis, such as Gene Ontology (GO), Kyoto Encyclopedia of Genes and Genomes (KEGG), protein–protein interaction, transcription factors (TFs), microRNA (miRNAs), and candidate chemicals identification, was performed to explore the possible common signatures between the two diseases.
Results
In total, we acquired 281 common DEGs by interacting CP and T2D datasets, and identified 10 hub genes using CytoHubba. GO and KEGG analyses revealed that endoplasmic reticulum stress and mitochondrial dysfunction were closely related to these common DEGs. Among the shared genes, EEF2, DLD, RAB5A, and SLC30A9 showed promising diagnostic value for both diseases based on receiver operating characteristic curve and precision-recall curves. Additionally, we identified 16 key TFs and 16 miRNAs that were strongly correlated with the hub genes, which may serve as new molecular targets for CP and T2D. Finally, candidate chemicals that might become potential drugs for treating CP and T2D were screened out.
Conclusion
This study provides evidence that there are shared genes and pathological signatures between CP and T2D. The genes EEF2, DLD, RAB5A, and SLC30A9 have been identified as having the highest diagnostic efficiency and could be served as biomarkers for these diseases, providing new insights into precise diagnosis and treatment for CP and T2D.
1 INTRODUCTION
Chronic pancreatitis (CP) is a progressive and chronic disease characterized by a syndrome of fibrosis and inflammation of the pancreas in individuals with genetic, environmental, and/or other risk factors.1 Patients with CP often suffer from various physical disorders, including abdominal pain and sequelae of exocrine and endocrine insufficiency.1, 2 Long-term complications of CP evolve as the disease progresses, including malnutrition, pseudocysts, low bone mineral density, diabetes mellitus, and pancreatic cancer, which cause severe impact on quality of life and life expectancy.2-5 Unfortunately, there is currently no effective treatment to interrupt or reverse the progression of the disease. The objective of current treatment strategies is to improve clinical symptoms and mitigate these complications. Thus, early screening, as well as early management and treatment, are urgently needed for CP and its related complications.
Since 1901, the relationship between diabetes and pancreatitis has been appreciated.6 Diabetes, a group of metabolic diseases characterized by insulin resistance and malfunction of pancreatic β-cells, affects 537 million people worldwide.7 Of these, over 90% cases are type 2 diabetes (T2D).7 Interestingly, a “circular argument” of causation has been raised to describe the relationship between diabetes and pancreatitis. Namely, diabetes is believed to influence pancreatitis, and vice versa.8 In general, diabetes is considered a frequent complication of CP, with a prevalence ranging from 25% to 80%.2
The American Diabetes Association classifies CP-related diabetes as type 3c diabetes, which shares many similarities with T2D in terms of clinical presentation and treatment.9 According to a spectrum analysis of diabetes, in addition to the pathophysiological mechanisms associated with CP, many patients with CP-related diabetes also have risk factors associated with T2D.10 Another study showed that the combination of CP and T2D can lead to a mutually aggravating process involving insulin resistance, chronic low-intensity inflammation, and dyslipidemia.11 Moreover, compared to comorbidity in CP-T2D, patients with diabetes related to CP present a more aggressive phenotype (microangiopathy and infection) and higher need for glucose-lowering treatment, and even patients who experience their first attack of pancreatitis may require long-term management after being discharged from the hospital.12, 13 Taken together, CP and T2D exhibit a strong correlation during the progression of the disease. However, the shared signatures and underlying pathogenesis of comorbidity are still not fully understood.
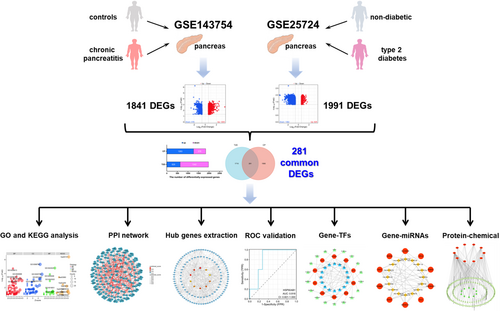
Currently, the rapid development of sequencing technology and integrated bioinformatics analysis provides an effective means to discover the common pathogenesis of multiple diseases, which could be used as new biomarkers for diagnosis and treatment. In this study, microarray datasets of CP and T2D were retrieved from the Gene Expression Omnibus (GEO) database, and 281 common differentially expressed genes (DEGs) were identified. Next, the common DEGs were analyzed using a series of computational approaches to uncover the underlying biological processes and signaling pathways. The CytoHubba plug-in was then utilized to extract hub genes that could potentially serve as therapeutic targets for CP and T2D. To investigate the common pathogenesis, we also predicted transcription factors (TFs) and microRNAs (miRNAs) based on the hub genes. Finally, gene-drug interaction was analyzed to predict possible drug compounds for treating CP and T2D. The research flowchart is displayed in Figure 1.
2 MATERIALS AND METHODS
2.1 Data acquisition
We searched the gene expression profiles of CP and T2D in the GEO database (https://www.ncbi.nlm.nih.gov/geo/), and filtered the dataset based on the following criteria. First, the genetic information must include both cases and controls. Second, the sample size had to consist of five or more pairs, and the sample had to be derived from pancreatic tissue. Third, the dataset type should be expression profiling by array. Fourthly, the complete raw data should be available for reanalysis. At last, we selected a CP dataset (accession ID: GSE143754, platform ID: GPL17586) consisted of 9 negative pancreatic head samples and 6 CP pancreatic head samples. Similarly, the T2D dataset (accession ID: GSE25724, platform ID: GPL96) consisted of 7 non-diabetic pancreatic islets samples and 6 T2D pancreatic islets samples was collected. In addition, the GSE123375 dataset (platform ID: GPL17586) of pancreatic fibroblast samples from 11 controls and 5 CP patients, as well as the GSE20966 dataset (platform ID: GPL1352) of pancreatic beta-cell samples from 10 controls and 10 T2D patients, were downloaded for external validation.
2.2 Data processing and DEGs identification
The raw data was normalized using R software (version 4.1.2) and underwent a log2 transformation. A corresponding gene matrix file was then generated for further analysis. Next, the “limma” R package was applied to identify DEGs with a p < 0.05 and |log2 fold change (FC)| ≥0.585 in the CP dataset (GSE143754) and T2D dataset (GSE25724), respectively. Subsequently, we used the “VennDiagram” R package to get the overlapping DEGs between these datasets, considering them as the common DEGs.
2.3 Function enrichment analysis
Gene Ontology (GO) and Kyoto Encyclopedia of Genes and Genomes (KEGG) enrichment analyses of common DEGs were conducted through the “clusterProfiler” R package. A p < 0.05 was set as the threshold.
2.4 Protein–protein interaction (PPI) network analysis
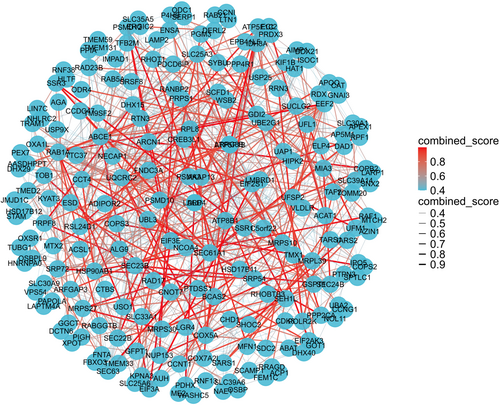
We uploaded the common DEGs to the online STRING website (https://stringdb.org) to generate a file that represents the interactions among proteins, known as a string-interactions file. The filtering criteria was a combined score >0.4. Then, the PPI network was visualized using the “igraph” and “ggraph” R packages.
2.5 Screening of hub genes
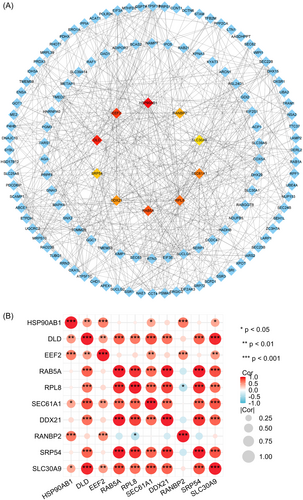
The top 10 hub genes were identified by cytoHubba plug-in of Cytoscape (3.8.2) software, with the filtering condition being Betweenness algorithm.14 Using the “ggplot2” R package, we performed the relevance analysis and heatmap construction for the shared hub genes based on the Spearman method. Furthermore, receiver operating characteristic curve (ROC) analysis and precision-recall (PR) curves were conducted to evaluate their diagnostic effiectiveness for disease.
2.6 Verification of hub genes
The validation datasets were treated in the same way as explained earlier, which involved normalization and processing. The ROC and PR curves were analyzed using the “pROC” R package, and visualized through the “ggplot2” R package. The area under curve (AUC) value was used as an evaluation criterion for determining the diagnostic significance of diseases.
2.7 Identification of TFs and miRNAs
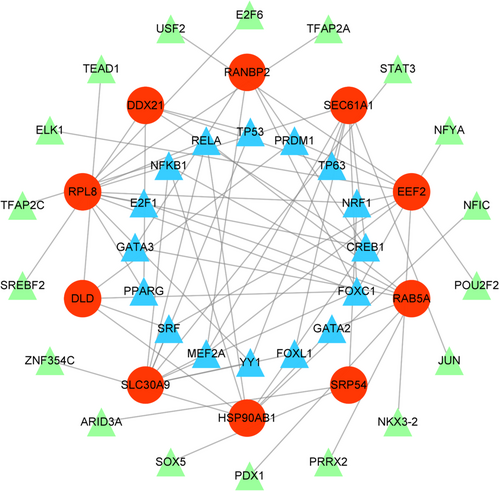
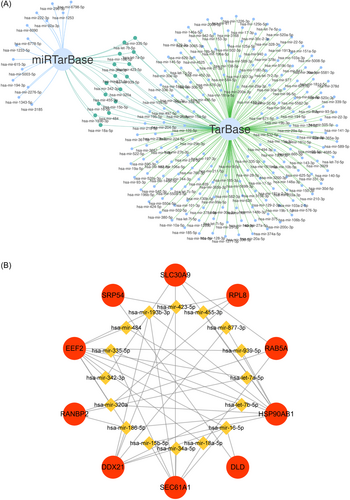
JASPAR (http://jaspar.genereg.net/), a user-friendly open-access database, was used to predict the top TFs that bind to hub genes. In the meantime, miRNAs targeting the hub genes were identified by miRTarBase (version 8.0) and TarBase (version 8.0) databases. Moreover, we selected the miRNAs that overlap between these databases as the key miRNAs. NetworkAnalyst (version 3.0) (https://www.networkanalyst.ca/) was applied to identify the key TFs and miRNAs, while Cytoscape was employed to construct the topological network of TFs-gene and gene-miRNA.
2.8 Chemical prediction of hub genes
To explore possible therapeutic chemicals for CP and T2D, protein-chemical interactions was analyzed based on comparative toxicogenomics database (CTD).15 The visual network was mapped through Cytoscape software.
2.9 Gene-disease association analysis
The DisGeNET platform (http://www.disgenet.org/), which containing the full spectrum of human diseases as well as normal and abnormal traits, was employed to discover potential diseases associated with hub genes, providing theoretical foundation for studying the molecular mechanisms of diseases.
3 RESULTS
3.1 Identification of common DEGs between CP and T2D
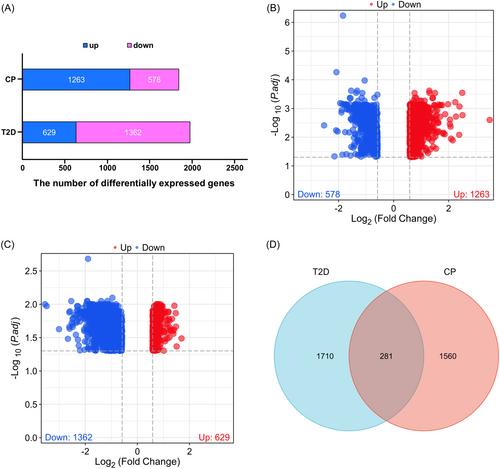
To explore the pathogenesis of CP and T2D, we separately collected their DEGs on the basis of the screening criteria mentioned above. As shown in Figure 2A and Table S1, we identified 1263 upregulated and 578 downregulated DEGs in the CP dataset (a total of 1841 DEGs), whereas 629 upregulated and 1362 downregulated DEGs in the T2D dataset (a total of 1991 DEGs). The DEGs for CP and T2D were presented by volcano plots, respectively (Figure 2B,C; Table S2). According to the Venn diagram, the CP and T2D datasets shared 281 DEGs, which were considered as common DEGs (Figure 2D; Table S2), indicating a strong correlation between CP and T2D.
3.2 GO and pathway enrichment analyses
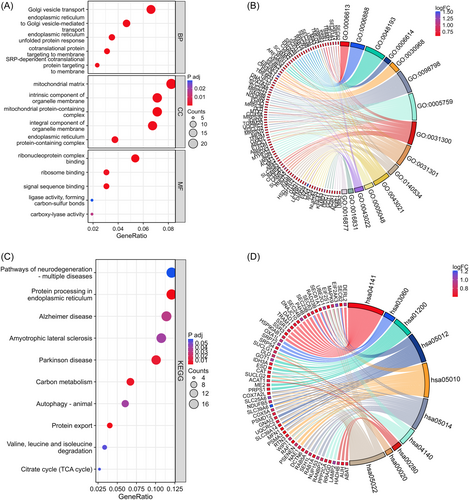
To understand the biological functions and signaling pathways associated with the 281 common DEGs, we next performed GO and KEGG enrichment analyses. GO enrichment analysis includes biological process (BP), cellular component (CC), and molecular function (MF), which represent the functional composition of enriched gene. Specifically, the BP were largely related to Golgi vesicle transport, endoplasmic reticulum (ER) to Golgi vesicle-mediated transport, and ER unfolded protein response. For the CC category, DEGs were primarily associated with the mitochondrial matrix, intrinsic component of organelle membrane, and mitochondrial protein-containing complex. Additionally, the top three statistically significant terms in the MF category were ribonucleoprotein complex binding, ribosome binding, and signal sequence binding (Figure 3A,B; Table S3). Moving on to the KEGG analysis, the DEGs were predominantly enriched in Pathways of neurodegeneration-multiple diseases, Protein processing in ER, and Alzheimer disease, etc (Figure 3C,D; Table S3). These results revealed that the common DEGs were closely related to ER and mitochondrial function, which has been recognized as one of the important mechanisms in both CP and T2D.
3.3 PPI network construction and hub genes extraction
To further elucidate PPIs between the two diseases, the shared genes were analyzed via STRING database, and subsequently a string-interactions file was generated for the following analysis (Table S4). A PPI network was then constructed using R software on the basis of combined score (Figure 4; Table S4). Ulteriorly, the cytoHubba plug-in was applied to discover the most critical hub genes in the PPI network. Based on the Betweenness method score, we ultimately harvested the top 10 hub genes including HSP90AB1, DLD, EEF2, RAB5A, RPL8, SEC61A1, DDX21, RANBP2, SRP54, and SLC30A9 (Figure 5A; Table S4). In the meantime, relevance heatmap of these hub genes was shown in Figure 5B and Table S5, which indicated the correlation among them. Subsequently, we conducted ROC and PR analyses for CP and T2D, respectively. The results displayed that the AUC value of the CP dataset was greater than 0.926, while that of the T2D dataset was greater than 0.857 (Figures S1–4). Taken together, these data suggested that the hub genes played an excellent diagnostic role, and might become novel diagnostic and therapeutic targets for CP and T2D.
3.4 Verification of hub genes
To validate the screened genes, we also analyzed the ROC curves of hub genes and calculated the AUC values for external validation datasets. Among the 10 hub genes, EEF2 and SEC61A1 have the highest diagnostic value in the GSE123375 dataset, with AUC values for DLD, RAB5A, SLC30A9, and HSP90AB1 were 0.955, 0.90, 0.891, and 0.818, respectively (Figure S5). Similarly, they also have effective diagnostic value in the GSE20966 dataset, with the AUC values of RAB5A, DLD, SLC30A9, RPL8, EEF2, and RANBP2 being 0.86, 0.85, 0.84, 0.79, 0.77, and 0.710, respectively (Figure S6).
3.5 The regulatory signatures analysis of hub genes
As crucial factors in transcriptional and post-transcriptional regulation, TFs and miRNA are often indicative of distinct specific functions.16, 17 Given their important regulatory role in gene expression, we separately predicted the TFs and miRNA of hub genes to gain a better comprehension of disease progression. Hub genes associated TFs were ranked by degree values. Ultimately, we selected 16 TFs as key TFs, including FOXC1, CREB1, NFKB1, RELA, MEF2A, NRF1, SRF, YY1, E2F1, PPARG, TP53, GATA3, TP63, PRDM1, GATA2, and FOXL1 (Figure 6; Table S5). The miRNAs were also ranked by degree values using the miRTarBase and TarBase databases, and 16 key miRNAs were determined through intersection, containing hsa-mir-193b-3p, hsa-mir-186-5p, hsa-mir-16-5p, hsa-mir-18a-5p, hsa-mir-320a, hsa-mir-342-3p, hsa-mir-423-5p, hsa-let-7a-5p, hsa-mir-877-3p, hsa-mir-34a-5p, hsa-mir-15b-5p, hsa-mir-335-5p, hsa-let-7b-5p, hsa-mir-484, hsa-mir-939-5p, and hsa-mir-455-3p (Figure 7A,B; Table S5). These results revealed a high relevance between hub genes and TFs, miRNAs, which could potentially serve as new molecular targets for CP and T2D.
3.6 Recognition of protein-chemical interactions
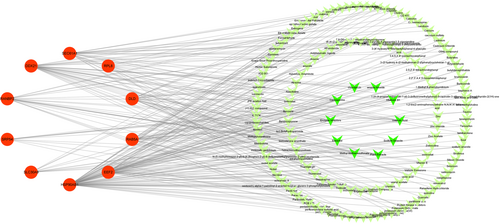
Based on the CTD database, potential chemical compounds targeting hub genes were ranked by their degree values. The top 10 candidate chemicals were Cyclosporine, Enzyme Inhibitors, Valproic Acid, Aflatoxin B1, Methyl Methanesulfonate, Plant Extracts, Estradiol, Sodium Selenite, chloropicrin, and arsenic trioxide (Figure 8; Table S6), which may have therapeutic effects on hub genes.
3.7 Determination of gene-disease associations
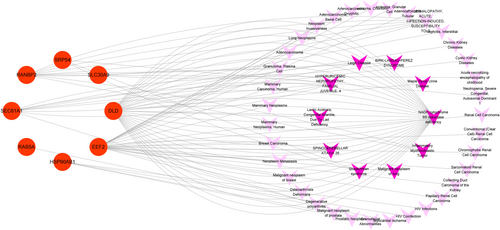
A great number of diseases share common genes and pathogenesis. Thus, we analyzed possible diseases related to hub genes through the gene-disease associations score, and the results showed that the most prominent diseases were NADH cytochrome B5 reductase deficiency, hyperuricemic nephropathy, spinocerebellar ataxia, inflammatory myofibroblastic tumor, and Shwachman syndrome, etc. (Figure 9; Table S6). These findings illustrated that they shared some similarities with CP and T2D.
4 DISSCUSSION
In recent years, the possible connections between different diseases have attracted widespread attention from researchers. Actually, the relationship between CP and diabetes has been recognized for over a century. According to a large multicenter cohort study, traditional risk factors for T2D, such as excess weight and family history, were found to have a first-order association with disease progression of CP.18 Other clinical studies have revealed deeper levels of inflammation and secretory insufficiency of the pancreas in patients with CP-T2D comorbidity compared to those with isolated CP.19 However, the molecular mechanisms behind the complex relationship between CP and T2D have not yet been fully elucidated. Hence, it is necessary to identify shared molecular markers and explore possible co-pathogenesis between these diseases. To our knowledge, this study is the first to investigate the shared genes and signatures between CP and T2D using integrated bioinformatics.
In the present study, we identified 281 common DEGs by intersecting the gene expression profiles of CP and T2D downloaded from the GEO database. Through GO and KEGG analyses, we discovered that these common DEGs were mainly enriched in ER and mitochondria associated protein processing. Protein synthesis is highly active in the pancreas, leading to a significant demand for ER and mitochondrial systems. Under physiological conditions, pancreatic acinar cells produce plenty of digestive enzymes, accompanied by activated protein folding and degradation, to maintain ER homeostasis.20 Previous research has elucidated the indispensable impact of ER stress on pancreatic function and disease pathology, involving T2D and CP.21, 22 On the other hand, mitochondrial signal transduction in pancreatic acinar cells and β-cells also plays a central role in both CP and T2D by mediating insulin secretion and maintaining Ca2+ homeostasis.23 Thus, it can be seen that the crosstalk mechanism between CP and T2D may be closely linked to ER stress and mitochondrial dysfunction.
Next, to better understand the potential mechanisms of these two diseases, we screened out 10 hub genes through cytoHubba plug-in of Cytoscape, namely HSP90AB1, DLD, EEF2, RAB5A, RPL8, SEC61A1, DDX21, RANBP2, SRP54, and SLC30A9. Among them, DLD, a mitochondrial enzyme, is essential for modulating mitochondrial energy metabolism patterns.24 Moreover, the suppression of EEF2 prevented the progression of Alzheimer's disease by regulating protein synthesis.25 In addition, the expression of RAB5A has been shown to be positively correlated with the formation and migration of filopodia in pancreatic cancer cells.26 SLC30A9 is required for Zn2+ homeostasis and mitochondrial physiology in neurodegenerative diseases.27 ROC and PR analyses of the top 10 shared genes were then conducted to assess their diagnostic effects for diseases. Our results presented that all of these genes have significant diagnostic value, with AUC values greater than 0.926 in the CP dataset and greater than 0.857 in the T2D dataset. In addition, we performed ROC curve analysis on these genes in validation datasets, and results indicated that the AUC values of EEF2, SEC61A1, DLD, RAB5A, and SLC30A9 were above 0.818 in the GSE123375 dataset. Similarly, the AUC values of RAB5A, DLD, SLC30A9, RPL8, EEF2, and RANBP2 were above 0.710 in the GSE20966 dataset. From the above results, it can be concluded that EEF2, DLD, RAB5A, and SLC30A9 have a better diagnostic significance in these diseases, which might become intervention targets for CP and T2D in the future.
To further explore the shared molecular mechanisms underlying diseases, TFs and miRNAs prediction were conducted using the NetworkAnalyst online database. TFs have been widely proven to hold a huge therapeutic potential in numerous human diseases by binding to DNA sequences, regulating β-cell function, driving cell differentiation, and controlling immune responses, etc.28, 29 miRNAs, on the other hand, have emerged as a promising therapeutic tool for diseases due to their powerful genetic regulatory properties.30 At present, clinical trials associated with miRNA have revealed promising results for the treatment of T2D and pancreatic cancer.31, 32 We screened out the top 10 TFs, including FOXC1, CREB1, NFKB1, RELA, MEF2A, NRF1, SRF, YY1, E2F1, and PPARG. The top 10 miRNAs were hsa-mir-193b-3p, hsa-mir-186-5p, hsa-mir-16-5p, hsa-mir-18a-5p, hsa-mir-320a, hsa-mir-342-3p, hsa-mir-423-5p, hsa-let-7a-5p, hsa-mir-877-3p, and hsa-mir-34a-5p. According to literature research, MEF2A, a critical indicator of glucose transport, was downregulated in T2D.33 Moreover, a case-control study showed that the NRF1 gene polymorphism increased the risk of T2D.34 As a regulator of the insulin gene, SRF is highly expressed in pancreatic β-cells and can mitigate the severity of acute pancreatitis by inhibiting NF-κB.35, 36 The gene mutations of E2F1 and PPARG were believed to be closely related to the risk of developing T2D.37, 38 Among the miRNAs, the plasma level of mir-193b-3p was found to be elevated in patients with T2D,39 while mir-18a-5p, mir-320a, and mir-34a-5p were considered to be strongly linked to pancreatic endocrine dysfunction.40-42 The impact of other miRNAs on CP and T2D still needs further exploration.
Furthermore, to clarify the common pathogenesis of CP and T2D from multiple dimensions, diseases targeting the shared hub genes were subsequently analyzed. Our results presented that these hub genes are largely associated with diseases such as NADH cytochrome B5 reductase deficiency, hyperuricemic nephropathy, spinocerebellar ataxia, inflammatory myofibroblastic tumor, and Shwachman syndrome. It has been confirmed that NADH cytochrome B5 reductase, a member of the NADPH reductase family located in the ER, hold a place of importance in maintaining the redox status of pancreatic β-cells, giving rise to the development of T2D and cancer.43, 44 Besides, in T2D, hyperuricemia was proved to be associated with insulin resistant and progression to overt nephropathy.45 Moreover, pancreatitis secondary to an inflammatory myofibroblastic tumor has been reported in a series of clinical cases, although the pathogenesis is still unclear.46 As a common cause of exocrine pancreatic insufficiency, Shwachman syndrome was confirmed closely related to CP and pancreatic cancer.47 Combined with the above findings, we can draw a conclusion that there are many similarities in the pathogenesis of these diseases with CP and T2D, which may provide valuable insights for further research in CP and T2D fields.
At last, we selected 10 candidate chemicals based on their degree values, including Cyclosporine, Enzyme Inhibitors, Valproic Acid, Aflatoxin B1, Methyl Methanesulfonate, Plant Extracts, Estradiol, Sodium Selenite, chloropicrin, and arsenic trioxide. According to literature evidence, both Estradiol and Sodium Selenite have been found to play significant beneficial roles in both CP and T2D, as supported by clinical and laboratory data,48, 49 which indicating that they may serve as potential interventional drugs for CP and T2D.
In conclusion, this study proposes the identification of crosstalk hub genes and pathological signatures to investigate the potential connection between CP and T2D in terms of gene targets, regulatory networks, signaling pathways, and chemical compounds, respectively. Among the shared hub genes, EEF2, DLD, RAB5A, and SLC30A9 were confirmed to have the highest diagnostic efficiency in CP and T2D datasets, which might serve as biomarkers for these diseases, offering new perspectives on accurate diagnosis and treatment for CP and T2D. Nevertheless, some limitations in this study must be acknowledged. First, as an open online resource, the data information in the GEO database has certain limitations, which may lead to biases in our subsequent bioinformatics analysis. Second, this study relied on different patient cohorts, and sample related information including patient age, sex, and comorbidities were not considered, which may have an impact on our results. Third, our findings need to be further confirmed through clinical and laboratory experiments, and a model of CP and T2D co-existing needs to be developed to better understand the potential co-pathogenesis and explore novel intervention targets for CP and T2D.
AUTHOR CONTRIBUTIONS
Youlan Chen: conceptualization; methodology; software; data curation; validation; formal analysis; visualization; resources; writing—original draft. Lixiao Hao: conceptualization; data curation; formal analysis; resources; validation; visualization; software; writing—original draft. Jun Cong: investigation; methodology; writing—review & editing; resources. Jianmei Ji: visualization; software; methodology. Yancheng Dai: data curation; formal analysis; writing—review & editing. Li Xu: software; validation; visualization. Biao Gong: conceptualization; supervision; writing—review & editing.
ACKNOWLEDGMENTS
We are very grateful to the authors of the GSE143754, GSE25724, GSE123375, and GSE20966 datasets. Data collection, analysis, and interpretation of this work were funded by National Natural Science Foundation of China (No. 82004305). The publication of this research was funded by the Shanghai Traditional Chinese and Western Medicine Clinical Collaboration Pilot Construction and Cultivation Project (No. ZY (2018-2020)-FWTX-1105).
CONFLICT OF INTEREST STATEMENT
The authors declare no conflicts of interest.
TRANSPARENCY STATEMENT
The lead author Biao Gong affirms that this manuscript is an honest, accurate, and transparent account of the study being reported; that no important aspects of the study have been omitted; and that any discrepancies from the study as planned (and, if relevant, registered) have been explained.
Open Research
DATA AVAILABILITY STATEMENT
The data that support the findings of this study are available from the corresponding author upon reasonable request. All data generated or analyzed during this study are included in this article/Supporting Information and can be requested from the corresponding author.


