Saliva-direct approach in the detection of SARS-CoV-2 in the lower-risk population in Colombia
1 INTRODUCTION
The ongoing coronavirus disease 2019 (COVID-19) pandemic requires population-wide surveillance testing to test for the presence of severe acute respiratory syndrome coronavirus 2 (SARS-CoV-2) virus.1 Quantitative reverse-transcription polymerase chain reaction (RT-qPCR) using nasopharyngeal samples has been used as the gold-standard of detection, but it requires trained personnel, sterilized swabs, RNA extraction, and causes discomfort in the patient being tested.2 As alternative upper respiratory tract samples such as saliva have proven to be reproducible and sensitive enough in detecting severe acute respiratory syndrome coronavirus 2 (SARS-CoV-2) and are part of the recommended options for testing according to the US Food and Drug Administration which granted accelerated emergency use authorization to an open source protocol known as Saliva-Direct.3 Among the advantages of this approach saliva can be self-collected, it is stable at different temperatures and does not require an RNA extraction step.4
Colombia with a population of around 48 million and 6,308,087 positive cases of COVID-19, as of October 12, 20225 highlights the need for surveillance testing. With the country's capacity of approximately 50,000 daily qPCR diagnostic tests, it is important to develop diagnostic methods that allow for easier sample collection and faster processing.6-9 The aim of this work was to validate and implement an adapted version of the Saliva-Direct protocol in an economically developing country.
2 MATERIALS AND METHODS
2.1 Patients and biological samples
The experimental protocol used for human sample collection was approved by the Institutional Ethics Committee at the ECCI University on December 11, 2020 under minutes number 006.
Samples collection took place from May 30–September 20, 2021. All 34 volunteers (94% in the age range below 65 years old) that agreed to participate had symptoms compatible with COVID or had direct exposure to a positive case at home. None developed critical cases or needed a hospital visit or stay.
At least half a milliliter of saliva was collected in 50 ml sterile corning tubes. No food consumption or tooth brushing was done in the hour preceding the sample collection. Once samples were collected at the volunteers’ home they were transported in ice and stored at −80°C until further processing which allowed for a workflow that could be accomplished in most scenarios.
2.2 Sample preparation
The Saliva-Direct protocol version was followed with small modifications. In short: to 8-strip 200 μl PCR tubes we added 6.25 μl of a 20 mg/ml stock of Proteinase K (New England Biolabs P8107S) and 4 μl of RNAsecure (Thermo Fisher AM7006). Frozen Saliva samples were thawed and vortexed until they were homogeneous. Subsequently, 50 μl of Saliva and 50 μl of TE buffer (Promega, V6231) were added to the PCR tubes containing Proteinase K and RNAsecure. Samples were then centrifuged and virus and proteinase K deactivated as described in Vogels.10 Samples were frozen at −80°C until further processing.
2.3 qPCR Saliva-Direct
Five microliters from the previously prepared saliva sample were added to a master mix that contained the Nucleoprotein 1 primers and the control primers for RNAse plus their as well as the reliance One-Step multiplex supermix (BioRad 12010176) as described.10 For the positive control 5 μl of Twist synthetic SARS-CoV-2 RNA control (Twist Biosciences MT007544.1) was added to each well at 100 copies/μl and for the negative control 5 μl of nuclease-free water. The qPCR protocol was followed for Saliva-Direct. Amplifications of the N1 target lower than 35 cycles were counted as positives after statistical analysis.
2.4 Statistical analysis
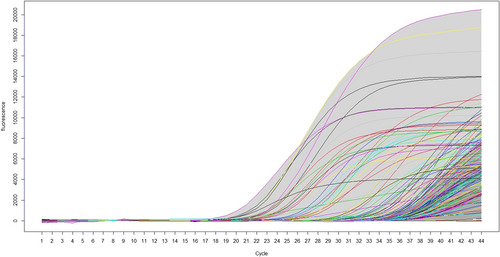
For this study, the results of each volunteer as well as controls in the Saliva-Direct process are presented as a curve, where the x-axis refers to the cycle count (Ct), in a range of 1–44 cycles and the y axis represents the values of fluorescence, with values between −53 and 20,000. We graphed 168 curves in total. For this representation, the non-parametric method presented in Ferraty is used.11 The functional bag diagram (fbagplot) is made, in which the median curve is observed in the inner region and outliers are presented in the outer region and are considered the positive results. The inner region is defined as the region bounded by all the curves corresponding to the points of the bag. Thus, 50% of the curves are in the interior region. The outer region is similarly defined as the region bounded by all curves, outliers are represented by curves of different colors. To carry out the characterization procedure of said values in the functional graphs, it is necessary to previously specify the coverage probability to determine the non-peripheral region. The default value is usually 95% corresponding to a significance level of α = 0.05. Statistical analyses were performed in R version 4.1.3 (R Core Team, 2022) and the Rainbow package version 6.0.312 was used to produce the figures. For this study, the results of each volunteer in the Saliva-Direct process are presented as a curve or functional data, smoothed using penalized splines as described in Hyndman & Ullah.13
3 RESULTS
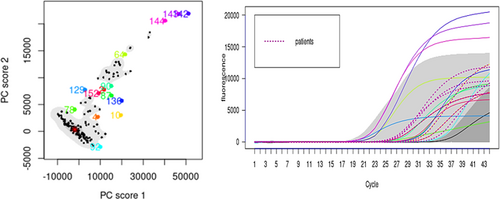
Functional data analysis currently corresponds to an attractive approach for the statistical study of complex experiments, in which the observations can be represented naturally by functions. For our case, the basic unit of information is the entire function observed instead of a chain of data. Particular behavior was tracked in the curves of the volunteers with positive results that would differentiate them from those with negative results, so the 168 curves are plotted with functional bagplot and higher density region (HDR) functional boxplot for outlier detection with the methodology presented in Hyndman and H. L. Shang.12 This methodology fully recognizes volunteers with negative tests and places them within the 95% bandwidth with high similarity behavior with a functional mean square error (FMSE) less than 10−2.
Results in Figure 1 show all curves we collected data for and in Figure 2 we only have the curves with atypical behavior (16 curves out of 168), the statistical analysis shows a confidence band of 95% for samples being positive. Those with functional outlier data are shown in Figure 2 in an HDR boxplot clearly showing positive patients or positive controls. The outliers detected in both plots coincide with the same results obtained by the fbagplot.


In Colombia the age group 20–29 and 30–39 reported the most cases in the city of Bogota.14 According to the literature the younger population tend to present a lesser mortality and lower incidence of symptomatic cases, but it is also the population with the most social interactions playing an important role in the spread of the virus.15-18 This highlights the need for surveillance in this population as already reported in previous studies where the presence of the virus was reported in saliva samples of asymptomatic carriers.19
4 CONCLUSION
We conclude that the Saliva-Direct approach is appropriate for surveillance of the SARS-CoV-2 virus in the low-risk population in Colombia if the threshold on cycle count for a positive is established in the testing lab using a functional analysis approach. We recommend establishing the actual negative threshold using this statistical approach to provide a more accurate diagnostic. In addition, this method could be useful for monitoring the epidemiology of the spread of the virus in settings such as universities and schools particularly when paired with sample pooling.20
AUTHOR CONTRIBUTIONS
Adriana Patricia Corredor-Figueroa: Conceptualization; data curation; funding acquisition; methodology; project administration; writing—original draft; writing—review & editing. Luz Angélica Parada: Formal analysis; investigation; methodology; resources; writing—review & editing. José Alexander Fuentes: Data curation; formal analysis; methodology; software; writing—review & editing. Judith Helena Prieto: Conceptualization; project administration; writing—original draft; writing—review & editing.
CONFLICTS OF INTEREST
The authors declare no conflicts of interest.
DECLARATION
All authors have read and approved the final version of the manuscript J. Helena Prieto had full access to all of the data in this study and took complete responsibility for the integrity of the data and the accuracy of the data analysis.
TRANSPARENCY STATEMENT
The lead author Judith Helena Prieto affirms that this manuscript is an honest, accurate, and transparent account of the study being reported; that no important aspects of the study have been omitted; and that any discrepancies from the study as planned (and, if relevant, registered) have been explained.
Open Research
DATA AVAILABILITY STATEMENT
The data that support the findings of this study are available on request from the corresponding author. The data are not publicly available due to privacy or ethical restrictions.


