Molecular determinants of peri-apical targeting of inositol 1,4,5-trisphosphate receptor type 3 in cholangiocytes
Abstract
Fluid and bicarbonate secretion is a principal function of cholangiocytes, and impaired secretion results in cholestasis. Cholangiocyte secretion depends on peri-apical expression of the type 3 inositol trisphosphate receptor (ITPR3), and loss of this intracellular Ca2+ release channel is a final common event in most cholangiopathies. Here we investigated the mechanism by which ITPR3 localizes to the apical region to regulate secretion. Isolated bile duct units, primary mouse cholangiocytes, and polarized Madin-Darby canine kidney (MDCK) cells were examined using a combination of biochemical and fluorescence microscopy techniques to investigate the mechanism of ITPR3 targeting to the apical region. Apical localization of ITPR3 depended on the presence of intact lipid rafts as well as interactions with both caveolin 1 (CAV1) and myosin heavy chain 9 (MYH9). Chemical disruption of lipid rafts or knockdown of CAV1 or MYH9 redistributed ITPR3 away from the apical region. MYH9 interacted with the five c-terminal amino acids of the ITPR3 peptide. Disruption of lipid rafts impaired Ca2+ signaling, and absence of CAV1 impaired both Ca2+ signaling and fluid secretion. Conclusion: A cooperative mechanism involving MYH9, CAV1, and apical lipid rafts localize ITPR3 to the apical region to regulate Ca2+ signaling and secretion in cholangiocytes.
INTRODUCTION
Bile is formed by transport of bile acids and other solutes across the canalicular membrane of hepatocytes, followed by fluid and bicarbonate secretion across the apical membrane of cholangiocytes.[1] Cholestasis may be due to impaired secretion at the level of hepatocytes, as occurs in endotoxemia, certain familial intrahepatic cholestasis syndromes, and certain types of drug-induced liver injury,[2] or at the level of cholangiocytes, as in primary sclerosing cholangitis (PSC), primary biliary cholangitis (PBC), biliary atresia, and alcoholic hepatitis.[3, 4]
In most types of epithelial cells, secretion is regulated by subapical calcium (Ca2+) signals.[5, 6] These signals stimulate secretion by mechanisms such as activation of exocytic machinery,[7] targeting and insertion of transporters into the apical membrane,[6] and opening plasma membrane ion channels.[8] These processes typically require local Ca2+ concentrations that would be toxic in most subcellular regions, but inositol 1,4,5-trisphosphate receptors (ITPRs) are concentrated in the subapical region in most polarized epithelia.[5, 9] This permits very high local Ca2+ concentrations, which in turn leads to selective activation of secretion machinery in this region.[4] In cholangiocytes, the principal ITPR isoform in the apical region and elsewhere is ITPR3,[5] and loss of it impairs fluid and bicarbonate secretion.[3] Moreover, ITPR3 expression is decreased in a variety of cholangiopathies, although different disorders lead to decreased ITPR3 expression through distinct mechanisms.[3, 10, 11] Little is known about why the other two ITPR isoforms, ITPR1 and ITPR2, are concentrated in the apical region of the cell types in which they are expressed,[12, 13] and virtually nothing is known about why ITPR3 is concentrated apically in cholangiocytes or in other epithelia in which it is expressed. To better understand the molecular basis for cholestasis, we investigated the factors that determine the apical localization of ITPR3 in cholangiocytes, and whether and how mislocalization of ITPR3 alters Ca+2 signaling and secretion.
MATERIALS AND METHODS
Isolation and culture of mouse bile duct units
Isolated bile duct units (IBDUs) were prepared from 8–10-week-old male C57BL/6J mice in the Cell Isolation Core Facility of the Yale Liver Center. Details about the methods used for isolation and phenotypic characterization have been described previously.[4, 14, 15] All animal studies were approved by the Yale University Institutional Animal Care and Use Committee under protocol No. 2018–07602. Briefly, mice were anesthetized with isoflurane and livers were perfused first with Hanks A medium, and then with Hanks B medium containing collagenase (Cat. #C0130; Sigma-Aldrich) and trypsin inhibitor (Cat. #17,075,029; Thermo Fisher Scientific) through the portal vein. Portal tissue residue was separated, digested, and filtered, and fragments between 30-μm and 100-μm diameter were plated onto Matrigel-coated coverslips (Cat. No. 354,234; Corning Inc.) and incubated at 37°C in a 95% O2/5% CO2 atmosphere in Alpha Essential Medium Eagle media supplemented with insulin, fetal calf serum, L-glutamine, gentamycin, penicillin, and streptomycin (Thermo Fisher Scientific).
Immunofluorescence in IBDUs
Immunofluorescence was performed as described previously.[4] Briefly, IBDUs were treated with or without 5 mm of methyl-beta-cyclodextrin (MβCD) (Cat. No. C4555; Sigma-Aldrich) for 30 min at 37°C, then fixed and permeabilized. After blocking, IBDUs were labeled with a rabbit polyclonal anti-ITPR3 (1:200; Cat. No. HPA003915;Sigma Aldrich), washed with phosphate-buffered saline (PBS), and incubated with an anti-mouse Alexa 488 (1:500; Thermo Fisher Scientific). For negative control, the primary antibody was omitted. IBDUs were double-labeled with TO-PRO-3 to observe nuclei (1:400; Cat. #T3605; Thermo Fisher Scientific). Specimens were excited at 488 nm and observed at 505–550 nm to detect Alexa 488 and excited at 633 nm and observed above 650 nm to detect TO-PRO-3. Images were collected using a Zeiss LSM 710 Confocal Microscope (Carl Zeiss).
Ca2+ measurements in IBDUs
Ca2+ experiments were performed 48 h after plating, using bile duct units with visible, sealed lumens. Cytosolic Ca2+ (Ca2+i) measurements were performed by time-lapsed confocal microscopy. To disrupt lipid rafts, IBDUs were treated with the cholesterol dispersing agent, 5 mm MβCD, for 30 min at 37°C, and controls were treated with vehicle (H2O), then incubated with 6 μm Fluo-4/AM (Cat. #F23917; Thermo Fisher Scientific) for 30 min at 37°C. Coverslips containing the dye-loaded tissue were transferred to a chamber on the stage of a Zeiss LSM 710 Confocal Microscope, perfused with a HEPES-buffered solution with or without 50 μm adenosine triphosphate (ATP) (Cat. #A6419; Sigma-Aldrich) to induce Ca2+ release. Ca2+i was monitored by excitation at 488 nm and detection at >515 nm at a rate of approximately 1 frame/s using a ×40 water immersion objective. Changes in fluorescence (F) were normalized by initial fluorescence (F0) and are expressed as (F/F0) × 100%. The rise time of the Ca2+ signal was calculated as the time in seconds between 25% and 75% of the maximal Ca2+ response.[4, 9]
Ca2+ and apical secreted liquid in polarized cholangiocytes
Wild-type (WT) and CAV1KO cholangiocytes were cultured in Transwell inserts until fully polarized, and confirmed by transepithelial resistance measurements. For Ca2+ measurements, cells were transfected with an adenovirus vector encoding the fluorescent Ca2+ sensor GCamp6f (Cat #1910; Vector Biolabs). Two days following transfection, ATP-induced Ca2+ signals were imaged at three successive focal planes corresponding to the apical, midpoint, and basal pole of the cells. Cells were imaged on a Bruker Opterra Swept-Field confocal microscope at ×40 magnification at a frequency of 100 Hz. Cells were excited at 488 nm, and emission was collected at 5 > 05 nm by an EMCCD camera. Fluorescence was normalized as described previously.
Fluid secretion was measured by changes in ASL as described previously.[16] Polarized WT and CAV1KO cells were loaded with the plasma membrane dye CellMask Orange (Cat. #C10045; Thermo Fisher Scientific) for 15 min at 37°C, followed by addition of 20 ml FITC Dextran-4000 MW (Cat. #D1844; Thermo Fisher Scientific) to the apical side, which was then layered with 80 ml of the inert oil Fluorinet FC70 to prevent evaporation (Cat. #F9880; Millipore Sigma) for 30 min. To induce cyclic adenosine monophosphate (cAMP) formation, Forskolin (FSK; Cat. #F6886; Sigma Aldrich) and 3-Isobutyl-1-methylxanthine (IBMX; Cat. #I5879; Sigma Aldrich) were added basolaterally for 30 min at 50 mm and 10 mm, respectively. Next, five z-stacks per insert were collected at ×40 magnification on a Zeiss LSM 710 confocal microscope, and the apical surface liquid (ASL) area was quantified in xz or yz slices using ImageJ.
MDCK and Cos-7 cell culture
MDCK II or Cos-7 cells (ATCC) were cultured at 37°C in 5% CO2 in Dulbecco's modified Eagle's medium with high glucose (Thermo Fisher Scientific) containing 10% fetal bovine serum, 1 mm sodium pyruvate, 100 units/ml penicillin, and 100 μg/ml streptomycin (Thermo Fisher Scientific).
ITPR3 C-terminal constructs
The C-terminal fragment of the human ITPR3 (2357–2671 aa, accession No. Q14573) was ordered from IDT as a synthetic gene and then subcloned in pmCherry-C1 (Cat. #632524; Takara Bio USA, Inc.). Plasmids were digested with AgeI and BamH1, purified, ligated, and sequenced. This mCherry-ITPR3-C-term construct was used as a template to yield the C-terminal segment lacking the last five aa (mCherry-ITPR3-C-term-5aa).
Immunofluorescence
Confocal and superresolution immunofluorescence were performed as described previously.[17] Briefly, MDCK cells were labeled with mouse monoclonal anti-ITPR3 (1:200; Cat. #610313; BD Biosciences), mouse monoclonal anti–zona occludens 1 (ZO-1) conjugated to Alexa-647 (1:200; Cat. #MA3-39100; Thermo Fisher Scientific), rabbit polyclonal anti–myosin heavy chain 9 (MYH9) (1:200, Cat. #PA5-17025; Thermo Fisher Scientific), and rabbit polyclonal anti-Caveolin 1 (1:100; Cat. #PA5-17447; Thermo Fisher Scientific). These antibodies were incubated with secondary antibodies conjugated to Alexa Fluor 488 or 546 (1:1000; Thermo Fisher Scientific). Hoechst 33342 (1 μg/ml; Cat. #H3570; Thermo Fisher Scientific) was used as a nuclear marker. Images were collected using a Zeiss 880 Airyscan microscope using a ×63, 1.4 NA objective lens. Images were processed using Zeiss ZEN software.
Transfection
MDCK cells were transfected with 1 μg or 2 μg mCherry-ITPR3-C-terminus or mCherry-ITPR3-C-terminus-5aa plasmids using Lipofectamine 2000 (1:3), according to the manufacturer's instructions (Cat. #11668019; Thermo Fisher Scientific). Then, cells were selected with 700 μg/ml of Geneticin (Cat. #10131027; Thermo Fisher Scientific) after 48 h. To select for cells with similar expression levels, cells were sorted by BD FACSAria II. For immunoprecipitation (IP), immunoblot, or immunofluorescence analysis, cells were plated in 6-well plates on collagen-coated coverslips (Cat. #354089; Corning). Cos-7 cells were co-transfected with BFP-KDEL plasmid (Plasmid #49150; Addgene) to confirm endoplasmic reticulum (ER) localization of the constructs.[18, 19]
Primary mouse cholangiocyte isolation and culture
Mouse cholangiocytes were isolated from 8–10-week-old male C57BL/6J WT mice and cultured as previously described.[16] Briefly, microdissected intrahepatic bile ducts were used to obtain WT or CAV1-knockout cholangiocytes.[20] Cells were cultured on rat-tail collagen and subcultured when confluent. Cells were used up to the eighth passage.
IP and western blot
IPs were done as described previously.[21] MDCK cells and primary mouse cholangiocytes were lysed in buffer containing 1% Triton X-100, 150 mm NaCl, 10 mm Tris–HCl pH 7.5, 1 mm ethylene diamine tetraacetic acid, 1 mm ethylene glycol tetraacetic acid, 0.5% NP-40, 10% sucrose, and with protease and phosphatase inhibitor cocktail (Cat. #78445; Thermo Fisher Scientific) at 4°C for 30 min. In the CAV1 IP, 60 mm of n-octyl-D-glucopyranoside (Cat. #O3757; Sigma Aldrich) was included in the lysis buffer. Lysates were centrifuged for 20 min at 18,000 g to pellet the insoluble fraction. Soluble fractions were collected, and 500 μg/ml of lysates was incubated with 5 μg/ml ITPR3 antibody (BD Biosciences) for 1 h at 4°C. Protein A/G magnetic agarose beads (Cat. #78609; Thermo Fisher Scientific) was added to each sample. The protein lysate and beads were incubated at 4°C under rotary agitation for 4 h. Beads were pelleted using a magnetic stand and washed in PBS. Proteins were resolved in 4%–20% sodium dodecyl sulfate–polyacrylamide gel electrophoresis (SDS-PAGE), and immunoblots were performed[17] using mouse monoclonal anti-ITPR3 (1:200; Cat. #610313; BD Biosciences), rabbit polyclonal anti-MYH9 (1:1000; Cat. #PA5-17025; Thermo Fisher Scientific), rabbit polyclonal anti-caveolin 1 (1:1000; Cat. #PA5-17447; Thermo Fisher Scientific), and mouse monoclonal anti-αTubulin (1:2000; Cat. #T6199; Sigma-Aldrich). Membranes were developed using ECL Western Blotting Substrate (Cat. #32209; GE Healthcare Life Sciences), and films were scanned and analyzed using ImageJ software (http://rsbweb.nih.gov/ij/). Antibodies for MYH9 and CAV1 were validated with at least two specific small interfering RNAs (siRNAs).
Mass spectrometry
Mass spectrometry (MS) was performed at Yale's Keck Laboratory, as described previously.[22, 23] WT MDCK cells, primary mouse cholangiocytes, mCherry-ITPR3-C-term, and mCherry-ITPR3-C-term-5aa expressed in MDCK cells were immunoprecipitated using mouse anti-ITPR3 or rabbit anti-mCherry (Cat. #PA5-34974; Thermo Fisher Scientific). IPs were collected, fractionated by SDS-PAGE, and visualized with Coomassie blue (Cat. #B8647; Sigma Aldrich). Gel bands were cut and submitted to Gel Protein ID proteomic analysis. Products were digested and fractionated by high-performance liquid chromatography interfacing an electrospray ionization quadrupole time-of-flight mass spectrometer. Tandem mass spectrometry (MS-MS) spectra were searched using the Mascot algorithm (www.matrixscience.com).[24] A protein was considered identified when there are two or more peptide matches, each with Mascot ion score > 30. The National Center for Biotechnology Information database was used. MS data were analyzed using Scaffold Q+/Q+S Software version 4.0 (www.proteomesoftware.com).[23]
siRNA transfection
Polarized MDCK cells for 10 days in culture were transfected on day 7 using Lipofectamine RNAiMAX reagent (Thermo Fisher Scientific) as described previously.[17, 25] A total of 50 nm siRNAs were used for MYH9 or CAV1 knockdown. CAV1 sequence 13.6 5′-AAGAUGUGAUUGCAGAACCAGAAGG-3′ was from Integrated DNA Technologies (IDT; Cat. #210380101); myosin-9 sequence 13.5 5′-GGAGCCAACAUUGAGACUUAUCUTC-3′ was from IDT (Cat. #258431039); myosin-9 sequence 201 5′-CGUCAAGUCCAAGUACAAAtt-3′ was from Life Technologies (Cat. #s553201); and sequence 202 5′-GUAUCUCUAUGUGGAUAAAtt-3′ was from Life Technologies (Cat. #s553202). A total of 50 nm of the following nontargeting siRNAs were used as negative controls: Silencer Select Negative Control No. 2 siRNA (control siRNA 1; Cat. #4390846; Life Technologies) and IDT Scrambled negative control DsiRNA (control siRNA 2; 5′-CUUCCUCUCUUUCUCUCCCUUGUGA-3′; Cat. #51011908). Further analysis was performed 72 h after transfection.
RNA extraction and quantitative polymerase chain reaction analysis
Total RNA was extracted from liver tissues or cells using the RNeasy Mini Kit (Qiagen). The reverse-transcription reaction was performed with 1 μg of total RNA using iScript complementary DNA synthesis according to manufacturer's instructions (BioRad), and relative messenger RNA (mRNA) expression of selected genes was quantified with Taqman primers for mouse ITPR3 or canine MYH9 in an ABI 7500 real-time polymerase chain reaction (PCR) system (Thermo Fisher). Expression levels were normalized with reference genes 18S and HPRT (hypoxanthine-guanine phosphoribosyl transferase) and analyzed using the 2(−ΔΔCt) method.[26]
IBDU from CAV1 knockout mice
The caveolin-1 null (CAV1 KO) mouse model was generated by homologous recombination as previously described.[20] IBDUs were prepared from 8–10-week-old male C57BL/6J control or CAV1 KO mice as described previously. The isolated IBDUs were used for immunofluorescence or immunoblot, as described previously.
Immunofluorescence in formalin-fixed, paraffin-embedded-tissue
Immunofluorescence in formalin-fixed, paraffin-embedded (FFPE) tissue was performed as previously described.[27] Tissue sections from WT or CAV1 KO mice were dewaxed, rehydrated, and unmasked in trilogy solution (Cell Marque) using a steamer (95°C) for 20 min, then rinsed in PBS (137 mm NaCl, 2.7 mm KCl, and 10 mm phosphate buffer solution, pH 7.4) (Sigma-Aldrich), and then incubated in PBS containing 0.2% Triton X-100 (Cat. #T9284; Sigma-Aldrich) for another 20 min and blocked in PBS containing 1% bovine serum albumin (Sigma-Aldrich) for 30 min. Antibody incubation for anti-ITPR3, anti-cytokeratin-19 (Cat. #AB_2133570; DSHB), was performed as described previously. Primary antibodies were omitted for negative controls. Images were collected using a Zeiss LSM 880 confocal microscope using an oil ×40 1.3 NA objective. ZEN software was used to quantify fluorescence.
Statistical analysis
Results are presented as mean ± SD or ± SEM. Data were analyzed using GraphPad Prism 8 and Microsoft Excel. Differences between experimental groups were assessed for significance using Student's t test or one-way analysis of variance followed by Bonferroni post-hoc tests. Statistical significance was defined as p < 0.05.
RESULTS
ITPR3 is apical in cholangiocytes, and disruption of lipid rafts redistributes ITPR3 and impairs Ca2+ waves
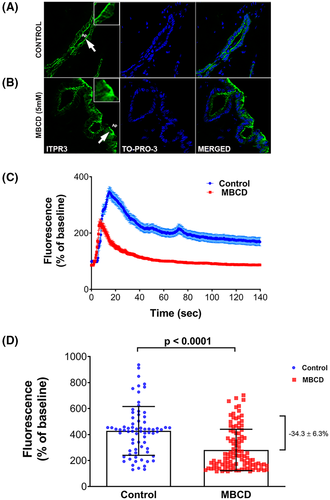
Disruption of lipid rafts redistributes ITPR2 from the apical region in hepatocytes,[28] so we examined whether lipid rafts play a similar role in targeting of ITPR3 in cholangiocytes. Lipid rafts were disrupted in IBDUs by treatment with the cholesterol-dispersing agent methyl-beta-cyclodextrin (MβCD) (5 mm; 30 min at 37°C). This led to the redistribution of ITPR3 from the apical region to a more diffuse cytoplasmic localization (Figure 1A). Analysis of the effect of MβCD treatment on Ca2+ signaling showed reduced amplitude of ATP-induced Ca2+ transients (Figure 1B,C). These results are consistent with the idea that lipid rafts in cholangiocytes are needed to maintain ITPR3 in proximity to the apical membrane, which in turn establishes Ca2+ waves in these cells.
ITPR3 is apical in MDCK cells, and the C-terminus is responsible for apical targeting
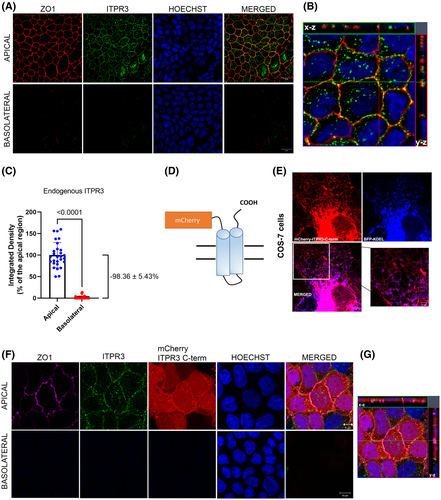
To investigate the molecular mechanisms responsible for apical localization, MDCK cells were used because this cell line has several characteristics in common with cholangiocytes. Both are epithelial cells that form adherens junctions, tight junctions, and primary cilia, and ITPR3 is the most abundant ITPR isoform in both cell types.[5, 29, 30] MDCK cells were cultured in trans-wells, as this system allows for full polarization, which was confirmed by measurements of transepithelial resistance and visual microscopic inspection. The distribution of ITPR3 was observed by confocal immunofluorescence after 10 days in culture. It was mostly concentrated near the plasma membrane in the vicinity of the tight junction-associated protein ZO-1 and sparsely distributed along the rest of the apical membrane (Figure 2A). This clustering of ITPR3 at the apical pole and in proximity to ZO-1 in MDCK cells was also visualized in x-y and x-z projections (Figure 2B). The relative subcellular distribution of endogenous ITPR3 was measured by comparing ITPR3 in the apical and basolateral region. ITPR3 in the apical region accounted for most of the ITPR3 in polarized MDCK cells (98.36 ± 5.43%, p < 0.0001) (Figure 2C). There is significant variability in the C-terminal amino acids among the three ITPRs isoforms, especially in the five most c-terminal residues, so we hypothesized that this region contains isoform-specific targeting information. To test this hypothesis, we fused the C-terminus of mCherry to the two last transmembrane domains of ITPR3 to create the construct mCherry-ITPR3-C-term (Figure 2D). First, we investigated the distribution and subcellular localization of the mCherry-ITPR3-C-term. Cos-7 cells were used because this cell line has an expansive tubular ER network that facilitates live cell imaging of this organelle. This cell line was co-transfected with the mCherry-ITPR3-C-term construct and blue fluorescent protein (BFP) with a KDEL sequence peptide, thus functioning as an ER marker. mCherry-ITPR3-C-term and BFP-KDEL exhibited similar subcellular reticular localization, confirming ER targeting of the mCherry-ITPR3-C-term construct (Figure 2E). Next, a MDCK cell line that stably expresses mCherry-ITPR3-C-term was generated to examine whether this segment of the protein is responsible for apical targeting of ITPR3. The mCherry-ITPR3-C-term–fused protein showed a similar localization to the endogenous ITPR3 at the apical region that also coincided with ZO-1 localization, as observed by superresolution microscopy (Figure 2F). Orthogonal projections confirmed that endogenous ITPR3 and mCherry-ITPR3-C-term were similarly localized to the apical region (Figure 2F,G) and are mostly absent of the basolateral region. Together, these results demonstrate that the C-terminus of ITPR3 contains apical targeting information.
ITPR3 interacts with MYH9 and CAV1 in polarized epithelia
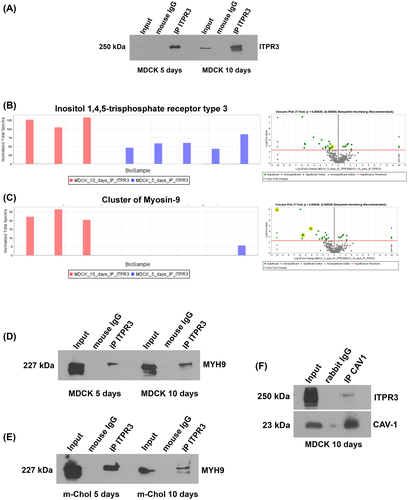
Next, proteomic analysis was performed to identify potential interacting partners of ITPR3 that determine its apical localization. First, endogenous ITPR3 was immunoprecipitated in polarized (10 days in culture) and semipolarized (5 days in culture) MDCK cells, as well as in nonpolarized (1 day in culture) cells, followed by western blot analysis. This method showed that the monoclonal antibody used successfully immunoprecipitated ITPR3 in MDCK cells (Figure 3A). No ITPR3 was observed in the control immunoglobulin G groups. IP products were subject to MS, which showed that ITPR3 in MDCK cells is more abundant after 10 days in culture than after 5 days (Figure 3B). MYH9 was the most enriched protein in the ITPR3 immunoprecipitant in fully polarized MDCK cells, when compared with either nonpolarized or partially polarized cells (Figure 3C). The top protein candidates comparing immunoprecipitant from MDCK cells in culture for 10 days versus 5 days or 1 day are listed in Tables 1 and 2, respectively. Next, co-IP of ITPR3 and MYH9 confirmed this interaction in MDCK cells (Figure 3D) as well as in mouse cholangiocytes (Figure 3E). CAV1 was also identified as an interacting partner of ITPR3 in the mass spectrometry results. Although no difference was observed in the amount of CAV1 in MDCK cells in culture for 5 or 10 days (data not shown), co-IP confirmed the interaction between CAV1 and ITPR3 in these cells (Figure 3F). Together these results demonstrate that MYH9 and CAV1 bind to ITPR3 in polarized epithelia and suggest that they may play a role in the targeting of this receptor.
| Protein name | Accession No. | Molecular weight | t Test (p value) *p < 0.001 |
|---|---|---|---|
| Myosin-9 | F1P9J3_CANLF | 226 kDa | <0.00010 |
| Unconventional myosin-Id | MYO1D_CANLF | 116 kDa | <0.00010 |
| Calcium/calmodulin-dependent protein kinase II delta | E2RR74_CANLF | 60 kDa | 0.00041 |
| Protein 4.1 OS | 41_CANLF | 91 kDa | 0.00080 |
| RAB 11 family interacting protein 5 OS | F1PTR8_CANLF | 70 kDa | 0.0015 |
| Protein name | Accession No. | Molecular weight | t Test (p value) *p < 0.001 |
|---|---|---|---|
| Myosin-9 | F1P9J3_CANLF | 226 kDa | <0.00010 |
| Unconventional myosin-Id | MYO1D_CANLF | 116 kDa | <0.00010 |
| Granulin precursor | E2RHN1_CANLF | 62 kDa | <0.00010 |
| Protein disulfide isomerase family A | F1PAN3_CANLF | 60 kDa | 0.00078 |
| Transcription elongation factor A3 | E2RIY6_CANLF | 39 kDa | 0.00056 |
The last five amino acids of ITPR3 C-terminus interact with MYH9
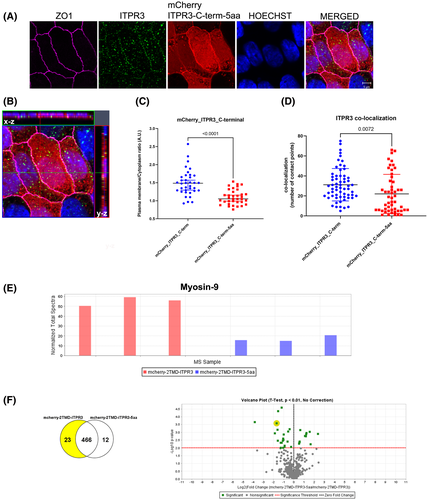
Certain proteins that are targeted to the apical membrane, such as those containing PDZ domains, typically recognize five residues of the C-terminal tail of its partners.[31] Therefore, a stable MDCK cell line expressing the mCherry-ITPR3 C-term lacking the last five amino acids (mCherry-ITPR3-C-term-5 aa) was developed to investigate the importance of these residues for ITPR3 apical localization and binding to MYH9. The mCherry-ITPR3 C-term was most concentrated near the apical membrane, whereas the construct lacking the five last aa's was less concentrated there, as shown by superresolution imaging (Figure 4A), orthogonal projections (Figure 4B), and quantification of the plasma membrane over cytosolic fluorescence of these two constructs (Figure 4C). Similarly, endogenous ITPR3 co-localized more strongly with the full-length c-terminus construct (Figure 4D). Next, proteomic analysis of the immunoprecipitant was used to compare proteins that interact with mCherry-ITPR3-C-term and mCherry-ITPR3-C-term-5aa in polarized MDCK cells. More MYH9 was bound to mCherry-ITPR3-C-term than to the construct lacking the last five amino acids (Figure 4E). The normalized total spectra confirmed this finding (Figure 4F). The five leading protein candidates identified by the proteomic analysis comparing MDCK cells expressing mCherry-ITPR3-C-term with mCherry-ITPR3-C-term-5aa are listed in Table 3. Together these results suggest that the last five amino acids of the ITPR3 C-terminus are necessary for interaction with MYH9.
| Protein name | Accession No. | Molecular weight | t Test (p value) *p < 0.01 |
|---|---|---|---|
| Myosin-9 | F1P9J3 | 226 kDa | 0.00027 |
| ATP-dependent 6-phosphofructokinase OS | F1Q359 | 85 kDa | 0.0011 |
| Cleavage and polyadenylation specific factor 6 | F1PGL4 | 61 kDa | 0.0017 |
| Myosin VI | E2QUR8 | 145 kDa | 0.0035 |
| Protein transport protein sec 16 | J9P7N1 | 161 kDa | 0.0039 |
CAV1 or MYH9 knockdown displaces ITPR3 from the apical region of MDCK cells
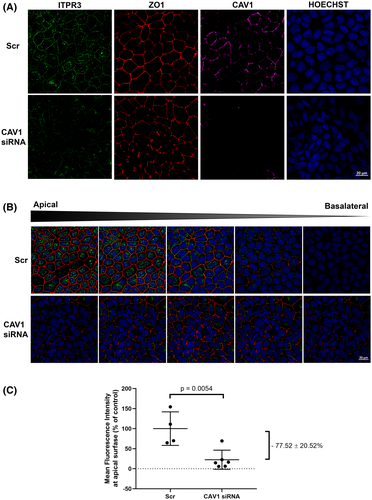
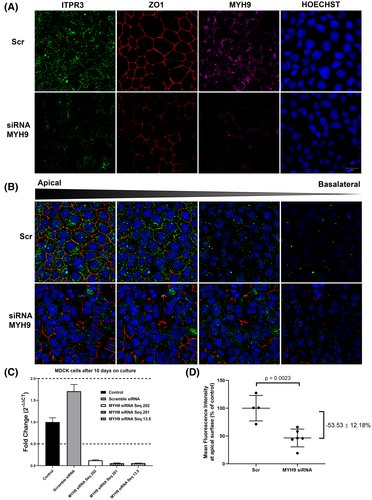
The role of CAV1 and MYH9 in the apical localization of ITPR3 was investigated in several ways. First, CAV1 was knocked down with siRNAs (Figure S1A,B). ITPR3 protein expression displayed a trend toward reduction (~25%) after CAV1 knockdown on WT-MDCK cells cultured for 10 days by western blot; however, this decreased expression did not achieve statistical significance (p = 0.1744) (Figure S1C). However, CAV1 knockdown reduced ITPR3 in the apical region by 77.5 ± 20.5% (p = 0.0054) (Figure 5A,C). Next, the effect of MYH9 knockdown on ITPR3 localization was investigated. Confocal immunofluorescence showed that apical expression of endogenous ITPR3 was similarly reduced by 53.5 ± 12.2% (p = 0.0023) (Figure 6A,D). These results provide evidence that both MYH9 and CAV1 play a role in localizing ITPR3 to the apical region of MDCK cells.
Apical ITPR3 expression is reduced in bile ducts from CAV1 knockout mice
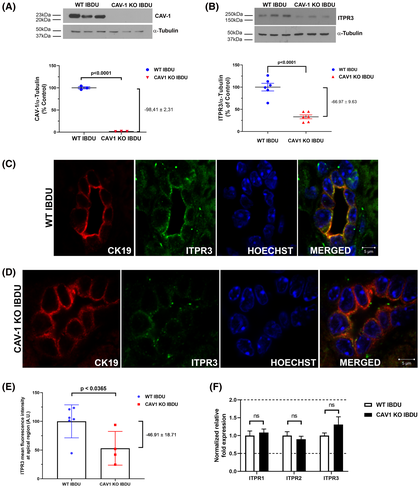
To understand the generalizability of these findings, IBDUs were isolated from WT and CAV1 KO mice. Only these KO mice were examined, because MYH9 KO mice die in utero due to defects in heart and brain development.[32] The CAV1 knockout was confirmed in IBDUs by western blot (Figure 7A). ITPR3 expression was decreased by 98.4 ± 2.3% (p < 0.0001) in IBDUs isolated from CAV1 KO mice relative to WT IBDU (Figure 7B). Confocal imaging furthermore demonstrated reduced ITPR3 localization at the apical region of IBDUs from CAV1 KO, when compared with IBDUs from WT mice (Figure 7C,D). ITPR3 expression at the apical region was reduced by 46.9 ± 18.7% (p < 0.05) in CAV1 KO IBDUs (Figure 7E). This reduction in ITPR3 protein expression in CAV1KO mice was not likely due to transcriptional regulation, as quantitative PCR analysis revealed no difference in mRNA levels of all ITPR isoforms (Figure 7F). These results provide evidence that CAV1 is important for apical localization of ITPR3 in cholangiocytes, just as it is in MDCK cells.
Ca2+ signaling and secretion are impaired in mouse cholangiocytes lacking CAV1
Apical Ca2+ signals are important for Ca2+ waves [5] and secretion,[4] so we investigated whether CAV1 KO cholangiocytes have impaired Ca2+ signaling. Polarized preparations of WT and CAV1 KO cholangiocytes expressing the fast Ca2+ sensor GCamp6f were imaged at three focal planes (apical, midsection, and basal) following stimulation with ATP. The amplitude of the Ca2+ signal in each focal plane was lower in CAV1 KO when compared with WT cells (Figure 8A,B). Additionally, Ca2+ signals in WT cells displayed a trend toward starting at the apical pole more frequently when compared with the CAV1 KO cells (Figure 8C). These results are consistent with the notion that apical to basolateral Ca2+ signaling in polarized cholangiocytes depends on CAV1.
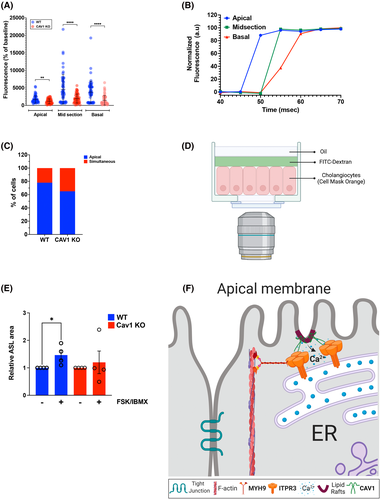
Next, the functional role of CAV1 in cholangiocyte secretion was assessed in a modified fluid secretion assay.[16] In these studies, the expansion of a layer of extracellular fluorescent dextran on the apical surface of polarized cholangiocytes was used to reflect fluid secretion (Figure 8D). The ASL area was significantly increased in WT cells treated with a cAMP cocktail (forskolin + IBMX), which promotes bicarbonate and fluid secretion in cholangiocytes.[4] However, this treatment failed to promote ASL area expansion in CAV1 KO cholangiocytes (Figure 8E). These results support the idea that the presence of CAV1 to ensure the proper localization of ITPR3 plays a role in apical fluid secretion in cholangiocytes (Figure 8F).
DISCUSSION
The generation of highly localized apical Ca2+ signaling depends on ITPRs that cluster on a specialized domain of the ER near the apical plasma membrane in multiple epithelial cells, including hepatocytes[33] and pancreatic acinar cells.[34] In those cell types, these apical Ca2+ signals regulate bile solute transport[2, 6] and zymogen granule exocytosis and chloride secretion, respectively.[35] Similar to other epithelial cells, Ca2+ signaling in cholangiocytes occurs as Ca2+ waves that begin in the apical region, where ITPR3 is most concentrated.[4, 5] Many factors are responsible for cell polarization and receptor distribution across the plasma membrane. One such factor is the distinct lipid composition of the apical membrane in polarized epithelial cells.[36, 37] For example, PIP2 localizes primarily to the apical membrane in these cells.[38] Lipid rafts are enriched in PIP2 and have been shown to function as signaling hubs at the plasma membrane.[39] The present work provides evidence that disruption of lipid rafts displaces and redistributes ITPR3 toward the basolateral membrane, with consequent impairment of Ca2+ wave formation. Previous work demonstrated that lipid rafts are responsible for the peri-apical accumulation of ITPR2 that generates Ca2+ waves in hepatocytes and pancreatic acinar cells.[28] This work relates to that observation by showing that CAV1 is one of the ITPR3-interacting proteins responsible for its peri-apical targeting. This may relate to the role of CAV1 in endothelial cells, in which it has been reported that the CAV1 scaffold domain interacts with ITPR3 and the transient receptor potential canonical channels (TRPCs) to regulate Ca2+ store release–induced Ca2+ entry.[40] Experiments in CAV1-KO mice demonstrated that CAV1 is crucial for the subcellular distribution of TRPCs and impaired Ca2+ entry in endothelial cells.[41] Here, we found that CAV1 and ITPR3 interact in multiple types of epithelia, and that this may be relevant for Ca2+ signaling and fluid secretion.
MYH9 is a regulator of ITPR localization. This protein is ubiquitously expressed, and its absence is embryonic lethal due to loss of endoderm polarization.[32, 42] The finding that MYH9 is a targeting partner of ITPR3 highlights the importance of the actin filament network in this process, because two other actin-binding proteins, 4.1 N and KRAP, also regulate apical targeting of ITPRs in polarized epithelia.[13, 43] The current work also provides evidence that a specific region of the ITPR3 polypeptide, namely the five most C-terminal amino acids, is required for its interaction with MYH9 for apical targeting. This may be unique to ITPR3, because ITPR1 requires its 14 most c-terminal amino-acids to bind to protein 4.1 N.[12] Binding of KRAP to ITPR instead relies on the N-terminal region (1–610 aa), which maps to the isoform-conserved region corresponding to the suppressor domain and ligand binding core of ITPRs.[13] The unique binding properties of MYH9 and ITPR3 might be of particular importance to the biology of cholangiocytes. Indeed, the interaction of MYH9 and ITPR3 might have clinical relevance, as nearly 30% of patients with MYH9-related disease, an autosomal dominant genetic syndrome, have elevated gamma-glutamyl transferase enzyme levels, which indicates cholangiocyte injury and cholestasis.[44] Further work should elucidate whether MYH9 is a target in the pathogenesis of several other cholestatic diseases such as PBC and PSC.
Certain ITPR isoforms, including ITPR3, can interact with polycystin-2 (PC2), which is an important constituent of primary cilia.[45] Therefore, the question of whether ITPR3 localization is regulated by the presence of primary cilia is especially relevant in cholangiocytes, because primary cilia are important for regulation of fluid secretion in cholangiocytes. Work in other cell systems has shown that primary cilia have localized Ca2+ signaling.[46] However, these signals are not mediated by ITPRs; instead, they are controlled by an heteromeric member of the transient receptor potential family (TRP) composed of the proteins PKD1L1–PKD2L1. Moreover, these Ca2+ signals are restricted to the cilium and do not trigger or alter cytosolic Ca2+ signals. These findings argue against a potential physical and functional interaction between ITPR3 and cilia-resident proteins, and to our knowledge, an interaction between ITPR3 and cilia resident proteins has not been reported. On the other hand, previous work in kidney epithelial cells showed that PC2, a member of the TRP family of ion channels that localizes to both the primary cilium and ER membrane, interacts with both ITPR1[47] and ITPR3.[45] Although these interactions are important for ITPR1-mediated and ITPR3-mediated Ca2+ signals,[45] these interactions involve ER-resident PC2 and not PC2 that are in primary cilium. Because PC2 is expressed in cholangiocytes,[48] it could potentially interact with and modulate ITPR3 localization or activity. However, PC2 was not among the proteins that co-immunoprecipitated with ITPR3 in our proteomic analysis of polarized MDCK cells. Therefore, it would not be predicted that absence of primary cilia in these cells would impact the current observations regarding ITPR3 subcellular localization.
Our data provide evidence that both MYH9 and CAV1 are important for the apical localization of ITPR3 in polarized epithelia. However, it is unclear whether these interacting partners bind to ITPR3 simultaneously or sequentially. MYH9 is important for cell adhesion, migration, and maintenance of tissue architecture.[49] It can dimerize and form myosin bundles with contractile activity following interaction with actin fibers. Although subcellular localization of MYH9 in liver cells is not fully characterized, a sequential binding model would suggest that MYH9 binds newly synthesized ITPR3 molecules to bring them to the apical domain of cholangiocytes. Once there, ITPR3 could bind to CAV1, which resides in lipid rafts on the apical plasma membrane. Alternatively, MYH9 and CAV1 might bind ITPR3 simultaneously at the apical pole of cholangiocytes to maintain this Ca2+ channel in proximity to the apical membrane (Figure 8F). This alternative would agree with data demonstrating that MYH9 is important for the maintenance of epithelial polarity via regulation of tight and adherens junctions in colonic epithelia.[50]
In summary, the data presented here demonstrate that apical localization of ITPR3 in cholangiocytes depends on lipid rafts, CAV1 and MYH9. MYH9 binding occurs at the C-terminal domain of ITPR3 and depends on the last five amino acids of the C-terminal tail. These findings provide an integrated view of the factors that are important for apical localization of ITPR3 in bile duct epithelial cells and their relevance for fluid and solute secretion in polarized epithelia.
AUTHOR CONTRIBUTIONS
Study concept, design, and manuscript draft: Michael H. Nathanson and Michele A. Rodrigues. Experiments: Michele A. Rodrigues. Data analysis: Michele A. Rodrigues, Dawidson A. Gomes, and Mateus T. Guerra. ITPR3 C-terminal construct and siRNA design: Dawidson A. Gomes. Manuscript preparation: Dawidson A. Gomes and Mateus T. Guerra. Primary m-Chol isolation and culture: Romina Fiorotto. Assistance with the mouse cholangiocytes: Romina Fiorotto and Mario Strazzabosco. Critical reagent contributions: Mario Strazzabosco. Mouse cholangiocyte calcium and secretion experiments: Mateus T. Guerra. Immunofluorescence of IBDUs treated with MβCD: Jittima Weerachayaphorn. Assistance with the CAV1-KO mice experiments: William C. Sessa and Tao Bo.
ACKNOWLEDGMENT
The authors thank Jean Kanyo from the Yale W. M. Keck Foundation Biotechnology Resource Laboratory for assistance with proteomics; Kathy Harry from the Cell Isolation Core Facility of the Yale Liver Center (P30 DK34989) for animal surgery assistance; and BioRender.com for the tools used to create Figure 8D,F.
FUNDING INFORMATION
Supported by the Gladys Phillips Crofoot Professorship and grants from the National Institutes of Health (P01 DK57751, P30 DK34989, R01 DK114041, R01 DK112797, R01 AA028765, and S10 OD023598); FAPEMIG; and CNPq.
CONFLICT OF INTEREST
The authors declare no competing financial interests.


