Taurine up-regulated gene 1 functions as a master regulator to coordinate glycolysis and metastasis in hepatocellular carcinoma
Potential conflict of interest: Nothing to report.
Supported by grants from Chang Gung Memorial Hospital, Taoyuan, Taiwan (CMRPD1D0381, CMRPD1D0382, CMRPD1D0383; NMRPD1D1011, NMRPD1D1012, NMRPD1D1013; NMRPD1D1021, NMRPD1D1022, NMRPD1D1023 to K.H.L.) and from the Ministry of Science and Technology (MOST) of the Republic of China (MOST 103-2320-B-182-017-MY3 and 103-2320-B-182-018-MY3, to K.H.L; MOST 104-2811-B-182-011 and 105-2811-B-182-011 to Y.H.L.). We thank the Taiwan Liver Cancer Network for providing the hepatoma tissue samples and related clinical data (all are anonymous) for our research work.
Abstract
Cancer cells display altered glucose metabolism characterized by a preference for aerobic glycolysis. The aerobic glycolytic phenotype of hepatocellular carcinoma (HCC) is often correlated with tumor progression and poorer clinical outcomes. However, the issue of whether glycolytic metabolism influences metastasis in HCC remains unclear. In the current study, we showed that knockdown of taurine up-regulated gene 1 (TUG1) induces marked inhibition of cell migration, invasion, and glycolysis through suppression of microRNA (miR)-455-3p. MiR-455-3p, which is transcriptionally repressed by p21, directly targets the 3′ untranslated region of adenosine monophosphate-activated protein kinase subunit beta 2 (AMPKβ2). The TUG1/miR-455-3p/AMPKβ2 axis regulates cell growth, metastasis, and glycolysis through regulation of hexokinase 2 (HK2). TUG1 is clearly associated with HK2 overexpression and unfavorable prognosis in HCC patients. Conclusion: Our data collectively highlight that novel regulatory associations among TUG1, miR-455-3p, AMPKβ2, and HK2 are an important determinant of glycolytic metabolism and metastasis in HCC cells and support the potential utility of targeting TUG1/HK2 as a therapeutic strategy for HCC. (Hepatology 2018;67:188-203)
Abbreviations
-
- 2-DG
-
- 2-deoxyglucose
-
- AMPKβ2
-
- adenosine monophosphate-activated protein kinase subunit beta 2
-
- ChIP
-
- chromatin immunoprecipitation
-
- EED
-
- embryonic ectoderm development
-
- EZH2
-
- enhancer of zeste homolog 2
-
- HCC
-
- hepatocellular carcinoma
-
- HK2
-
- hexokinase 2
-
- lncRNA
-
- long non-coding RNA
-
- miRNA
-
- miR, microRNA
-
- mRNA
-
- messenger RNA
-
- mTOR
-
- mammalian target of rapamycin
-
- mut
-
- mutant type
-
- NKD1
-
- naked cuticle homolog 1
-
- PRC
-
- polycomb repressive complex
-
- qRT-PCR
-
- quantitative real-time polymerase chain reaction
-
- TUG1
-
- taurine up-regulated gene 1
-
- Ub
-
- ubiquitination
-
- UTR
-
- untranslated region
-
- vc
-
- vector control
-
- wt
-
- wild type
Hepatocellular carcinoma (HCC) is one of the most common malignant liver tumors worldwide. Long-term prognosis for HCC remains extremely poor, with metastasis being the major underlying cause of mortality.1 Advances in our understanding of the mechanisms underlying metastasis in HCC and strategies to enhance the efficacy of current treatment options are essential to improve prognosis.
The metabolic properties of cancer cells are distinct from those of normal cells.2 Cancer cells exhibit unique metabolic phenotypes, such as enhanced uptake of glucose and conversion of pyruvate to lactate. This phenomenon, termed the Warburg effect, confers considerable growth advantages to cancer cells. In addition to dependency on glycolysis, cancer cells exhibit atypical metabolic characteristics, such as increased fatty acid synthesis and glutamine metabolism. These differences suggest that targeting metabolic dependence could present a promising selective approach to treat cancer patients.3 Cancer cell metabolism is a complex process controlled by aberrant regulation of both coding and noncoding genes.4-7
Long noncoding RNAs (lncRNAs) are a class of nonprotein-coding transcripts greater than 200 nucleotides in length.8 Recent studies have shown that lncRNAs are frequently deregulated in various cancers and have multiple functions in several biological processes, including proliferation, apoptosis, tumor metastasis, and cancer cell metabolism.5, 6, 9-11 A number of lncRNAs, including taurine up-regulated gene 1 (TUG1), have been associated in HCC.12 Moreover, TUG1 is highly expressed in many cancer types, including ovarian cancer,13 bladder cancer,14 glioma,15 colorectal cancer,16 and cervical cancer.17 However, the potential involvement of TUG1 in mediating the metastatic cascade and glycolytic metabolism in HCC and the underlying molecular mechanisms remain to be established.
In the current study, we investigated the involvement of the specific deregulated lncRNA, TUG1, and its downstream target genes in glycolysis and tumor metastasis in HCC. Our experiments integrated cancer cell metastasis and glycolytic phenotype. We identified novel associations among TUG1, miR-455-3p, adenosine monophosphate-activated protein kinases subunits α and β2 (AMPKα and AMPKβ2), and hexokinase 2 (HK2) signaling pathways that are implicated in the regulation of cancer cell metastasis and metabolic programs.
Materials and Methods
HUMAN HEPATOMA SPECIMENS
Hepatoma samples from the Taiwan Liver Cancer Network were selected for study and subjected to quantitative real-time polymerase chain reaction (qRT-PCR) and western blot analyses.18 The protocol was approved by the Medical Ethics and Human Clinical Trial Committee at Chang-Gung Memorial Hospital. Detailed Materials and Methods are available in the Supporting Information.
Results
TUG1 IS HIGHLY EXPRESSED IN HCC
Using microarray analysis, several differentially expressed lncRNAs were identified in two HCC samples in relation to adjacent normal tissue samples (fold change ≥ 2.0 or ≤ 0.5; P < 0.05). The microarray data are publicly available at the Gene Expression Omnibus (http://www.ncbi.nlm.nih.gov/geo) with accession number GSE101679. Among these lncRNAs, 123 were consistently up-regulated and 279 were consistently down-regulated in HCC (data not shown). Further, qRT-PCR, performed to validate gene expression results obtained from the microarray analysis, confirmed significant up-regulation of TUG1 in HCC tissues compared with the corresponding nontumor counterparts (Supporting Fig. S1A, cohort 1). Linkage of gene expression data from our cohort to other publicly available data sets (cohort 2, GSE14520 https://www.ncbi.nlm.nih.gov/geo/query/acc.cgi?acc=gse14520; cohort 3, GSE14323 https://www.ncbi.nlm.nih.gov/geo/query/acc.cgi?acc=GSE14323; cohort 4, The Cancer Genome Atlas data set) comprising several human hepatoma samples was used for the biological interpretation of expression patterns.19, 20 Consistently, TUG1 was highly expressed in HCC from other cohorts (Supporting Fig. S1A, cohorts 2-4). Furthermore, expression of TUG1 was positively correlated with overall survival of HCC patients in cohorts 1 and 2 to a significant extent (Supporting Fig. S1B). Notably, TUG1 expression was positively associated with α-fetoprotein, vascular invasion, pathologic stage, and grade in cohort 1 (Supporting Table S1) and α-fetoprotein and predicted risk metastasis signature in cohort 2 (Supporting Table S2). However, TUG1 was not an independent prognostic factor associated with survival in cohort 1 and 2 (Supporting Tables S3 and S4). From the collective data obtained from our large number of clinical specimens along with those from the three available data sets, TUG1 was selected for further study to support its oncogenic role in HCC.
SILENCING OF TUG1 SUPPRESSES CELL MIGRATION, INVASION, METASTASIS, AND GLYCOLYSIS IN HCC
The precise functions of the majority of lncRNAs are yet to be determined. Previous studies indicate that genes with similar co-expression patterns tend to exhibit functional coherence. This type of approach may be effectively used for exploring the roles of lncRNAs in cancer progression.21 In the current study, co-expression analysis for TUG1 was performed using Pearson correlation in a publicly available data set (GSE14323), followed by ordering of the Pearson's correlation coefficient in a ranked list. Data were uploaded to the Gene Set Enrichment Analysis tool,22 and pathway analysis was performed using a "Gene Set Enrichment Analysis Preranked" module. The results indicated that the epithelial–mesenchymal transition is significantly enhanced and positively correlated with TUG1 expression (Supporting Fig. S1C). Furthermore, cell cycle and glycolysis phenotype were positively correlated with TUG1, as observed using the bioinformatics tool lncRNAtor,23 clearly suggesting that TUG1 is involved in these pathways.
Based on pathway analysis data, we further examined the potential effects of TUG1 on hepatoma cell growth. Hep3B and SK-Hep1 cells with knockdown of TUG1 (shTUG1#1 and shTUG1#2) were further established, and expression of TUG1 in stable cell lines measured by qRT-PCR (Supporting Fig. S2A). Knockdown of TUG1 significantly suppressed growth in Hep3B and SK-Hep1 cell lines compared with that in cells transfected with vector control, both in vitro and in vivo (Supporting Fig. S2B,C). TUG1 expression in tumors was further confirmed using qRT-PCR (Supporting Fig. S2D). These phenotypes have been reported previously.12 The potential effects of TUG1 on migration and invasion of hepatoma cells were additionally investigated. Migration and invasion abilities were clearly suppressed in Hep3B and SK-Hep1 cells depleted of endogenous TUG1 (Fig. 1A,B). Metabolic reprogramming is a known hallmark of cellular transformation, but little is known about the metabolic changes accompanying tumor metastasis. To explore the potential effects of TUG1 on metabolic reprogramming of hepatoma cells, glucose uptake and lactate production were evaluated. Notably, knockdown of TUG1 reduced the glucose uptake ability of Hep3B cells and led to decreased lactate production (Fig. 1C). To further validate the impact of TUG1 on HCC glycolysis, extracellular acidification rates were measured using the XF24 Extracellular Flux analyzer. The data consistently showed that knockdown of TUG1 significantly suppressed the rate of glycolysis in Hep3B cells (Fig. 1D). To prevent cell number changes that could potentially affect the outcome of the assays, we carried out the assays in the presence of the antiproliferative drug mitomycin C. Similarly, knockdown of TUG1 in Hep3B and SK-Hep1 repressed cell migration, invasion, and glycolysis compared with the control group after mitomycin C treatment (Fig. 1A,B,D). Cell growth regulated by TUG1 did not interfere with migration, invasion, and glycolysis phenotypes. To confirm whether the in vitro phenotype of TUG1-depleted cells is reproducible in vivo, the effect of TUG1 knockdown on SK-Hep1 cell metastasis was examined in severe combined immunodeficiency mice. Specifically, SK-Hep1-sh-luc and SK-Hep1-shTUG1#1 cells were injected into the tail veins of severe combined immunodeficiency mice and metastatic foci detected by histologic analysis of the lungs (Fig. 1E, left panel). As expected, the number of foci in lungs from the shTUG1#1 group was significantly lower than that in the control group (Fig. 1E, right panel). To characterize the metabolic features of animal models using a nontargeted metabolic profiling strategy, the differential metabolites in mice bearing tumors were determined using liquid chromatogram–mass spectrometry. The intermediate metabolites, including glucose-6-phosphate/fructose-6-phosphate, in glycolysis were reduced in the TUG1-depleted group compared to the control group (Fig. 1E, lower panel). The finding is consistent with the Warburg effect of an increased glycolysis rate in cancer cells.24 Moreover, glycolytic intermediates, such as pyruvate, are used to produce nonessential amino acids, such as alanine.25 Notably, alanine was repressed in the TUG1-depleted group compared to the control group (Fig. 1E, lower panel). Furthermore, glutamate was significantly reduced in the TUG1-depleted groups (Fig. 1E, lower panel). These findings strongly support an oncogenic role of TUG1 through promotion of cell metastasis and glycolysis in vivo. Furthermore, TUG1 depletion enhanced cell death in glucose-free conditions (Fig. 1F). Based on these findings, we propose that TUG1 regulates glycolytic capacity in HCC cell lines.
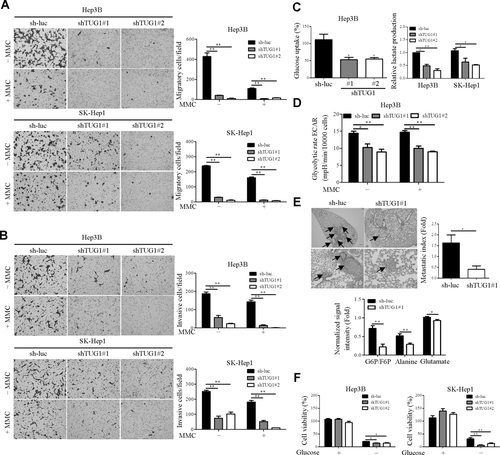
TUG1 promotes cell migration, invasion, metastasis and glycolysis. Effects of TUG1 on (A) cell migration and (B) invasion with/without 5 μM MMC treatment were determined using the transwell assay. (C) Left panel, intracellular glucose levels were measured and normalized against cell number. Right panel, lactate levels in culture medium were measured and normalized against cell number. (D) Extracellular acidification rate analysis of TUG1-depleted stable cell lines with/without MMC treatment was performed using the Seahorse XF24 analyzer. The extracellular acidification rate after glucose treatment indicates the glycolysis rate. (E) Hematoxylin and eosin staining of lung tissue sections from SK-Hep1-sh-luc and SK-Hep1-shTUG1#1 xenografts (n = 5/group). Tumors are indicated with arrowheads. The metastatic index (relative fold change in density of tumor foci in SK-Hep1-sh-luc and SK-Hep1-shTUG1#1 groups per mm2 of lung area) is shown. Levels of metabolite in the control group and knockdown TUG1 group were shown by LC-MS. Results are presented as means ± SD. (F) Viability of TUG1-depleted stable cell lines with/without glucose treatment was measured. *P < 0.01, **P < 0.05. Abbreviations: ECAR, extracellular acidification rate; F6P, fructose 6-phosphate; G6P, glucose 6-phosphate; LC-MS, liquid chromatogram–mass spectrometry; MMC, mitomycin C; mpH, milli pH units.
miR-455-3p IS UP-REGULATED BY TUG1
The influence of lncRNAs on microRNA (miRNA, miR) expression has been documented.26 To identify TUG1-regulated miRNAs, miRNA expression screening was performed in the TUG1-depleted Hep3B cell line using SYBR Green-based qRT-PCR. The top five deregulated miRNAs in TUG1 knockdown cells are shown in Supporting Table S5. Consequently, miR-455-3p was identified as a novel potential candidate. Our qRT-PCR results showed down-regulation of mature miR-455-3p in the TUG1-depleted Hep3B cell lines (Fig. 2A). Moreover, precursor and primary transcripts of miR-455 were significantly regulated by TUG1 (Fig. 2A), indicating that miR-455-3p is modulated by TUG1 at the transcriptional level. Next, the effects of miR-455-3p on cell growth, migration, invasion, and glycolysis were examined. To this end, knockdown of miR-455-3p (through a specific inhibitor) was achieved in the Hep3B and SK-Hep1 cell lines (Supporting Fig. S3A). Depletion of miR-455-3p led to reduced migration, invasion, glycolysis, and cell proliferation (Fig. 2B,C; Supporting Fig. S3B), similar to the phenotypes induced by TUG1 repression. Conversely, overexpression of miR-455-3p led to the opposite effects (Supporting Fig. S3C).
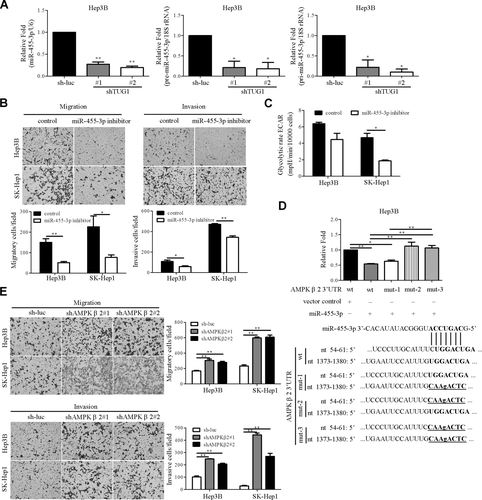
miR-455-3p is regulated by TUG1. (A) qRT-PCR analysis of expression levels of mature, precursor, and primary transcripts of miR-455-3p. U6 and 18S ribosomal RNA were used as the loading controls, respectively. (B) Effects of miR-455-3p on cell migration were determined. (C) Extracellular acidification rate analysis of miR-455-3p knockdown cell lines was performed using the Seahorse XF24 analyzer. (D) Two putative miR-455-3p target sequences on AMPKβ2 3'UTR wt, mut-1, mut-2, or mut-3. The target sequences are depicted in bold, and mutations within the target sites are underlined. Control or miR-455-3p-ovexpressing Hep3B cells were transfected with full-length 3′UTR (wt) AMPKβ2 or mutant seed region reporters (mut-1, mut-2, mut-3). Luciferase activity was normalized to that of β-galactosidase and calculated as fold change relative to control cells. (E) Effects of AMPKβ2 on cell migration and invasion were determined using the transwell assay. Abbreviations: ECAR, extracellular acidification rate; mpH, milli pH units; mut-1. mutation of the first site; mut-2, mutation of the second site; mut-3, mutation of both sites; wt, wild type.
AMPKβ2 IS A TARGET OF miR-455-3p
To explore the direct effects of the TUG1/miR-455-3p axis, specific target genes of miR-455-3p were selected for further study. Searches using TargetScan and miRDB software http://www.mirdb.org/ led to the identification of AMPKβ2 as a potential miR-455-3p target gene. The luciferase reporter assay was performed to determine whether the AMPKβ2 gene is directly regulated by miR-455-3p. Partial AMPKβ2 3′ untranslated region (UTR) (∼1.3 kbp) was amplified and cloned into the pMiR reporter vector due to its length (∼4.5 kbp). Two miR-455-3p complementary sites within the wild-type 3'UTR of AMPKβ2 and three mutated sequences (mut-1, mut-2, and mut-3) were cloned in the luciferase reporter (Fig. 2D). Overexpression of miR-455-3p led to suppression of wild-type AMPKβ2 3′UTR reporter activity. Notably, this effect was abolished with the introduction of the mut-2 and mut-3 reporter constructs (Fig. 2D). The results suggest that positions 54-61 of AMPKβ2 3′UTR are critical for miR-455-3p-mediated regulation of expression. Conversely, reporter activity was enhanced by treatment with a miR-455-3p inhibitor (Supporting Fig. S3D), strongly suggesting that AMPKβ2 is a direct miR-455-3p target. The effects of AMPKβ2 on cell migration and invasion were further examined by generating Hep3B and SK-Hep1 cells with stable knockdown of AMPKβ2 (shAMPKβ2#1 and shAMPKβ2#2). Notably, AMPKβ2 depletion led to significantly enhanced cell migration and invasion abilities (Fig. 2E) while its overexpression exerted the opposite effects (Supporting Fig. S3E).
TUG1 REGULATES THE MAMMALIAN TARGET OF RAPAMYCIN /AMPKα PATHWAY AS WELL AS HK2, AMPKβ2, AND SNAIL EXPRESSION
AMPKα acts as a tumor suppressor by inhibiting glycolysis and tumor growth in various cancers, including HCC.27 The epithelial–mesenchymal transition, a process by which tumor-associated epithelial cells acquire mesenchymal features, is a critical step during metastasis.28 To assess whether TUG1 contributes to the activities of these tumor markers, protein levels of p-AMPKα (Thr172) and Snail were examined. Levels of the mesenchymal marker Snail were decreased in TUG1-depleted cells compared to control cells. The levels of p-AMPKα (Thr172) were higher in TUG1-depleted Hep3B or SK-Hep1 cells relative to their control counterparts, but total protein levels were not (Fig. 3A). Association of an aberrant expression of mammalian target of rapamycin (mTOR) with oncogenesis has been documented for several cancer types and shown to be negatively regulated by AMPKα 29 As expected, knockdown of TUG1 expression resulted in marked reduction of p-mTOR (Ser2448) expression but not total mTOR protein levels in Hep3B and SK-Hep1 cells (Fig. 3A). Moreover, HK2 expression was suppressed in TUG1-depleted cell lines (Fig. 3A). AMPKβ2 protein levels were increased in TUG1-depleted cells compared to control cells (Fig. 3A). Similar results were observed with miR-455-3p knockdown cells (Fig. 3B). On the other hand, these markers had the opposite effects in knockdown of AMPKβ2 cells (Fig. 3C). To ascertain the possible involvement of miR-455-3p, AMPKβ2, or AMPKα in TUG1-mediated cell growth and migration ability, TUG1 knockdown cells overexpressing miR-455-3p or depleted of AMPKβ2 or AMPKα1 were established. Notably, miR-455-3p overexpression in TUG1 knockdown cells induced a significant increase in cell proliferation and migration (Fig. 3D,E). Knockdown of AMPKβ2 or AMPKα reversed the effects of TUG1 knockdown on cell migration and growth (Fig. 3D,E), suggesting that TUG1 exerts its oncogenic effects through regulation of miR-455-3p, AMPKβ2, and AMPKα. To further ascertain that suppression of HK2 in TUG1-depleted cell lines occurs through AMPKβ2 up-regulation, HK2 expressions were analyzed in AMPKβ2 knockdown cells. Protein levels were clearly increased in TUG1 and AMPKβ2 knockdown cells compared with TUG1 knockdown cells (Fig. 3F, lanes 2 versus 4).
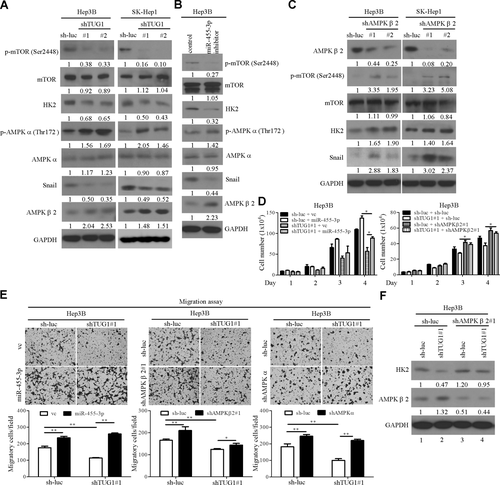
TUG1 regulates HK2, p-mTOR, AMPKα, AMPKβ2, and Snail expression. (A-C) Immunoblot analysis to determine the expression patterns of Snail, p-mTOR (Ser2448), HK2, p-AMPKα (Thr172) AMPKα, AMPKβ2, and total proteins in the indicated cell lines. (D) Cell proliferation was measured in TUG1 knockdown and control cells transfected with the expression plasmid or vector control as indicated. (E) The transwell migration assay was performed with TUG1 knockdown and control cells transfected with the expression plasmid/shRNA or vector control as indicated. (F) Hep3B TUG1-depleted cells were transfected with control or AMPKβ2 shRNA, and levels of AMPKβ2 and HK2 measured by western blot using GAPDH as the loading control. Abbreviations: GAPDH, glyceraldehyde 3-phosphate dehydrogenase; shRNA, short hairpin RNA; vc, vector control.
SILENCING OF TUG1 PROMOTES p21, ASSOCIATES DIRECTLY WITH E2F1, AND SUPPRESSES miR-455 TRANSCRIPTIONAL ACTIVITY
Previous findings indicate that TUG1 interacts with polycomb repressive complex (PRC) 2 to silence the expression of various genes, including p21, in gastric cancer.30 Data from the current study showed that knockdown of TUG1 promoted p21 expression. Meanwhile, expression of embryonic ectoderm development (EED), a core component of PRC2, was suppressed in TUG1-depleted cell lines (Fig. 4A). Notably, p21 messenger RNA (mRNA) levels were increased in TUG1 and EED knockdown cells compared with control cells (Fig. 4A). The RNA immunoprecipitation assay was performed to determine whether enhancer of zeste homolog 2 (EZH2) or EED interacted with TUG1 in Hep3B cells. TUG1 directly interacted with EZH2 but not EED (Supporting Fig. S4A). HOX transcript antisense RNA (HOTAIR) and glyceraldehyde 3-phosphate dehydrogenase were used as positive and negative controls, respectively. In contrast, Lin et al.31 used the RNA immunoprecipitation assay to demonstrate that TUG1 RNA was bound to EZH2 and EED in H520 cells. Moreover, chromatin immunoprecipitation (ChIP) assays were performed to determine whether PRC2 (EZH2/EED) could directly bind to p21 promoter regions to silence p21 transcription. The results showed that knockdown of TUG1 significantly suppressed EZH2 or EED directly bound to p21 promoter regions (Supporting Fig. S4B, left panel). In agreement with the reduction of these binding activities, trimethylation at lysine 27 of histone 3 (H3K27me3) promoter occupancy was reduced on p21 promoter regions (Supporting Fig. S4B, middle panel), similar to the phenotypes induced by EED repression (Supporting Fig. S4B, right panel).
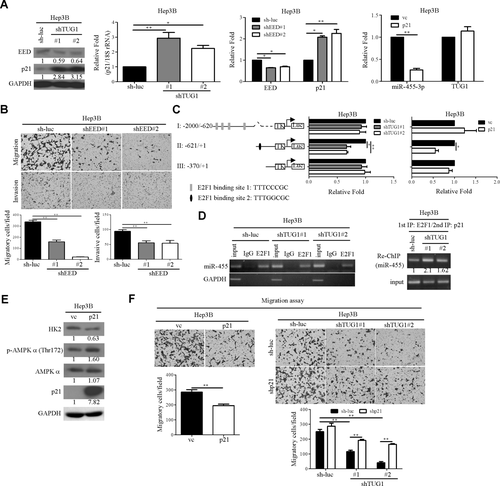
p21 associates directly with E2F1 and represses miR-455 transcriptional activity in TUG1-depleted cells. (A) mRNA and protein levels of EED, p21, miR-455-3p, and TUG1 were measured in the indicated cell lines. (B) Effects of EED on cell migration and invasion were determined using the transwell assay. (C) Promoter activity was performed in TUG1 knockdown and p21-overexpressing cells as indicated. (D) Left panel, sonicated lysates were immunoprecipitated with antibodies against IgG and E2F1. ChIP assay results were evaluated using PCR and gel electrophoresis. GAPDH was used as the negative control. Right panel, complexes immunoprecipitated with the antibody recognizing E2F1 (1st IP) were eluted from the protein A beads and were re-immunoprecipitated with p21 antibody (2nd IP). ChIP assay results were evaluated using PCR and gel electrophoresis. (E) Expression of HK2, p-AMPKα (Thr172) AMPKα, and p21 in p21-overexpressing Hep3B cells, assessed by western blot. (F) Left panel, effects of p21 on cell migration. Right panel, transwell migration assay in TUG1 knockdown and control cells transfected with p21 shRNA plasmid or vector control. Abbreviations: GAPDH, glyceraldehyde 3-phosphate dehydrogenase; IgG, immunoglobulin G; IP, immunoprecipitation; rRNA, ribosomal RNA; shRNA, short hairpin RNA; vc, vector control.
In general, the PRC2 complex regulates global gene expressions. To investigate whether the TUG1/PRC2 complex specifically associates with the p21 promoter but not with others of the known PRC2 targets, the genes naked cuticle homolog 1 (NKD1) and protein phosphatase 2 regulatory subunit Bbeta (PPP2R2B), which are regulated by the PRC2 complex, were assayed.32 Kruppel-like factor 2 was used as a positive control (Supporting Fig. S4C-E), and the results were similar to the previous study.12 Knockdown of TUG1 did not affect EZH2 directly bound to NKD1 and PPP2R2B promoter regions (Supporting Fig. S4C). Also, H3K27me3 promoter occupancy had no influence on the NKD1 promoter regions under the TUG1-depleted condition compared with the control (Supporting Fig. S4D). NKD1 mRNA was also not regulated by TUG1 (Supporting Fig. S4E). Interestingly, H3K27me3 promoter occupancy was reduced on PPP2R2B promoter regions in TUG1 knockdown cells (Supporting Fig. S4D). However, PPP2R2B mRNA expression was induced in TUG1-depleted cells (Supporting Fig. S4E). These findings indicated that PPP2R2B was regulated by TUG1 through inactivation of PRC2 even with EZH2 still bound to its promoter region. In conclusion, we proposed a regulatory mechanism for TUG1-regulated gene expressions through interaction with EZH2 or up-regulation of EED. In this study, we focused on p21 gene expression regulated by TUG1/PRC2 (EED). Moreover, knockdown of EED led to reduced migration and invasion (Fig. 4B), similar to the phenotypes induced by TUG1 repression. EED mRNA was only marginally repressed in TUG1 knockdown cell lines using qRT-PCR (Supporting Fig. S5A), indicating that EED expression is regulated by TUG1 at the translational but not the transcriptional level. Moreover, the EED turnover rate was rapid in TUG1 knockdown compared to control (sh-luc) cells in a cycloheximide chase experiment (Supporting Fig. S5B).
Interestingly, p21 functions as a transcriptional repressor to interact with E2F1 and regulate gene expression.33 To determine whether miR-455-3p is regulated by p21, qRT-PCR analysis was performed. Overexpression of p21 suppressed miR-455-3p but not TUG1 expression in the Hep3B cell line (Fig. 4A). Promoter activity analysis was performed to determine whether miR-455-3p is regulated by TUG1 or p21 at the transcriptional level. Putative E2F1 binding sites in the miR-455-3p promoter region (I-III) were identified with bioinformatics tools (Fig. 4C). The luciferase activity was obviously decreased in fragment II in knockdown of TUG1 or p21-overexpressing cells (Fig. 4C). E2F1 binding to promoter fragment II of miR-455 in vivo was confirmed using the ChIP assay. The data revealed the binding ability of E2F1 to miR-455 promoter fragment II was similar in control and knockdown TUG1 cell lines (Fig. 4D, left panel). Next, we hypothesized that knockdown of TUG1 would enhance binding of the co-repressor p21 to E2F1 when these transcriptional factors are occupying the miR-455 promoter. We performed a sequential ChIP–reChIP assay assessing the relative amount of p21 associated with E2F1 resident at the miR-455 promoter. Notably, knockdown of TUG1 enhanced binding of the co-repressor p21 to E2F1 when these transcriptional factors were occupying the miR-455 promoter (Fig. 4D, right panel). Levels of p-AMPKα (Thr172) were increased in p21-overexpressing Hep3B cells while HK2 was suppressed (Fig. 4E). Moreover, overexpression of p21 resulted in reduced cell migration (Fig. 4F, left panel), and conversely, knockdown of p21 in TUG1-depleted Hep3B cells enhanced migration (Fig. 4F, right panel). These findings suggest that p21 functions as a transcriptional co-repressor and contributes to regulation of the metastatic phenotype.
HK2 UBIQUITINATION AND DEGRADATION IS REGULATED BY THE TUG1/miR-455-3p AXIS
HK2 mRNA was only marginally repressed in TUG1 knockdown cell lines (Fig. 5A), indicating that HK2 expression is regulated by TUG1 at the translational but not the transcriptional level. The underlying regulatory mechanisms of HK2 were further examined. Interestingly, expression of HK2 was stabilized by the proteasome inhibitor MG132 in TUG1 or miR-455-3p knockdown cells (Fig. 5B), implying that TUG1 or miR-455-3p controls HK2 protein stability directly through the proteasome. Moreover, the HK2 turnover rate was rapid in TUG1 knockdown compared to control (sh-luc) cells in a cycloheximide chase experiment (Fig. 5C). To further establish whether TUG1 controls HK2 stability through ubiquitination, the HK2 ubiquitination assay was performed. Knockdown of TUG1 enhanced HK2 polyubiquitination compared to that in the control group (Fig. 5D). Furthermore, HK2 depletion by short hairpin RNA transfection led to inhibition of Hep3B cell migration ability (Fig. 5E). Our data collectively suggest that TUG1 controls cell migration and glycolysis by regulating the p21/miR-455-3p axis, in turn affecting HK2 stability.
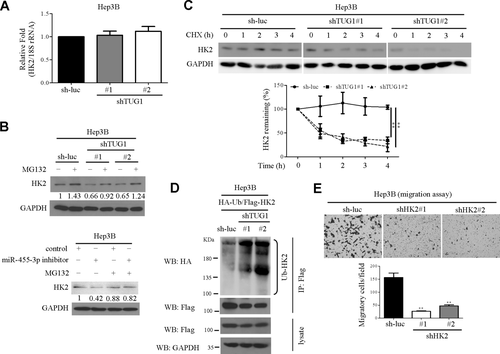
HK2 protein stability is regulated by the TUG1/miR-455-3p axis. (A) HK2 mRNA levels were determined in TUG1 knockdown Hep3B cells. (B) Following MG132 (10 μM) treatment, cells were harvested and HK2 protein expression evaluated by western blot. (C) The HK2 protein turnover rate was determined using CHX. Cell lysates were collected at the indicated times, and HK2 expression detected by western blot. HK2 intensity was quantified and normalized to GAPDH, as shown in the bottom panel. Statistical significance was calculated using one-way analysis of variance with Tukey post-hoc test. (D) Cells were cotransfected with Flag-HK2 and HA-Ub plasmids, and the lysates were extracted after transfection. Flag-HK2 was immunoprecipitated with anti-Flag antibody, and ubiquitinated HK2 was detected with an anti-HA antibody. Immunoprecipitated Flag-HK2 was immunoblotted as the input control. (E) Assessment of transwell migration in HK2 knockdown and control cells. Abbreviations: CHX, cycloheximide; GAPDH, glyceraldehyde 3-phosphate dehydrogenase; HA, hemagglutinin; rRNA, ribosomal RNA; ub, ubiquitin; WB, western blot.
HIGHLY METASTATIC HCC CELL LINES DISPLAY ELEVATED GLYCOLYTIC CAPACITY
To further determine the association of cancer cell metastasis with glycolytic phenotype, a highly metastatic Hep3B-derived cell population (designated Hep3B-TW) was established using the in vitro transwell invasion assay. The invasion ability of Hep3B-TW was higher than that of Hep3B (Supporting Fig. S6A). As expected, miR-455-3p expression was increased in Hep3B-TW relative to Hep3B cells (Supporting Fig. S6B). HK2 and p-mTOR (Ser2448) proteins were expressed at higher levels in Hep3B-TW relative to parental Hep3B cells, while p-AMPKα (Thr172) and AMPKβ2 protein levels were lower (Supporting Fig. S6C). Moreover, the glycolysis rate in Hep3B-TW cells was elevated compared to that in Hep3B cells (Supporting Fig. S6D). To further explore whether cancer cell migration is mediated through glycolytic effects, the transwell migration assay was performed. Migration of Hep3B-TW cells was inhibited by 2-deoxyglucose (2-DG), a glycolysis blocker (Fig. 6A). mRNA expression levels of TUG1 and primary and precursor transcripts of miR-455-3p were decreased after incubation of Hep3B with 2-DG for 24 hours (Supporting Fig. S6E). To ascertain whether the effects of TUG1 on cell migration are glycolysis dependent, stable Hep3B-TW cell lines with knockdown of TUG1 were established (Supporting Fig. S6F) and the migration assay was performed. Suppression of glycolysis with 2-DG led to more pronounced attenuation of cell migration in TUG1 knockdown Hep3B-TW cells (Fig. 6B). Notably, HK2 and Snail levels were further reduced in the presence of the glycolytic inhibitor in TUG1 knockdown Hep3B-TW cells (Fig. 6C). HK2 was expressed in TUG1-depleted Hep3B-TW cells to address its possible involvement in TUG1-mediated metastatic ability. Interestingly, HK2 re-expression reversed the inhibitory effects of TUG1 knockdown on cell migration and glycolysis rates (Fig. 6D,E), suggesting that the stimulatory effects of TUG1 are exerted through up-regulation of HK2. These findings indicate that glycolysis is involved in cancer cell migration in hepatoma cell lines.
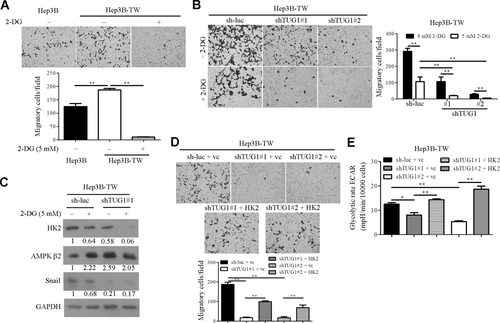
Glycolysis promotes cell migration through activation of TUG1/HK2. (A) Cell migration data were obtained in the presence or absence of 2-DG (5 mM). (B) Control and knockdown TUG1 Hep3B-TW cells were treated with/without 2-DG (5 mM), and the cell migration assay was performed. (C) Cells were treated with/without 2-DG for 24 hours, and HK2, AMPKβ2, and Snail expression were measured using western blot. (D) Transwell migration and (E) extracellular acidification rate analysis were performed in TUG1 knockdown and control cells transfected with HK2 expression plasmid or vector control, as indicated. Abbreviations: ECAR, extracellular acidification rate; mpH, milli pH units; vc, vector control.
CLINICAL CORRELATION OF TUG1 WITH HK2
To determine whether HK2, p-mTOR (Ser2448), p-AMPKα (Thr172), AMPKβ2, and miR-455-3p expression levels are related to tumor progression, protein and RNA levels were measured by western blot and qRT-PCR in HCC specimens, respectively. HK2 was highly expressed in HCC tissues relative to the corresponding nontumor counterparts, while p-AMPKα (Thr172) and AMPKβ2 levels were down-regulated in HCC (Supporting Fig. S7A). MiR-455-3p expression was elevated in HCC (Supporting Fig. S7A). Representative results of eight paired HCC tissues showing enhanced HK2 and p-mTOR (Ser2448) expression and concomitantly decreased p-AMPKα (Thr172) and AMPKβ2 are shown in Fig. 7A. Consistently, HK2 was highly expressed in HCC from other cohorts (Supporting Fig. S7B). Furthermore, HK2 displayed significant positive correlation with tumor size, pathologic stage, and grade (Supporting Tables S2 and S6). On the other hand, AMPKβ2 was inversely correlated with pathologic stage (Supporting Table S6). Importantly, patients displaying high HK2 expression showed significantly poorer overall survival than those with low levels of HK2 (Fig. 7B, left panel). Results of Spearman correlation coefficient analysis confirmed that TUG1 is significantly positively correlated with miR-455-3p and HK2 (Supporting Fig. S7C). Considering the positive correlation between TUG1 and HK2 in HCC tumors, we further evaluated their combined influence on patient outcomes. Patients were classified into three groups using the median value as cutoff: group I, TUG1 low and HK2 low (n = 18); group II, TUG1 low and HK2 high or TUG1 high and HK2 low (n = 24); and group III, TUG1 high and HK2 high (n = 19). Patients in group III showed significantly poorer overall survival than those in group I (Fig. 7B, right panel). Clinical investigations validated the associations among TUG1/miR-455-3p/AMPKβ2/HK2, both in vivo and in vitro, clearly supporting critical pathologic roles of TUG1, miR-455-3p, AMPKβ2, and HK2 in hepatoma (Fig. 7C).
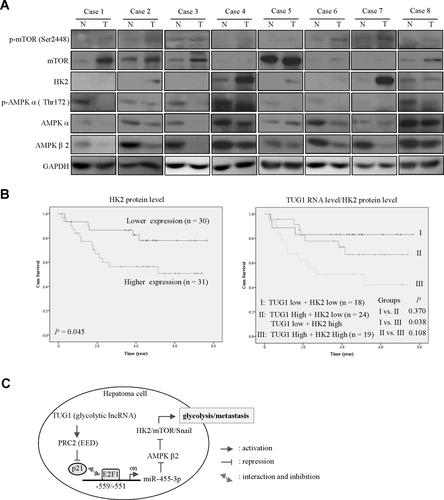
The TUG1/HK2 axis is correlated with poor prognosis in HCC patients. (A) Western blot analysis of p-mTOR (Ser2448), mTOR, HK2, p-AMPKα (Thr172) AMPKα, and AMPKβ, expression in HCC-paired specimens. Protein expression was examined in eight representative pairs of HCC specimens with GAPDH as the loading control. (B) Kaplan–Meier analysis of overall survival based on HK2 expression in 61-paired HCC specimens. Median expression levels of HK2 were used as the cutoff. Overall survival was analyzed using the log-rank test, the Kaplan–Meier overall survival analysis curve for high- or low-risk survival groups was assessed in 61-paired HCC patients. High TUG1 and simultaneous high HK2 levels were significantly associated with poorest overall survival. P values were determined by the log-rank test. (C) Proposed model for the TUG1/miR455-3p/AMPKβ2/HK2 pathway in regulating migration, invasion, and glycolysis of hepatoma. Abbreviations: GAPDH, glyceraldehyde 3-phosphate dehydrogenase; N, adjacent normal; T, tumor.
Discussion
Cancer cells display altered glucose metabolism characterized by a preference for aerobic glycolysis. Accordingly, many human cancers, including HCC, display an aerobic glycolytic phenotype, which often correlates with tumor progression and poorer clinical outcomes.34 However, the issue of whether tumor metabolism influences metastasis remains largely unclear. An earlier report showed increased extracellular acidification rate, glucose consumption, and lactate production in metastatic 4T1 cells compared to nonmetastatic cell lines. Moreover, hypoxia inducible factor 1 alpha subunit/pyruvate dehydrogenase kinase isozyme 1 was shown to promote glycolytic metabolism in liver metastatic breast cancer cells.35 Dasgupta and co-workers36 demonstrated that steroid receptor coactivator 2 drives glutamine-dependent de novo lipogenesis, which supports tumor cell survival and subsequent metastasis. Therefore, metabolism-mediated cancer cell metastasis is one of the most critical aspects of cancer biology. In this study, we have provided a conceptual framework to clarify how TUG1 regulates glycolysis in HCC cells and the molecular mechanisms linking altered metabolism to metastasis.
A recent investigation reported that TUG1 promotes tumor cell proliferation, colony formation, and tumorigenicity through epigenetically repressing Kruppel-like factor 2 transcription in HCC cells,12 suggesting that TUG1 regulates the early stages of HCC formation. However, the metabolic and metastatic phenotypes in HCC are yet to be established. Data from the current study showed that TUG1 promotes cell migration and invasion in HCC, consistent with recent findings that up-regulation of TUG1 in ovarian cancer13 and bladder cancer14 contributes to tumor metastasis. Interestingly, we established a novel role of TUG1 in regulating glycolytic capacity in HCC, mediated by activation of miR-455-3p. Our experiments showed that miR-455-3p is frequently up-regulated in HCC tissues. MiR-455-3p was regulated by TUG1 in both p53-null and p53-wild-type Hep3B and SK-Hep1 cells, indicating that the mechanism of regulation is p53 independent. p21 is a well-known cell cycle regulator37 that additionally appears to mediate gene expression. p21 does not bind directly to regulatory elements but can act as a repressor through binding to transcription factors, such as E2F1, c-Myc, or signal transducer and activator of transcription.33 Here, we uncover the novel regulatory mechanism that TUG1 promotes miR-455-3p expression by directly inhibiting p21 associated with E2F1.
Accumulating studies have focused on AMPKα activity and effects on tumor formation, metabolism, and metastasis.38 However, the potential effects of AMPKβ2 on migration and invasion in hepatoma remain largely unclear. AMPKβ2 was identified as a direct target gene of miR-455-3p in our experiments. Knockdown of AMPKβ2 induced p-mTOR, Snail, and HK2 expressions, resulting in dramatically enhanced cell migration, invasion, and glycolysis. Notably, AMPKβ2 was more highly expressed in nontumor tissues adjacent to HCC, but the underlying mechanism of AMPKβ2 repression in HCC is yet to be elucidated. Our results provide evidence that miR-455-3p negatively regulates AMPKβ2 expression. However, the possibility that other potential miRNAs additionally participate in AMPKβ2 regulation cannot be excluded.
A highly metastatic cell line (Hep3B-TW) was generated with a view to further investigate the link between metabolic and metastatic phenotypes. As expected, Hep3B-TW exhibited a higher glycolysis rate than the parental Hep3B cell line. Notably, the downstream targets of p-mTOR, Snail, and HK2 were up-regulated while those of p-AMPKα and AMPKβ2 were down-regulated in Hep3B-TW cells. These effects were blocked following treatment with the glycolysis blocker 2-DG. Our findings suggest that promotion of glycolysis triggers tumor metastasis in HCC cell lines. HK2, a rate-determining enzyme in aerobic glycolysis, is overexpressed in many cancer types, including glioblastoma multiforme,39 lung cancer,40 and ovarian cancer.41 Further, the regulation of HK2 is mediated by lncRNA urothelial cancer-associated 1,11 miRNA,42 or epigenetic alterations.43 Here, we revealed a regulatory mechanism of HK2 involving the ubiquitin proteasome pathway.
In conclusion, we have made conceptual progress supporting the theory that altered glycolytic metabolism contributes to metastatic phenotypes. TUG1 reduced p21 expression through up-regulation of EED expression and led to decreased p21-E2F1 interaction and enhanced miR-455-3p expression. Consequently, miR-455-3p repressed AMPKβ2 expression and contributed to increased HK2 and Snail expression. We have identified a pathway interlinking TUG1, miR-455-3p, AMPKβ2, AMPKα/mTOR, Snail, and HK2 that regulates glycolysis, motility, and invasion of hepatoma cells. Our study provides the potential therapeutic strategies of targeting TUG1 and HK2 for the treatment of HCC.
REFERENCES
Author names in bold designate shared co-first authorship.


