Mutational signatures and kataegis in pediatric B-cell precursor acute lymphoblastic leukemia
Mutational single base substitution (SBS) and insertion/deletion (indel; ID) signatures are characteristic patterns of somatic mutations in cancer that may reflect underlying etiologic factors or pathogenetic mechanisms,1 for example, deamination of 5-methylcytosine to thymine (SBS1), activity of the APOBEC family of cytidine deaminases (SBS2, SBS13), DNA damage caused by reactive oxygen species (ROS; SBS18), and defects of DNA replication and repair (ID1) (https://cancer.sanger.ac.uk/cosmic/signatures). In recent years, sequencing studies of B-cell precursor acute lymphoblastic leukemias (BCP ALL) have identified SBS signatures of etiological/pathogenetic importance.2-8 However, much remains to be ascertained, such as ID signatures and differences in signatures between major and minor clones.
We performed whole genome sequencing (WGS) of 84 pediatric BCP ALLs with high hyperdiploidy (HeH; n = 23), ETV6::RUNX1 (n = 23), TCF3::PBX1 (n = 9), and B-other (n = 29) to identify SBS/ID signatures and to explore differences between major clones and minor subclones. In addition, WGS and RNA-seq were used to detect fusion genes, single gene rearrangements, single-nucleotide variants (SNVs), indels, expression patterns of gene fusions and gene mutations, and kataegic regions (i.e., localized hypermutations defined by a minimum of at least six mutations with an intermutation distance of ≤1000 bp)9, 10 (Supporting Information and Table S1).
The WGS analysis revealed 230 structural variants (SVs; translocations, inversions, and deletions; Table S2): 105 were in-frame fusions (including all ETV6::RUNX1 and TCF3::PBX1 fusions; Figure S1), 52 out-of-frame gene fusions, and 73 single gene rearrangements. In total, 44 novel in-frame gene fusions were identified (e.g., three involving PAX5 fused to MECOM, RBM39, and STIM2, respectively) (Figure S2 and Table S3). As expected, all the ETV6::RUNX1 and TCF3::PBX1 fusions were expressed; in contrast, only ~50% of the other in-frame fusions were transcribed, as ascertained by RNA-seq (Supporting Information and Table S2). Of the 104,618 SNVs (median 1082/case) and 1987 indels (median 21/case) identified, 791 (0.8%) SNVs and 74 (3.7%) indels occurred in exonic/splice site regions. The numbers of genomic and exonic/splice site SNVs and indels per case were highly correlated (p < 0.0001; Figure S3), suggesting that the latter SNVs/indels are random and that many of them are “passengers.” In fact, ~30% of the exonic/splice site SNVs were considered benign by SIFT and PolyPhen, only ~20% of them were expressed, and most (77%) genes targeted by exonic/splice site SNVs/indels were non-recurrent (Table S4). Of the 128 recurrently mutated genes, PAX5, KRAS, NRAS, IKZF1, FLT3, and CREBBP were most frequent (Figures S4 and S5), in agreement with previous studies.4, 5 Most (24/31) PAX5 alterations (PAX5alt) were truncated gene fusions, frameshift indels, or larger intragenic deletions (Figure S2), emphasizing the importance of PAX5 haploinsufficiency in BCP ALL.11
The most common substitution type was C > T (46%), followed by C > A (16%), C > G (14%), T > C (11%), T > A (8%), and T > G (5%). Their distributions did not differ significantly among the genetic subtypes, but the frequency of SNVs was higher in ETV6::RUNX1 than in the other genetic subtypes and the numbers of SNVs increased by age in all subtypes except TCF3::PBX1 (Figures S6–S8). Most of the indels were 1 bp deletions and ≥5 bps insertions (Figure S9).
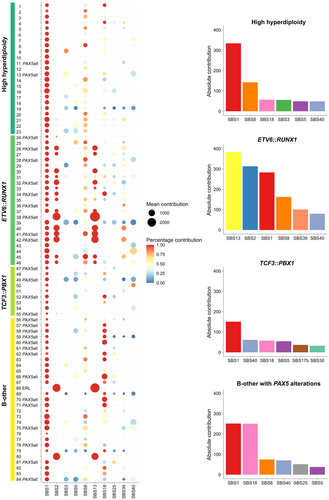
SBS and ID signatures were identified based on the patterns of the substitutions and indels using COSMIC 3.4 (https://cancer.sanger.ac.uk/cosmic/signatures). The top mutational signatures overall, based on their absolute contributions, were SBS1, SBS13, SBS2, SBS8, SBS18, SBS40, ID9, and ID19 (Figures 1 and S10). SBS1, a clock-like signature characterized by C > T transitions occurring during DNA replication, was the only signature that increased with age (Figure S11). SBS2 and SBS13 reflect increased APOBEC activity, and SBS18 is associated with ROS-induced DNA damage; the latter signature was recently reported to be enriched in core binding factor acute myeloid leukemias.12, 13 The etiologies of SBS8 and SBS40 are unknown, but they are known to be common in lung cancer (https://cancer.sanger.ac.uk/cosmic/signatures). Little is known about ID signatures in hematologic malignancies, and no previous studies of BCP ALL have ascertained such signatures (https://cancer.sanger.ac.uk/signatures/id/). In this study, we show that ID9 and ID19 signatures were the only common ones in BCP ALL (Figure S10). These two are characterized by deletions of single bps and insertions of five or more bps, respectively. The etiologies of these signatures are unknown, but they are enriched in lung cancer (ID9) and hematologic malignancies and sarcomas (ID19).

In contrast to some previous studies (Table S5) reporting a high frequency of SBS5 (clock-like) in BCP ALL, this signature was not among the common ones in our study. There are several reasons for discrepancies among studies regarding signatures detected, such as the number of SNVs/cases included in the different studies, usage of restricted catalogs of SBS signatures, continuous updates of signatures in the COSMIC database, and differences in methods used for extracting and fitting the SNV trinucleotides to the signatures.14 We and others7, 8 used the R package MutationalPatterns (version 3.14.0) to extract signatures, whereas some studies used the SigProfilerExtractor4 or the SigProfilerSingleSample.5, 6 When applying the latter tool, SBS5 was enriched in our cases as well (data not shown).
The frequencies of the SBS signatures differed to some extent among the genetic subtypes (Figure 1). The most common in HeH were SBS1, SBS8, SBS18, SBS3, SBS5, and SBS40 (Figure 1). The clock-like signature SBS1 was prominent in this genetic subtype, suggesting that spontaneous, age-related mutations might play an important role in HeH. It has been reported that the ultraviolet light-associated SBS7a signature is typical for HeH and that this could be due to ultraviolet light exposure of preleukemic HeH cells in dermal blood;5, 6 however, we did not find this signature to be enriched in our HeH cases. As mentioned, this may be due to different tools for extraction and fitting of signatures.
In the ETV6::RUNX1 group, the most common signatures were SBS13, SBS2, SBS1, SBS8, SBS39, and SBS40 (Figure 1). SBS13 and SBS2, associated with increased activity of the APOBEC family of cytidine deaminases, have been reported to be enriched in this genetic subtype in several previous studies (Table S5). APOBEC promotes mutagenesis15 and this most likely explains the higher frequency of SNVs/indels in ETV6::RUNX1 (Figure S7).
The top signatures in TCF3::PBX1 were SBS1, SBS40, SBS18, SBS5, SBS17b, and SBS 30 (Figure 1). There was a relatively low absolute SBS contribution in this genetic subtype, which may be explained by the fact that frequencies of SNVs in TCF3::PBX1 were generally lower than in the other subtypes (Figures S7). This is also in line with the low number of driver mutations in TCF3::PBX1.5 A few previous studies (Table S5) have also reported that SBS1 and SB5 are common in this subtype.
In the B-other group, SBS1, SBS18, SBS13, SBS2, and SBS40 were the most frequent signatures (Figure 1). However, considering that this group is genetically, clinically, and most likely etiologically highly heterogenous,16 the overall mutational signature patterns are of less interest. Indeed, prior studies (Table S5) have reported somewhat different patterns of SBS signatures in B-other, with SBS7a (UV light exposure), SBS18 (ROS), and SBS9 (mutations induced during replication by polymerase eta) being common in some studies. Brady et al.5 ascertained signatures in different subtypes of B-other and reported, for example, enrichment of SBS18 (ROS) in PAX5alt and MEF2D-rearranged cases (Table S5). We also found enrichment of SBS18 in PAX5alt (Figure 1), but in contrast to Brady et al.,5 we found no evidence that the SBS18 signature increased by age in our patient cohort. Interestingly, the SBS18 signature was not particularly common in HeH, ETV6::RUNX1, and TCF3::PBX1 cases with PAX5alt (Figure 1), indicating that ROS-induced DNA damage is context-dependent. Two of the B-other cases without PAX5alt (#68 and 80) were characterized by a high contribution of SBS2 and SBS13, similar to the ETV6::RUNX1 cases (Figure 1). Indeed, case 68 was shown by RNA-seq to be ETV6::RUNX1-like.17 Unfortunately, gene expression analysis could not be performed in case 80 due to the lack of RNA; however, this case did not harbor any ETV6 and IKZF1 aberrations, which are frequent in ETV6::RUNX1-like cases.17
We next compared SBS signatures between major and minor clones in the cases with ETV6::RUNX1, TCF3::PBX1, and B-other (Supporting Information and Figure S12); such comparisons have not been reported previously. These analyses revealed that the major clones of PAX5alt B-other cases were enriched for SBS18 (Figure S13), suggesting that ROS-induced DNA damage occurs early in such cases, whereas the minor subclones of ETV6::RUNX1 had a high contribution of the SBS2 and SBS13 signatures (Figure S14), indicating that increased activity of the APOBEC family occurs later in the leukemogenic process of this subtype. Previously, van der Ham et al.8 reported that the frequencies of some SBS signatures vary between diagnostic and relapse samples of BCP ALL. Together with the present data, this shows that signatures differ among major clones and minor subclones both at diagnosis and during disease progression.
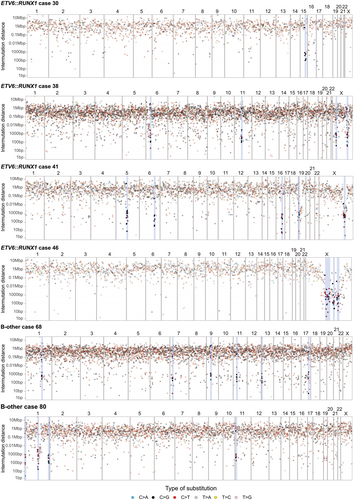
None of the 84 BCP ALL cases displayed any signs of chromothripsis; thus, large numbers of localized copy number states alternations seem to be rare in BCP ALL. However, kataegic regions were detected in six (7%) of the cases (#30, 38, 41, 46, 68, and 80; Figures 2 and S15). It is noteworthy that all these cases were characterized by enrichment of the APOBEC-associated SBS2 and SBS13 signatures and that five of them were ETV6::RUNX1 or ETV6::RUNX1-like (#30, 38, 41, 46, and 68). Thus, kataegis was found in five (21%) of 24 ETV6::RUNX1/ETV6::RUNX1-like cases. APOBEC-induced mutagenesis is a likely cause of regional hypermutation in these cases, as has been proposed in other cancers.9, 15 Taken together, ETV6::RUNX1 and ETV6::RUNX1-like cases not only have similar gene expression profiles and favorable outcomes,16, 17 but the present findings show that they are also characterized by similar mutational signatures and a high frequency of kataegic regions, suggesting that their etiologies and underlying pathogenetic mechanisms may be similar.

ACKNOWLEDGMENTS
This study was supported by grants from the Swedish Cancer Society (23 2694 Pj), the Swedish Childhood Cancer Foundation (TJ2020-0024, PR2024-0002, and PR2024-0058), the Crafoord Foundation (20230778 and 20240747), and Governmental Funding of Clinical Research within the National Health Service. Sequencing was performed by the SNP&SEQ Technology Platform in Uppsala. This facility is part of the National Genomics Infrastructure (NGI) Sweden and Science for Life Laboratory. The SNP&SEQ Platform is also supported by the Swedish Research Council and the Knut and Alice Wallenberg Foundation. The computations were performed on resources provided by LUNARC through Lund University under Project LSENS CSENS2024-3-4.
AUTHOR CONTRIBUTIONS
Rebeqa Gunnarsson planned and performed research and wrote the article. Minjun Yang performed the bioinformatic analyses and wrote the article. Andrea Biloglav, Henrik Lilljebjörn, Linda Olsson-Arvidsson, Kristina B. Lundin-Ström, Thoas Fioretos, and Kajsa Paulsson performed research. Anders Castor provided patient samples and clinical data. Bertil Johansson planned the research and wrote the article. The article was reviewed and approved by all the authors.
CONFLICT OF INTEREST STATEMENT
The authors declare no conflicts of interest.
FUNDING
This study was funded by the Swedish Cancer Society (23 2694 Pj), the Swedish Childhood Cancer Foundation (PR2020-0033, TJ2020-0024, PR2024-0002, and PR2024-0058), the Crafoord Foundation (20230778 and 20240747), and Governmental Funding of Clinical Research within the National Health Service.
Open Research
DATA AVAILABILITY STATEMENT
The dataset generated during the current study will be made available in the EGA depository upon its completion. Until then, data are available from the corresponding author upon request through the following doi:10.6084/m9.figshare.28053263 (WGS dataset).


