Spatio–temporal patterns of cognitive control revealed with simultaneous electroencephalography and functional magnetic resonance imaging
Funding information: Canadian Institute of Health Research Foundation
Abstract
Optimal performance depends in part on the ability to inhibit the automatic processing of irrelevant information and also on the adjusting the level of control from one trial to the next. In this study, we investigated the spatio–temporal neural correlates of cognitive control using simultaneous functional magnetic resonance imaging and electroencephalography, while 22 participants (10 women) performed a numerical Stroop task. We investigated the spatial and temporal dynamic of the conflict adaptation effects (i.e., reduced interference on items that follow an incongruent stimulus compared to after a congruent stimulus). Joint independent component analysis linked the N200 component to activation of anterior cingulate cortex (ACC) and the conflict slow potential to widespread activations within the fronto–parietal executive control network. Connectivity analyses with psychophysiological interactions and dynamic causal modeling demonstrated coordinated engagement of the cognitive control network after the processing of an incongruent item, and this was correlated with better behavioral performance. Our results combined high spatial and temporal resolution to propose the following network of conflict adaptation effect and specify the time course of activation within this model: first, the anterior insula and inferior frontal gyrus are activated when incongruence is detected. These regions then signal the need for higher control to the ACC, which in turn activates the fronto–parietal executive control network to improve the performance on the next trial.
1 INTRODUCTION
Cognitive control refers to top-down processes needed when relying on an automatic mode would be inefficient (Diamond, 2013; Stokes, Buschman, & Miller, 2017). It is often studied by presenting individuals with incongruent or conflicting stimuli (e.g., color word in a mismatched font color in the Stroop task), which are typically associated with slower responses and more errors. Previous work in animals and humans has associated cognitive control processes with activity of prefrontal cortex (see Miller & Cohen, 2001; Buschman & Miller, 2014, for reviews). Although human neuroimaging studies have consistently identified a set of frontal and parietal regions involved in cognitive control (e.g., Breukelaar et al., 2017; Cole & Schneider, 2007), the dynamic interplay within the presumed cognitive control network engaged in trial-to-trial adjustments of interference processing is poorly understood.
The sequential modulations of cognitive control can be investigated using manipulations that probe conflict adaptation, defined as reduced interference following an incongruent compared to a congruent trial (Duthoo, Abrahamse, Braem, Boehler, & Notebaert, 2014; Gratton, Coles, & Donchin, 1992). The detection and resolution of interference are proposed to elicit increased control and better interference processing on the subsequent trial (Botvinick, Braver, Barch, Carter, & Cohen, 2001). Conversely, following a congruent trial, the activation of cognitive control processes is reduced, and interference effects are larger (e.g., Bailey, West, & Anderson, 2010; Braver, 2012; West, Bailey, Tiernan, Boonsuk, & Gilbert, 2012).
Electroencephalography (EEG) studies have revealed two main components associated with conflict adaptation. The N200 component (fronto-central negativity at around 200–350 ms after stimulus presentation) shows larger negativity on incongruent trials following congruent compared to incongruent trials (e.g., Iannaccone et al., 2015; see Larson, Clayson, & Clawson, 2014, for a review). It is interpreted as reflecting conflict detection and increased interference (e.g., Folstein & Van Petten, 2008; Yeung, Botvinick, & Cohen, 2004). Another component, the conflict slow potential (SP; centro-parietal positivity at around 500 ms after stimulus presentation), exhibits larger positivity on incongruent trials following congruent compared to incongruent trials and is also associated with increased engagement of cognitive control during interference processing (e.g., Larson, Kaufman, & Perlstein, 2009; West, Jakubek, Wymbs, Perry, & Moore, 2005). Studies using source localization have suggested that anterior cingulate cortex (ACC) is implicated in the generation of the N200 (e.g., Ladouceur, Dahl, & Carter, 2007; Yeung et al., 2004), while the conflict SP may originate from prefrontal and posterior regions (Larson et al., 2014; West et al., 2005). However, EEG cannot precisely localize the generator of activations.
Research using functional magnetic resonance imaging (fMRI) has identified frontal regions implicated in conflict adaptation. The ACC is often hypothesized to play a key role in conflict detection and reactive adjustments, with larger activation on incongruent trials when the previous trial was congruent than incongruent (e.g., Carter et al., 2000; Kerns et al., 2004). Also, dorsolateral prefrontal cortex (DLPFC) is more activated on incongruent trials after incongruent than congruent trials and is therefore thought to be associated with the proactive engagement of cognitive control (e.g., Egner & Hirsch, 2005; Lesh et al., 2013; Sheth et al., 2012). However, most current frameworks of cognitive control (e.g., Buschman & Miller, 2014; Koechlin, Ody, & Kouneiher, 2003; Volle et al., 2008) essentially rely on fMRI data, which lacks the temporal resolution to provide a fine-grained measure of the sequential modulations of brain activations and their interaction during conflict adaptation. Furthermore, until now, the spatial extent and temporal dynamics of brain networks associated with conflict adaptation have not been investigated simultaneously.
Here, we used simultaneous recording of EEG and fMRI to characterize the brain network associated with conflict adaptation with high spatial and temporal resolution during a numerical Stroop task (Besner & Coltheart, 1979; Henik & Tzelgov, 1982). Although conflict adaptation likely relies of brief spatially discrete activations and interactions, unimodal (EEG or fMRI alone) studies may have difficulties in capturing the relevant circuitry. Previous work showed that EEG-fMRI combination could overcome the limitations of unimodal imaging and provide a fine-grained specification of spatial–temporal dynamics relevant to conflict adaptation (e.g., Baumeister et al., 2014; Dong et al., 2014; Frank et al., 2015; Pisauro, Fouragnan, Retzler, & Philiastides, 2017). We used the numerical Stroop paradigm to study the sequential modulations of cognitive control processes because of the involvement of cognitive control processes during numerical and arithmetic processing (see Hinault & Lemaire, 2016b; Hinault et al., 2016a, for reviews). Using a numerical Stroop task also allows to control for the alternative accounts to conflict monitoring previously raised in “classical” conflict tasks (see Duthoo et al., 2014 for a review). Indeed, given the large number of problems and possible solutions, sequential modulations in the numerical Stroop can difficultly be accounted for in terms of learning of stimulus–response associations (see Duthoo et al., 2014 for a review). Moreover, as the number of congruent and incongruent items is equal in this paradigm, sequential modulations of congruency effects cannot be explained by higher discriminability of incongruent items. The main goal of our study was to investigate (a) the neural network underlying conflict adaptation and (b) the evolution of activation within this network over time on a trial-by-trial basis. More specifically, we were interested in the modulation of the spatial–temporal dynamic associated with the processing of an incongruent trial as a function of the congruency of the immediately preceding trial. We thus expected to observe spatial and temporal differences in brain activity between cI and iI sequences.
2 MATERIALS AND METHODS
2.1 Participants
Twenty-two volunteers participated in this experiment (10 women, mean age 23.8 ± 4.5 years). All participants were right handed and reported normal or corrected-to-normal vision. Exclusion criteria included claustrophobia and metal in the body. No participant had a history of major medical problems, prescription medication use (except oral contraceptive), psychiatric or neurological illness, or head trauma. Participants were informed about procedures and goals of the study and gave their informed consent. The study was approved by the Montreal Neurological Institute Research Ethics Board. Participants were paid $75. Twenty-three participants were recruited, but one was excluded from the analyses due to accuracy below 50% in several experimental blocks.
2.2 Experimental paradigm
The experiment was implemented in OpenSesame software (Mathôt, Schreij, & Theeuwes, 2012). A numerical Stroop task was used (Beldzik, Domagalik, Froncisz, & Marek, 2015; Cohen Kadosh, Gevers, & Notebaert, 2011; Cohen Kadosh, Linden, Gevers, Berger, & Henik, 2007; Henik & Tzelgov, 1982; Soltész, Goswami, White, & Szűcs, 2011; Szűcs & Soltész, 2007, 2012). Stimuli consisted of two Arabic numerals displayed side by side on a computer monitor, on either side of the center point. Participants were asked to identify the numerically larger digit, regardless of font size. Two types of trials were used in equal proportions. In congruent trials, the numerically larger digit was also displayed in a larger font size. In incongruent trials, the numerically larger digit was displayed in the smaller font size. To study the conflict adaptation effect, the congruency of trials was manipulated to create four types of two-trial sequences: congruent–congruent (cC), congruent–incongruent (cI), incongruent–congruent (iC), and incongruent–incongruent (iI). The digits 2–8 were used. Following previous work (Cohen Kadosh & Dowker, 2015), the digit 5 was excluded. Two internumerical distances were used (Kaufmann et al., 2005): distance 1:2–3, 3–4, 6–7, 7–8 and distance 4:2–6, 3–7, 4–8. Stimuli were presented at the following size and visual angles: Arial font-size 55: height 2.86°, width 1.91°; arial font-size 73: height 3.81°, width 2.48°. The stimuli were pseudo-randomly sampled so that there was the same distribution of items in each of the four two-trial sequences. Each digit and each distance was present equally often in the four trial types, and the left/right position of the numerically larger digit was balanced across trials. The task was constructed so that the correct responses were made equally often with the left and the right button. Stimuli were arranged in five blocks, with each block composed of 129 trials, amounting to a total of 645 trials, with an equal distribution of trial sequences across blocks. EEG data were processed with EEGLAB (Delorme & Makeig, 2004). Only event-related potentials (ERPs) corresponding to correct answers were analyzed. Trials that followed an error and the first trial of each block were also excluded. The averages ± standard deviations in the number of epochs used in analyses for cI and iI trials were, respectively, 72 ± 24, and 72 ± 22, with a minimum number of 38 trials per participant per condition.
Participants gave their answer via a MRI-compatible two-button box (left button to select the item on the left and vice-versa). All participants completed a short training session of 18 trials outside the scanner. Instructions emphasized both accuracy and speed. There was a pause of approximately 30 s after each block. The order of the blocks was counterbalanced between participants to control for fatigue. Each trial began with the presentation of a fixation cross for a jittered period of 1,500−1800 ms (1,500, 1,600, 1,700, and 1800 ms; Figure 1). Then, the two digits were presented, for a maximum duration of 1,500 ms. The next trial started if no response was given during this time period.

EEG was recorded simultaneously with fMRI. After the task instructions were reviewed, the EEG cap was fit to the participant's head and they entered the MRI scanner. The MRI-compatible button box was placed on the participant's right side. Participants were reminded to keep their eyes fixed upon the white fixation cross and to try to lie as still as possible. Extra padding was placed around the head to minimize the head motion, which can generate EEG and fMRI artifacts (e.g., Fellner et al., 2016). The task stimuli were projected onto a screen situated at the rear of the magnet, which the participants viewed via a mirror attached to the MRI head coil. The full session (including the installation of the EEG cap) lasted no longer than 90 min.
2.3 EEG recording and preprocessing
The study followed the best current practice for simultaneous EEG-fMRI studies (Mullinger, Castellone, & Bowtell, 2013; Ullsperger & Debener, 2010). EEG was recorded continuously inside the MR-scanner with 64 electrodes mounted on an elastic cap according to the 10–20 standard system (EasyCap-MR; Brain Products, Munich, Germany). As there is no explicit recommendation in the cited current practice, the sampling rate was selected following previous work. EEG was recorded with a sampling rate of 1,000 Hz, as this rate has been shown to be required to efficiently remove gradient artifacts (e.g., Walz et al., 2014). The ground electrode was located between the 10/20 positions of FCz and Fz and the reference was located between the 10/20 positions of Cz and CPz on the 64-electrode cap. A SyncBox (Brain Products) was used to synchronize the clock output of the MR scanner with the EEG acquisition and to improve the removal of MR gradient artifacts from the EEG signal. The electrocardiogram (ECG) was recorded with an electrode on the left lower back for removal of ballistocardiogram (BCG) artifacts. We used two MR-compatible 32-channel amplifiers (BrainAmp MR, Brain Products) that are not saturated by MR gradients. Cables connecting cap and amplifiers were secured to prevent any additional movement-related artifacts. Following previous simultaneous EEG-fMRI studies, electrode impedance was strictly maintained below 25 kΩ, with a majority of electrodes between 10 and 20 kΩ (e.g., Frank et al., 2015; Pisauro et al., 2017).
The EEG signal recorded inside the MRI scanner is contaminated with gradient artifacts and BCG artifacts because of magnetic induction in the EEG wires. Because we synchronized EEG acquisition with scanner clock output, we were able to detect and use scanner timestamps of volume acquisition in the EEG signal. Gradient artifacts were removed using the average artifact subtraction method (Allen, Josephs, & Turner, 2000; Allen, Polizzi, Krakow, Fish, & Lemieux, 1998) with the BERGEN plugin (Moosmann et al., 2009). MR gradient artifacts were removed using a moving average width of 30 MR volumes. Data were subsequently low-pass filtered at 70 Hz and down-sampled to 250 Hz. First, each heartbeat was identified based on ECG activity. Based on combined adaptive thresholding followed by a correction algorithm, the Gaussian weighted means of BCG artifacts were then removed from the continuous data using the FMRIB plugin (Niazy, Beckmann, Iannetti, Brady, & Smith, 2005). Continuous EEG data were then filtered (0.3–40 Hz bandpass) and re-referenced using the algebraic average of the left and right mastoid electrodes (Luck, 2005). Independent component analysis (ICA), as implemented in EEGlab (runica algorithm), was used to remove residual gradient and BCG artifacts, eye-blinks, and eye-movement artifacts. Note that the ECG channel was removed prior to ICA analysis. ERPs containing horizontal eye movements or activity exceeding ±50 μV were rejected. Also, any epoch with a channel containing amplitudes of more than five standard deviations from the epoch mean was rejected. After artifact removal, continuous EEG data were epoched ([−200, 800] ms stimulus based), with the 200 ms prestimulus period serving as baseline. Artifact-free epochs for each experimental sequence were averaged separately to obtain ERPs in each participant. We compared cI trials (i.e., incongruent trials, when the previous trial was congruent) to iI trials (i.e., incongruent trials, when the previous trial was incongruent; see also Egner, 2011; Jarcho et al., 2013; Kerns et al., 2004; Hinault, Dufau, & Lemaire, 2014; Hinault, Lemaire, & Phillips, 2016; Hinault, Badier, Baillet, & Lemaire, 2017; Roquet, Hinault, Badier, & Lemaire, 2018; Sheth et al., 2012; Yuan et al., 2011). The rationale for this contrast was that these trials were expected to reveal distinct neurophysiological patterns during the processing of the current incongruent trial, as a function of the previous trial (congruent vs. incongruent), indicative of proactive control.
Source reconstruction and analyses were performed using Brainstorm (Tadel, Baillet, Mosher, Pantazis, & Leahy, 2011). The individual digitized head shape (Polhemus Fastrak, Polhemus Inc., Colchester, VT) and individuals' anatomy were used to constrain the source reconstruction. FreeSurfer (Fischl, 2012) was used to generate cortical surfaces and automatically segment cortical structures from each participant's T1-weighted anatomical MRI. The EEG forward model was obtained from a symmetric boundary element method (BEM model; OpenMEEG; Gramfort, Papadopoulo, Olivi, & Clerc, 2010; Kybic et al., 2005), fitted to each electrode's spatial positions (Huang, Mosher, & Leahy, 1999). A cortically constrained, sLORETA-normalized minimum-norm estimate (MNE) procedure was applied to estimate the cortical origin of the ERP signals (15,000 vertices on cortex; Hämäläinen & Ilmoniemi, 1994; Hauk, 2004). The MNE was weighted by a sample estimate of the sensor noise covariance matrix (Dale et al., 2000) obtained from the prestimulus baseline, in each of the participants, and used to improve data modeling, as typical in MNE approaches (Baillet, 2017). Furthermore, source analyses were guided by Blood-Oxygen-Level dependent (BOLD) activations in fMRI contrasts for each condition to define the analyzed regions of interest (ROI).
2.4 fMRI acquisition and preprocessing
Individuals were scanned with a 3 T Siemens TIM Trio MRI scanner with a 12-channel head coil. The helium pump and internal cooling of the MRI scanner were switched off during fMRI acquisition to reduce EEG artifacts. Total scanning time was approximately 45 min. Following localizer scans, T1-weigthed images were recorded with a 3D MP-RAGE sequence (Field of view: 256 × 256 × 176 mm, sagittal orientation, 1 × 1 × 1 mm voxel size, TR: 2300 ms, TE: 2.9 ms, flip angle: 9°). FMRI data were then acquired while participants performed the task, using a whole brain gradient echo planar imaging sequence sensitive to BOLD contrast in 25 slices (TR: 2,000 ms, TE: 28 ms, 3.5 mm slice thickness, voxel sizes: 3 × 3 × 3 mm, FA: 77°, FOV: 224 × 224 × 88 mm). Magnetic field inhomogeneities due to the EEG cap in the scanner were estimated using a GRE field mapping sequence.
FMRI data were analyzed using Statistical Parametric Mapping 12 (SPM12; Wellcome Trust Centre for Neuroimaging, London, UK, http://www.fil.ion.ucl.ac.uk/spm). We first performed a distortion correction with the fieldmap and slice timing correction. Functional images were realigned to correct for head motion, high-pass filtered (0.01 Hz) to remove signal drift, normalized into the Montreal Neurological Institute (MNI) stereotaxic space with trilinear interpolation, and convolved spatially with a 3D isotropic Gaussian kernel (8 mm Full Width at Half Maximum [FWHM]) to improve signal-to-noise ratio. Regressors were added in the following order: cC sequences, cI sequences, iC sequences, iI sequences, error trials, and motion parameters. First-level statistical analyses were carried out using a general linear model (GLM) with the following regressors of interest: incongruent trials when the previous trial was congruent (cI trials) and incongruent trials when the previous trial was incongruent (iI trials). Trials with RT < 150 ms, congruent trials, error trials and trials that followed an error were also modeled. The head realignment parameters were included in the GLM as confounds. The onset of each event was convolved with a boxcar function of duration of the corresponding reaction time. The beta estimates were calculated for each regressor with a canonical hemodynamic response basis function. Data were combined across blocks using a fixed-effect model and across participants using a mixed effects linear model. We applied a voxel-wise t-test to compare cI and iI trials (see below). The average variance inflation factor (1/[1-R2]), estimated with the Model Assessment, Comparison and Selection (MACS) toolbox (Soch & Allefeld, 2017), was 1.01. A Variance Inflation Factor (VIF) indicates a problematic amount of collinearity when superior to five (James, Witten, Hastie, & Tibshirani, 2013). Moreover, the correlation between the cosine angles of the regressors was 0.36. Therefore, although problems occur with short inter-trial intervals (but see Iannaccone et al., 2015; Wang et al., 2015; Worhunsky et al., 2012, e.g., for examples of short successions), our results cannot be interpreted as reflecting multicollinearity of the regressors.
2.5 Joint independent component analyses
We used the method proposed by Calhoun, Adali, Pearlson, and Kiehl (2006) and validated by Mijović et al. (2012). The Fusion ICA Toolbox (http://icatb.sourceforge.net/) was used to fuse ERP components derived from EEG time courses with the contrasts of the fMRI activation map (e.g., Edwards, Calhoun, & Kiehl, 2012; Masterton, Jackson, & Abbott, 2013). The method assumes that temporal components of the ERP and spatial components of a statistical brain activation map of the same condition covary if they originate from the same source in the brain. This technique simultaneously identifies the components from both modalities (e.g., Calhoun et al., 2006; Mas-Herrero, Ripollés, HajiHosseini, Rodríguez-Fornells, & Marco-Pallarés, 2015). Using the Infomax algorithm (Bell & Sejnowski, 1995), the independence between spatial fMRI and ERP components was maximized and both their shared unmixing matrix and the fused ERP/fMRI sources were calculated. The joint independent component analysis (jICA) was performed across subjects, by combining individual time courses from ERP epochs of a single electrode with participants' fMRI t-maps from the iI versus cI trials and cI versus iI trials. The number of components was estimated based on the minimum description length (MDL) criteria. To investigate the N200 component, data from AF4 were included in the ICA fusion analyses because it was the channel at which the difference between cI and iI trials was maximal, in line with previous jICA work (e.g., Edwards et al., 2012). Data from Cz were used to investigate the conflict SP component. ERP components were first regressed against the mean time course and then ranked according to their respective contribution to the mean time course. The ICA component with the maximum contribution to either N200 or conflict SP was further analyzed. The N200 component was identified as a negative deflection at around 200 ms and the conflict SP was identified as a positive deflection after 500 ms. The corresponding fMRI components were z-scored and thresholded at p < .001 (Z > 3.1; Doñamayor, Heilbronner, & Münte, 2012).
2.6 Generalized psychophysiological interactions
Generalized psychophysiological (gPPI) was used to explore task-specific changes in the functional connectivity between brain regions (Friston, Stephan, & Frackowiak, 1997). We used the generalized form of PPI proposed by McLaren, Ries, Xu, and Johnson (2012) to model all of the task states (http://www.nitrc.org/projects/gppi). Based on fMRI activations from GLM analyses and the literature, we selected the left ACC (x = −9, y = 4, and z = 38, MNI coordinates, 5 mm radius sphere at the local peak) as a seed region. This was the peak activation of ACC in the fMRI results for the cI versus iI trials contrast. A single-participant level analysis was performed using the GLM in SPM12, with a multiplication of the mean time course of the seed region with all the regressors. gPPI was used to examine the interactions with the seed region for cI versus iI trials and iI versus cI trials contrasts. Individual participant data were combined using a random effects model.
2.7 Dynamic causal modeling
To study network interactions involved in the conflict adaptation effect, we used dynamic causal modeling (DCM)-fMRI and DCM-EEG. The following ROIs were entered into the network: left dorsal ACC (x = −9, y = 4, z = 38—MNI coordinates of the ROI centroid); right DLPFC (x = 9, y = 49, z = 44); right inferior frontal gyrus (IFG; x = 57, y = 20, z = 26), left IFG (x = −-30, y = 32, z = −4), left inferior parietal sulcus (IPS; x = −54, y = −25, z = 32), left orbitofrontal cortex (OFC; x = −30, y = 53, z = 5), right anterior insula (x = 38, y = 26, z = −2), and left anterior insula (x = −36, y = 17, z = 5). Eight is the maximum number of ROI that can be implemented in the DCM model. These brain regions were selected in accordance with previous meta-analyses on cognitive control processes (e.g., Cieslik et al., 2013; de la Vega, Chang, Banich, Wager, & Yarkoni, 2016; Derrfuss, Brass, Neumann, & von Cramon, 2005; Nee et al., 2013; Niendam et al., 2012) and previous DCM work (e.g., Bönstrup, Schulz, Feldheim, Hummel, & Gerloff, 2016; Ma et al., 2015; Schlösser et al., 2008), while the coordinates were based on task-related brain activations from results of fMRI, jICA, and gPPI analyses obtained in this study. Brain activations were extracted as the first eigenvariate from 6 mm diameter spheres centered on the peak coordinates.
In the bilinear state equation of DCM (Figure 5e), matrix A describes the endogenous context-independent coupling within the network. Matrix B represents the modulation of these couplings by experimental parameters. Finally, matrix C specifies the regions that receive the exogenous modulations on neural couplings. Here, as we wanted to investigate the differences of couplings within the network of sequential modulations as a function of cI and iI trials, only matrix B is reported (see also Stephan et al., 2010).
Similar to previous DCM experiments (e.g., Bönstrup et al., 2016), the endogenous network (i.e., Matrix A) was formulated as unrestricted and fully connected for both DCM-fMRI and DCM-EEG. The resulting model was inverted separately for cI and iI trials in each participant. DCM12, as implemented in SPM12, was used for effective connectivity analyses. For DCM-EEG, the model was run on the whole epoch. The model used the same fMRI derived coordinates as for DCM-fMRI. As routinely implemented in the DCM model of SPM12, the same symmetric BEM model as for the EEG source analyses was computed as a forward model based on individual T1-weighted structural images and individual electrode positions. Group level post hoc optimization was conducted by selecting all inverted models (one per participant and per condition).
2.8 Experimental design and statistical analyses
Trials with RT < 150 ms were excluded from analyses to reject fast guesses. Error trials and trials that followed an error were also excluded as was the first trial of each block. Mean behavioral performance (solution times and percentages of errors) were analyzed using 2(Previous congruency: congruent, incongruent) × 2(Current congruency: congruent, incongruent) repeated measures ANOVA. Significant interactions were followed by planned contrasts. Greenhouse–Geisser epsilon correction was used when necessary. Original degrees of freedom and corrected p values are reported. Unless otherwise noted, only effects significant to at least p < .05 (with Šidák correction to control the family wise error rate; Šidák, 1967) are reported. For ERP and source analyses, differences were tested for significance using cluster-based permutation tests (n = 1,000). A whole-brain t-test (FDR corrected) was used to determine whether significant source activations were present in other brain areas than the ROIs. No significant activation lasting at least 50 ms was observed elsewhere. Differences in source activation were tested using Time (50 ms windows) × ROIs × Trial type (cI trials, iI trials) repeated measure anova, with FDR correction for multiple comparisons (Table 6, Figure 6). For fMRI data, individual contrast images were entered into a one-sample t-test at the second (group) level to test between condition differences. Statistical images for fMRI and gPPI were thresholded at a multiple comparison corrected level of cluster FDR p < .001. For DCM, the group level optimal sparse model was found using Bayesian estimation of parameters, integrated in the spm_dcm_post_hoc routine (e.g., Ma et al., 2015). Correlations between behavioral performance and DCM and gPPI results were Šidák corrected for multiple comparisons.
3 RESULTS
3.1 Behavioral results
Participants were slower (544 ms vs. 499 ms; F[1,21] = 169.01, p = .001, Mean Standard error [MSe] = 2066.56, partial eta squared [np2] = 0.89) and less accurate (7.3% vs. 4.5%; F[1,21] = 19.52, p = .001, MSe = 7.85, np2 = 0.48) when solving current incongruent trials than current congruent trials, in line with a congruency effect. Furthermore, the congruency effect was modulated by the congruency of the previous trial, consistent with a conflict adaptation effect (Figure 1). Indeed, the Previous congruency × Current congruency interaction was significant for both reaction time (F[1,21] = 23.03, p = .001, MSe = 240.21, np2 = .52) and error rate (F[1,21] = 30.56, p = .001, MSe = 2.59, np2 = 0.59). Planned comparisons revealed that the congruency effect was reduced after an incongruent trial (29 ms, F[1,21] = 37.79, p = .001, MSe = 4.76, np2 = 0.64; 1.2%, F[1,21] = 4.35, p = .049, MSe = 0.56, np2 = 0.17) compared to after a congruent trial (60 ms, F[1,21] = 172.36, p = .001, MSe = 4.54, np2 = 0.89; 4.3%, F[1,21] = 30.06, p = 0.001, MSe = 0.79, np2 = 0.59). A significant RT difference was observed between cI and iI trials (F[1,21] = 33.22, p = .001, MSe = 244.57, np2 = 0.61), while differences were marginally significant between cC and iC trials (F[1,21] = 4.09, p = .056, MSe = 39.41, np2 = 0.16). Thus, the congruency of the previously solved trial was a strong determinant of performance when the current trial was incongruent, consistent with sequential adaptation. Additional analyses with either block or numerical distance as factors revealed no interactions with previous or current congruency (Fs < 1.5). Despite differences in accuracy, performance was quite high in every trial type (above 90%). Because there were so few trials with errors, we were not able to compare EEG data for correct versus incorrect trials. Analyses of percentages of errors revealed a main effect of current congruency, as more errors were committed on incongruent items than on congruent items (7.3% vs. 4.5%, respectively; F[1,21] = 19.52, p < .001, MSe = 7.85, np2 = .48). Also, the Previous congruency × Current congruency interaction was significant (F(1,21) = 30.56, p < .001, MSe = 2.59, np2 = .59), as congruency effects were smaller after an incongruent item (1.2%; F[1,21] = 4.35, p < .05, MSe = 0.56, np2 = 0.17) relative to after a congruent item (4.3%; F[1,21] = 30.06, p < .001, MSe = 0.79, np2 = 0.59). Planned comparisons also revealed that significantly more errors were committed on cI trials than on iI trials (F[1,21] = 11.31, p < .004, MSe = 1.25, np2 = 0.35).
3.2 EEG results
Activity during the baseline period was centered on 0 μV and differences between conditions during this period were of small amplitude (<1 μV) and nonsignificant. ERP analyses revealed a significant difference (p < .002), between 208 ms and 232 ms, at anterior right sites of the scalp (electrodes Fp2, F4, F8, T8, AF4, FC4, F6, C6, AF8, FT8, and FT10), with a larger negativity on cI trials than iI trials (N200 component, Figure 2). Significant differences (p < .001) also occurred between 532 and 568 ms, at right centro-parietal sites (electrodes P4, Cz, Pz, CP1, CP2, CP6, C2, PO3, PO4, P6, and CPz), with a greater positivity on cI trials than iI trials, in line with the conflict SP component (e.g., Larson et al., 2009; West et al., 2005). Additional analyses were conducted to investigate the difference between congruent and incongruent trials. Results revealed a significant difference (p < .04), between 460 and 508 ms, at anterior sites of the scalp (electrodes Fp1, Fp2, AF4, AF7, Fpz, Fz, FT9, AF3, F5), with a larger negativity on incongruent trials than on congruent trials (N450 component, Figure 2c).

3.3 fMRI results
The cI versus iI trials contrast showed activation of the left IPS, the left superior parietal lobule (SPL), left anterior insula, and the left postcentral gyrus. Most importantly, frontal activations were found, including bilateral IFG and left ACC. The iI versus cI trials contrast showed activations in the right DLPFC (Table 1 and Figure 3a). Additional analyses were conducted to investigate the difference between congruent and incongruent trials. Significant effect was not found in the congruent versus incongruent trials contrast. However, the incongruent versus congruent trials contrast revealed activation of the right DLPFC, right ACC, and left occipital cortex (Table 2 and Figure 3b).
| Contrasts | Regions (BA) | k | T | MNI coordinates | ||
|---|---|---|---|---|---|---|
| x | y | z | ||||
| CI vs. II sequences | Left IPS/SPL (7/40) | 2,617 | 9.09 | −18 | −44 | 62 |
| 7.18 | −6 | −49 | 56 | |||
| 6.68 | −54 | −25 | 32 | |||
| Right IFG (45/47) | 122 | 6.15 | 57 | 20 | 26 | |
| 4.20 | 42 | 20 | 8 | |||
| 3.89 | 48 | 20 | 27 | |||
| Left IFG (6) | 195 | 5.11 | −30 | 32 | −4 | |
| 4.74 | −27 | 8 | 44 | |||
| Left anterior insula (13) | 275 | 4.76 | −36 | 17 | 5 | |
| Left postcentral gyrus (1/40) | 100 | 4.82 | −57 | −19 | 23 | |
| 4.69 | −63 | −37 | 35 | |||
| 4.21 | −60 | −37 | 44 | |||
| Left ACC (24/32) | 266 | 4.42 | −9 | 27 | 25 | |
| 4.23 | −9 | 20 | 35 | |||
| 4.16 | −9 | 4 | 38 | |||
| II vs. CI sequences | Right DMPFC (9) | 429 | 10.86 | 9 | 49 | 44 |
| Right DLPFC | 9.51 | 12 | 50 | 45 | ||
| 8.76 | 28 | 42 | 44 | |||
- IPS = intraparietal sulcus; SPL = superior parietal lobule; IFG = inferior frontal gyrus; ACC = anterior cingulate cortex; DLPFC = dorsolateral prefrontal cortex; DMPFC = dorsomedial prefrontal cortex.

| Contrasts | Regions (BA) | k | T | MNI coordinates | ||
|---|---|---|---|---|---|---|
| X | Y | Z | ||||
| Incongruent vs. congruent trials | Left occipital cortex (18) | 78 | 5.12 | −26 | −64 | 2 |
| Right DLPFC/DMPFC (8/9/6) | 219 | 6.04 | 0 | 29 | 59 | |
| 5.05 | 6 | 57 | 38 | |||
| 4.86 | 3 | 20 | 62 | |||
| Right ACC (32/24) | 65 | 5.70 | 6 | 35 | −4 | |
- ACC = anterior cingulate cortex; DLPFC = dorsolateral prefrontal cortex; DMPFC = dorsomedial prefrontal cortex.
3.4 Joint-independent component analysis
The ICA component showing the N200 yielded a corresponding fMRI spatial map with activation of the right OFC (BA10), left ACC (BA32), and cuneus (BA17). The ICA component corresponding to the conflict SP was associated with activation of the left SPL (BA7), left IPS (40), right IFG (BA44), left IFG (BA47), and right DLPFC (BA 9) (Figure 4 and Table 3).

| Region | Brodmann area | Volume (cc) | MNI coordinates | Max T | ||
|---|---|---|---|---|---|---|
| X | Y | Z | ||||
| N200 component | ||||||
| Right OFC | 10 | 0.9 | −30 | +53 | +5 | 4.8 |
| Left ACC | 32 | 0.4 | −9 | +35 | +14 | 4.2 |
| Cuneus | 17 | 0.1 | −3 | −82 | +5 | 3.8 |
| Conflict SP | ||||||
| Left SPL | 7 | 0.3 | −27 | −49 | +63 | 4.4 |
| Left IPS | 40 | 0.1 | −50 | −44 | 56 | 3.7 |
| Right IFG | 44 | 0.3 | +56 | +21 | +23 | 3.8 |
| Left IFG | 47 | 0.4 | −30 | +32 | +04 | 4.2 |
| Right DLPFC | 9 | 1.2 | +54 | +24 | +28 | 5.1 |
- IPS = intraparietal sulcus; OFC = orbitofrontal cortex; IFG = inferior frontal gyrus; ACC = anterior cingulate cortex; SPL = superior parietal lobule; ICA: independent component analysisDLPFC = dorsolateral prefrontal cortex
3.5 Psychophysiological interactions (gPPI)
An ACC seed was defined based on BOLD activation on cI trials, with the assumption that ACC connectivity to frontal areas after conflict detection would identify areas belonging to a cognitive control network (e.g., Kerns, 2006; Kerns et al., 2004). No significant effect was found in the cI versus iI trials contrast. However, the iI versus cI trials contrast revealed significantly higher functional connectivity of ACC with the right IFG and right anterior insula (Figure 3c and Table 4). This connectivity was found to be positively correlated across subjects with behavioral congruency effects (i.e., reaction times on incongruent trials minus congruent trials) when the previous trial was congruent (r = 0.434, p < .041). This correlation suggests that individuals who displayed high congruency effects when the previous trial was congruent (when proactive processes were not engaged) also demonstrated increased connectivity between ACC and right IFG/anterior insula on iI trials, indicative of conflict adaptation.
| Regions (BA) | k | T | MNI coordinates | ||
|---|---|---|---|---|---|
| X | Y | Z | |||
| Right anterior insula (13) | 117 | 6.36 | 38 | 26 | −2 |
| Right putamen | 4.70 | 30 | 11 | −4 | |
| 4.40 | 36 | 23 | 2 | ||
| Right IFG (6) | 49 | 5.00 | 54 | 8 | 32 |
- ACC = anterior cingulate cortex; IFG = inferior frontal gyrus; PPI: psychophysiological interaction.
3.6 DCM (modulatory activity)
We defined eight ROIs based on previous fMRI, jICA, and gPPI results. The same eight ROIs were used for DCM-fMRI and DCM-EEG. Analyses at the group level revealed significant coupling differences as a function of the congruency of the previous trial (Figure 5b and Table 5). For DCM-fMRI, while after congruent trials significant couplings mainly involved the ACC, left IPS, right IFG and right anterior insula, almost all regions were engaged when the previous trial was incongruent (except the left IPS), with stronger couplings for left IFG. The overall greater coupling between all regions seen after incongruent trials is reflective of proactive control.

Model Modality |
Source fMRI |
Target | Estimate | p | Source EEG |
Target | Estimate | p |
|---|---|---|---|---|---|---|---|---|
| CI sequences | ACC | DLPFC | −1.30 | 1.00 | ACC | LIPS | 0.20 | 1.00 |
| ACC | LIPS | 1.13 | 1.00 | ACC | LOFC | 0.28 | 1.00 | |
| LIPS | ACC | −1.44 | 1.00 | DLPFC | RIFG | 0.28 | 1.00 | |
| LIPS | RIFG | 1.68 | 1.00 | LIFG | DLPFC | −0.19 | 1.00 | |
| RIFG | ACC | 0.32 | 1.00 | LIFG | LOFC | −0.07 | 1.00 | |
| RIFG | DLPFC | 1.54 | 1.00 | LIFG | RISL | 0.76 | 1.00 | |
| RIFG | LIPS | 3.15 | 0.80 | LIPS | RIFG | 0.57 | 1.00 | |
| RIFG | LISL | −4.35 | 0.69 | LIPS | LIFG | 0.16 | 1.00 | |
| RIFG | LOFC | −0.44 | 1.00 | LIPS | LISL | −0.55 | 1.00 | |
| RISL | LOFC | −0.69 | 1.00 | LISL | ACC | 0.48 | 1.00 | |
| RISL | RIFG | 0.70 | 1.00 | LISL | LIFJ | 0.06 | 1.00 | |
| – | – | – | – | LISL | LOFC | −0.15 | 1.00 | |
| – | – | – | – | LOFC | ACC | 0.50 | 1.00 | |
| – | – | – | – | LOFC | LIFG | 0.95 | 1.00 | |
| – | – | – | – | RISL | DLPFC | −0.49 | 1.00 | |
| – | – | – | – | RISL | LIFG | 0.33 | 1.00 | |
| II sequences | ACC | DLPFC | −1.85 | 1.00 | ACC | DLPFC | 0.41 | 1.00 |
| ACC | LOFC | 1.83 | 1.00 | ACC | LIFG | −1.01 | 1.00 | |
| ACC | RIFG | 0.07 | 0.81 | ACC | LIPS | 0.63 | 1.00 | |
| DLPFC | LISL | −0.26 | 1.00 | ACC | LOFC | −0.44 | 1.00 | |
| DLPFC | RIFG | 0.73 | 1.00 | ACC | RIFG | 0.23 | 1.00 | |
| LIFG | ACC | 2.71 | 1.00 | ACC | RISL | −0.21 | 1.00 | |
| LIFG | DLPFC | −2.26 | 1.00 | DLPFC | RIFG | −0.60 | 1.00 | |
| LIFG | RIFG | −0.14 | 1.00 | LIFG | LOFC | −0.26 | 1.00 | |
| LIPS | DLPFC | 2.18 | 0.80 | LIPS | RIFG | −0.08 | 1.00 | |
| LIPS | LOFC | −1.50 | 0.77 | LISL | ACC | −0.10 | 1.00 | |
| LIPS | RIFG | −0.29 | 0.84 | LISL | LIPS | 0.26 | 1.00 | |
| LISL | ACC | −0.32 | 0.80 | LISL | RIFG | −0.65 | 1.00 | |
| LISL | DLPFC | 1.04 | 0.84 | LISL | RISL | 0.37 | 1.00 | |
| LISL | RIFG | −0.57 | 1.00 | LOFC | LIFG | 0.13 | 1.00 | |
| LOFC | DLPFC | −1.57 | 1.00 | LOFC | LIPS | 0.01 | 1.00 | |
| LOFC | LISL | −1.71 | 1.00 | LOFC | RIFG | −0.64 | 1.00 | |
| RIFG | ACC | −0.47 | 1.00 | RIFG | ACC | 0.44 | 1.00 | |
| RIFG | LOFC | 0.68 | 1.00 | RIFG | LIPS | 0.41 | 1.00 | |
| RISL | ACC | 2.10 | 1.00 | RIFG | LOFC | 0.78 | 1.00 | |
| RISL | DLPFC | −0.10 | 1.00 | - | - | - | - | |
| RISL | LIPS | −1.71 | 1.00 | - | - | - | - |
- ACC = anterior cingulate cortex; DLPFC = dorsolateral prefrontal cortex; LIFG = left inferior frontal gyrus; LIPS = left intraparietal sulcus; LISL = left anterior insula; LOFC = left orbitofrontal cortex; RIFG = right inferior frontal gyrus; RISL = right anterior insula. Estimates = maximum a posteriori values of the posterior distribution (parameter magnitude estimates); p = posterior probability; bold entries are significant at a threshold of posterior ≥95% ; –No data.
Compared to the couplings derived from DCM-fMRI, DCM-EEG revealed similar but not identical results (Figure 5d and Table 5). In line with DCM-fMRI results, a larger number of significant couplings were found when the previous trial was incongruent, than when it was congruent. On iI trials, results show a larger number of significant couplings from and to ACC. On cI trials, significant couplings were observed in left IFG, left IPS, and left OFC. We down-sampled the EEG data to determine whether differences in sampling could account for differences between the EEG and fMRI DCMs, but similar results were found.
Correlations were found between individual behavioral performance and DCM coupling strengths. For DCM-fMRI, a positive correlation was found between RTs on cI trials (i.e., on incongruent trials, when the previous trial was congruent) and the left OFC-DLPFC coupling on iI trials (r = 0.424, p < .044). This suggests that subjects who experienced increased interference on cI trials demonstrated increased coupling between left OFC and DLPFC on iI trials, reflecting sequential adjustment to process conflict more efficiently. For DCM-EEG, a negative correlation was observed between the left IPS-left anterior insula coupling on cI trials and RTs on iI trials (r = −.459, p < .032), suggesting that increased coupling between these regions was associated with reduced interference on the following incongruent trial. Furthermore, posterior probabilities were used to perform 2 (Previous congruency) × 8 (ROIs) × 7 (Couplings) repeated measures ANOVAs on both DCM-fMRI and DCM-EEG data and to add the amplitude of the RT difference between cI and iI trials as a covariate. Results revealed a significant modulation of the Previous congruency × ROIs × Coupling by the covariate for both DCM-EEG and DCM-fMRI (F[42,840] = 1.49, p < .03, MSe = 1,249.77, np2 = 0.07, and F(42,840) = 1.70, p < .005, MSe = 0.002, np2 = 0.08, respectively), providing converging evidence that the tested model is related to behavioral performance. More specifically, individuals with the largest RT difference between cI and iI trials showed larger coupling values, this difference being larger for DLPFC and ACC on iI trials.
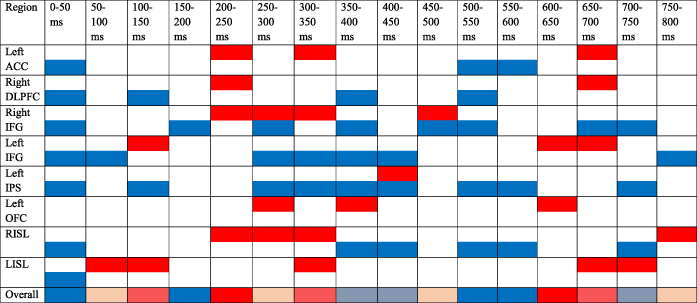
3.7 EEG source results
Most ROIs showed earlier and larger activations for iI trials than cI trials (Table 6, Figure 6), in line with larger and earlier activations of the network after the processing of an incongruent item. Only one ROI (left OFC) showed stronger, and one showed earlier (left anterior insula) activations for cI trials.
|
- ACC = anterior cingulate cortex; DLPFC = dorsolateral prefrontal cortex; LIFG = left inferior frontal gyrus; LIPS = left intraparietal sulcus; LISL = left anterior insula; LOFC = left orbitofrontal cortex; RIFG = right inferior frontal gyrus; ROI: regions of interest; RISL = right anterior insula. Plotted are significant activations from stimulus onset to 800 ms. Red corresponds to significantly larger activations for cI trials than for iI trials. Blue corresponds to significantly larger activations for iI trials than for cI trials. The last line represents the overall activation for every ROIs. Only activations that survived the FDR correction for multiple comparisons are displayed.

4 DISCUSSION
We investigated the spatio–temporal neural correlates of cognitive control using simultaneous fMRI-EEG and a numerical Stroop task. We investigated the entire data space by replicating the congruency effect and the larger N450, larger ACC and DLPFC activation for incongruent trials relative to congruent trials, observed in both arithmetic and nonarithmetic tasks (e.g., Cohen Kadosh et al., 2007; Grandjean et al., 2013; Tang, Hu, Li, Zhang, & Chen, 2013; see Larson et al., 2014, for a review). We also found behavioral evidence for conflict adaptation (i.e., reduced interference on items that follow an incongruent stimulus compared to after a congruent stimulus) with improvement in both RT and accuracy during iI relative to cI trials. We confirmed previous ERP and fMRI findings with greater N200 and conflict SP on cI than iI trials, and greater activation in prefrontal regions. The observed right-lateralization of the N200 is consistent with previous work using both arithmetic (e.g., Avancini, Galfano, & Szűcs, 2014, fig. 4) and nonarithmetic tasks (e.g., Al-Subari et al., 2015, fig. 11). Joint ICA linked the N200 to the ACC and the conflict SP to the fronto–parietal executive control network. Finally, connectivity analyses demonstrated increased engagement of the cognitive control network following incongruent items, associated with better behavioral performance. Across individuals, the sequential adjustments of the cognitive control network were correlated with response to interference on the previous trial. Results specified how activations within the cognitive control neural network differ as a function of previous interference resolution and identified the time course of these effects.
This study benefited from converging evidence from BOLD, jICA, and gPPI results to propose a neural model of cognitive control processes underlying conflict adaptation, which was then further tested with DCM. As a maximum of eight ROIs can be implemented in the DCM software used here, only brain regions that were consistently reported in prior meta-analyses (e.g., Nee et al., 2013; Niendam et al., 2012) were included in the model. Although some differences were found between DCM couplings for EEG and fMRI data, the key features converge in showing more couplings and larger coupling strengths on iI trials than on cI trials, indicative of proactive adaptation after incongruent trials. Furthermore, these coupling increases were correlated with better behavioral performance across individuals. Note that differences between DCM-EEG and DCM-fMRI have been previously reported (e.g., Bönstrup et al., 2016) and interpreted as reflecting distinct influence of neural activity on metabolic and neuroelectric signals (e.g., Hari et al., 2014).
Our results support a model of conflict adaptation in which IFG and anterior insula, key nodes of the salience network, are involved in the detection of interference. Then, they connect to ACC for conflict detection and further engagement of the cognitive control network. This engagement is triggered following the N200 signal, which may reflect a negative reward prediction error signal (Holroyd & Coles, 2002; Holroyd & Yeung, 2012) or incongruency (e.g.,Hyman, Holroyd, & Seamans, 2017). ACC may then activate fronto–parietal brain regions, such as OFC, DLPFC, and IPS to process interference when automatic responding would be maladaptive (see also Shenhav, Botvinick, & Cohen, 2013). ACC and IFG could also be involved in proactive adjustments from one trial to the next, to maintain the control network in a high state of activation. Our results contribute to the proposed model and provide information on spatial and temporal changes within the control network during interference processing and as a function of the previous trial.
We used jICA to simultaneously detect covariations of ERP and fMRI components across subjects (Calhoun et al., 2006) and identify the brain regions associated with the ERP components previously associated with conflict adaptation. Joint ICA analysis assumes that electrical and hemodynamic responses co-vary and relies on this covariation to identify components in time and space. Our jICA results provide empirical support for the role of ACC in the generation of N200 but also revealed the simultaneous engagement of OFC, and cuneus. The OFC has been associated with the engagement of cognitive control (e.g., Niendam et al., 2012), and the cuneus with inhibition (e.g., Crockford, Goodyear, Edwards, Quickfall, & El-Guebaly, 2005). Our results support the role of the N200 in both conflict detection and engagement of the control network reflecting a reactive mode. Joint ICA showed that the conflict SP was associated with activation of a widespread fronto–parietal network (SPL, IPL, IFG, and DLPFC). Such findings suggest that this component reflects the engagement of the cognitive control network during interference resolution.
The PPI analysis revealed that performance on iI trials was associated with increased connectivity between right anterior insula, right IFG, and ACC. These results are consistent with these three regions being hubs for conflict detection and engagement of control (e.g., Nee et al., 2013). This up-regulation of brain areas associated with cognitive flexibility and salience processing (anterior insula; e.g., Elton & Gao, 2014), and inhibitory control (ACC and IFG; e.g., Niendam et al., 2012) likely contributes to faster and more accurate conflict processing on the next trial, as demonstrated here. Indeed, correlations between PPI and the behavioral congruency effect reveal that high interference was associated with increased connectivity on the subsequent incongruent trial, across participants.
DCM results on cI trials highlighted the widespread engagement of the cognitive control network when no preparation was previously engaged. The couplings involving the right anterior insula could reflect the fact that the salience of incongruent trials plays a role in the activation of the cognitive control network. The ACC also showed couplings with the fronto–parietal executive network. Thus, results support a role for these regions in detecting interference and engaging the rest of the network, especially lateral prefrontal regions (e.g., Duverne & Koechlin, 2017; Shenhav et al., 2013). Left IFG and anterior insula also showed couplings with ACC and prefrontal regions, but only in DCM-EEG. We can hypothesize that some activations were too short in duration to be detected by DCM-fMRI. Insula and IFG are associated with cognitive flexibility and working memory effort (e.g., Nee et al., 2013) and could be involved in the (reactive) reorganization of cognitive control for incongruent trials when no preparation was engaged. DCM for cI trials also showed the engagement of the OFC, which has been associated with control of actions (e.g., Stalnaker, Cooch, & Schoenbaum, 2015). Coupling with left IPS is also interesting, as this brain region has been associated with number processing (see Menon, 2015, for a review). DCM results suggest a stronger involvement of number processing regions when no preparation to process conflict has been engaged.
On iI trials, DCM results revealed larger and stronger couplings, in line with sequential adjustments from one trial to the next, with faster and more accurate conflict monitoring after the processing of an incongruent trial, as confirmed by behavioral results. The ACC showed coupling with a major part of the frontal control network, suggesting that it is not restricted to conflict detection, but it is also involved in proactive adjustments. Moreover, the right IFG also showed couplings with frontal and parietal regions and appeared to play a role in faster and more accurate interference processing following incongruent trials. Proactive control on iI trials was also underpinned by couplings to and from prefrontal regions (OFC and DLPFC), which suggests that cognitive control processes are already in a high state of activation following incongruent trials.
EEG source results further specified the time course of activation within the conflict adaptation network. Indeed, stimulus encoding and interference detection were followed by the engagement of control for conflict resolution on the subsequent trial. Results highlighted more extensive and earlier brain activations on iI trials than on cI trials. These earlier activations were found during stimulus encoding but also later, during response preparation. Earlier activations of right anterior insula and IFG during cI trials support the theory that these brain regions are involved in the recruitment of the cognitive control network (see also Jahfari et al., 2012) and then connect to ACC. The right anterior insula and IFG are thought to signal salient events and to activate ACC during conflict detection (Menon & Uddin, 2010). On incongruent trials following an incongruent trial (iI trials), the salience network and the fronto–parietal executive network were activated earlier, during encoding of the items (e.g., before 200 ms, Dehaene, Spelke, Pinel, Stanescu, & Tsivkin, 1999), presumably to process interference faster and more accurately. Moreover, results showed the role of left OFC to process interference when no preparation was engaged, and of left and right IFG, and left IPS, in proactive adjustments after interference resolution.
Correlation between DCM couplings and behavior clarified how the proposed network could account for behavioral conflict adaptation. Indeed, the coupling between left OFC and DLPFC was positively correlated with the interference level on the preceding trial, when no preparation was engaged. This suggests that the detection and the processing of the interference led to sequential adjustments on the next trial. Conversely, the coupling between left IPS and left anterior insula appeared to be involved in proactive adjustments, as it was associated with better performance on the subsequent incongruent trial. Furthermore, when the behavioral difference between cI and iI trials was entered as a covariate in the analyses, individuals with the largest adjustments showed largest coupling strengths between prefrontal regions (on iI trials).
4.1 Limitations
This study provides new insights on the dynamic functional connectivity underlying conflict adaptation, but there are some limitations to acknowledge. First, relatively high impedances, although previously reported in simultaneous EEG-fMRI recordings, may have reduced the signal-to-noise ratio in the EEG data. However, the fact that the results are consistent with previous work suggests that they are genuine and not influenced by artifacts. Blink artifacts were removed after the correction for BCG artifact to mitigate against blink artifacts spreading across trials. In addition, ICA decomposition was used following preprocessing to remove remaining blink and scanner artifacts from the data. Moreover, short intervals between stimuli may have influenced our ability to detect differences between conditions. Additional analyses using VIF and correlation between regressors were too low to assume a multicollinearity issue. As stated in Section 2.4, our results are unlikely due to multicollinearity of the regressors. Finally, others have proposed different reference methods (e.g., Reference Electrode Standardization Technique [REST]; Dong et al., 2017) and using a higher sampling rate (e.g., 5,000 Hz) that may have allowed a better removal of the gradient artifacts. However, the sampling rate and the linked mastoid reference used here have been reported in the recent work (e.g., Frank et al., 2015; Pisauro et al., 2017; Walz et al., 2014), and no elements in the current data suggest that a significant distortion remained following preprocessing.
5 CONCLUSIONS
Results have implications for the current frameworks of cognitive control (e.g., Botvinick et al., 2001; Braver, Paxton, Locke, & Barch, 2009; Buschman & Miller, 2014; Holroyd & Yeung, 2012; Koechlin et al., 2003; Nee & D'Esposito, 2016; Shenhav et al., 2013; Volle et al., 2008), as they contribute to unravel the brain network engaged in conflict adaptation and how it accounts for behavioral performance. Results also benefited from the high temporal resolution of EEG to further specify the time course of activations within this network, and how the ERP components were related to activations of brain regions involved in conflict adaptation. Specifically, we show that the N200 relates to ACC activation, whereas the conflict SP appears to co-occur with activation of the distributed fronto–parietal control network. Previous frameworks mostly relied on fMRI data and were unable to provide a fine-grained characterization of the time course of brain activations during sequential modulations of cognitive control processes. The model that emerges from this experiment first includes the salience network (anterior insula, ACC and IFG) when incongruent trials are processed. This network marks salient events, detects interference, and signals the need for higher control. Then, the fronto–parietal executive control network (OFC, DLPFC, and IPS) is activated to resolve the interference. The IFG and ACC are involved in maintaining this network in a high state of activation to process interference faster and more accurately when the next trial is incongruent. Future work could aim to unravel the contribution of these networks over longer time scales (e.g., depending on the overall proportion of congruent and incongruent items in the task).
ACKNOWLEDGMENTS
We would like to thank Michael Ferreira for his help with the experimental set-up. This work was supported by a Canadian Institute of Health Research Foundation grant to Alain Dagher.
CONFLICT OF INTERESTS
The authors disclose any potential sources of conflict of interest.