Functional connectivity corresponding to the tonotopic differentiation of the human auditory cortex
Abstract
Recent research has demonstrated that resting-state functional connectivity (RS-FC) within the human auditory cortex (HAC) is frequency-selective, but whether RS-FC between the HAC and other brain areas is differentiated by frequency remains unclear. Three types of data were collected in this study, including resting-state functional magnetic resonance imaging (fMRI) data, task-based fMRI data using six pure tone stimuli (200, 400, 800, 1,600, 3,200, and 6,400 Hz), and structural imaging data. We first used task-based fMRI to identify frequency-selective cortical regions in the HAC. Six regions of interest (ROIs) were defined based on the responses of 50 participants to the six pure tone stimuli. Then, these ROIs were used as seeds to determine RS-FC between the HAC and other brain regions. The results showed that there was RS-FC between the HAC and brain regions that included the superior temporal gyrus, dorsolateral prefrontal cortex (DL-PFC), parietal cortex, occipital lobe, and subcortical structures. Importantly, significant differences in FC were observed among most of the brain regions that showed RS-FC with the HAC. Specifically, there was stronger RS-FC between (1) low-frequency (200 and 400 Hz) regions and brain regions including the premotor cortex, somatosensory/-association cortex, and DL-PFC; (2) intermediate-frequency (800 and 1,600 Hz) regions and brain regions including the anterior/posterior superior temporal sulcus, supramarginal gyrus, and inferior frontal cortex; (3) intermediate/low-frequency regions and vision-related regions; (4) high-frequency (3,200 and 6,400 Hz) regions and the anterior cingulate cortex or left DL-PFC. These findings demonstrate that RS-FC between the HAC and other brain areas is frequency selective.
1 INTRODUCTION
The human brain is a complex, spatially dissociated but functionally integrated network, and the integration between different neurons or neuronal populations is the basic feature of information processing. To understand the complex information processing in the human brain, it is necessary to identify the patterns of functional integration between anatomically separated brain regions (Cha et al., 2016). This identification requires us to understand the functional communication between neurons/neuronal populations from the perspective of functional integration and not simply relate neuronal activity to cognitive functions and behavioral data from a functional segmentation perspective (Cha et al., 2016). Resting-state functional connectivity (RS-FC) is defined as the temporal coherence of resting-state neuronal activity patterns between neurons or neuronal populations (Aertsen et al., 1989; Friston et al., 1993), and many studies have proposed that correlations in resting-state functional magnetic resonance imaging (fMRI) time series are a feasible method of detecting RS-FC (Lowe et al., 2000; Heuvel & Pol, 2010). Many studies have demonstrated that RS-FC within the sensory cortices has topological specificity, for instance, within the human visual (Heinzle et al., 2011; Kenet et al., 2003; Nauhaus et al., 2008) and somatosensory cortices (Cauda et al., 2011; Chen et al., 2011; Heuvel & Pol, 2010). Specifically, a recent study using resting-state fMRI of the human auditory cortex (HAC) showed that the RS-FC in the HAC is frequency-selective (Cha et al., 2016). However, to the best of our knowledge, no study to date has explored whether RS-FC between the HAC and other brain areas is differentiated by frequency.
The general lack of attention to this question is consistent with the view that the human auditory cortex is organized in a hierarchical fashion; the frequency-selective cortical regions (FSCRs) in the HAC are primarily responsible for the encoding of separate pure tones, and the cortical areas beyond the FSCRs in the HAC are responsible for combining separate pure tones into patterns and interacting with other brain regions (D Patterson et al., 2002; Griffiths et al., 1998; Zatorre & Salimpoor, 2013). This viewpoint persists despite the fact that many anatomical studies have demonstrated that the early auditory cortex in the HAC is directly connected to many other sensory cortices, for instance, the visual cortex (Beer et al., 2011; Eckert et al., 2008), the somatosensory cortex (SSC) (Beer et al., 2011; Budinger & Scheich, 2009) and the olfactory cortex (Budinger et al., 2006; Budinger & Scheich, 2009). Furthermore, Frühholz et al,. 2014 described a direct connection between the early auditory cortex and the amygdala. Considering that RS-FC is usually constrained by anatomical connectivity (Cha et al., 2016; Honey et al., 2009), these converging data suggest that there may be a direct functional integration between the FSCRs and other brain regions. Specifically, research using biocytin (Sigma Chemicals) injections to the Mongolian gerbil auditory cortex showed that although different frequency regions share some or almost all of their cortical connections, each region retains a unique group of cortical connections when the relative weights of connections are considered (Budinger et al., 2000). Because the auditory cortex of the Mongolian gerbil is similar to that of humans (Budinger et al., 2000), there may be a similar phenomenon in the human brain. In other words, RS-FC between the HAC and other brain areas may be differentiated by frequency.
Therefore, in this study, we hypothesized that RS-FC between the HAC and other brain areas would be differentiated by frequency. To test this hypothesis, we first identified FSCRs in the HAC using task-based fMRI and defined six regions of interest (ROIs) according to the responses to six tone frequencies. Then, the six ROIs were divided into three ROI groups, that is, a high-frequency (3200 and 6400 Hz), intermediate-frequency (800 and 1600 Hz), and low-frequency (200 and 400 Hz) ROI (Humphries et al., 2010). Then, the three ROI groups were used as seeds to determine RS-FC between the HAC and other brain regions. Finally, a repeated-measures one-way ANOVA (high, intermediate, and low frequencies) was used to determine whether RS-FC between the HAC and other brain areas was differentiated by frequency.
2 MATERIALS AND METHODS
2.1 Participants
Fifty right-handed participants (25 male, 25 female, ages 17–25) participated in our experiment after a hearing examination and signed the informed consent provided by the Brain Imaging Center of Faculty of the Psychology in Southwest University.
2.2 Stimuli
Stimuli used in the task-based experiment were simple sequences of pure-tone bursts (Fig. 1). The task-based fMRI session consisted of 3 functional runs, and each run consisted of 180 trials. Each trial lasted 3.4 s and consisted of four parts: a 700-ms baseline, a 300-ms stimulus presentation, 400 ms of quiet, and a 2-s gap. EEG recordings (used in another study) were only collected during the 400-ms quiet period, and task-based fMRI data were only collected during the 2-s gap. The frequency array used in the experiment was logarithmically spaced at 200, 400, 800, 1600, 3200, and 6400 Hz. Only one frequency tone was presented in each trial. Each of the six different frequency stimuli was played 24 times per task-based functional run. Furthermore, each task-based functional run also contained 36 quiet baseline stimuli. To avoid an “expectation effect” in the task-based experiment, the six different tone stimuli and quiet baseline stimuli were presented in an alternating pseudo random pattern. The intensity of all stimuli was 75 dB, but due to differences between individuals, participants could adjust the loudness of the tone bursts between 70 and 80 dB.
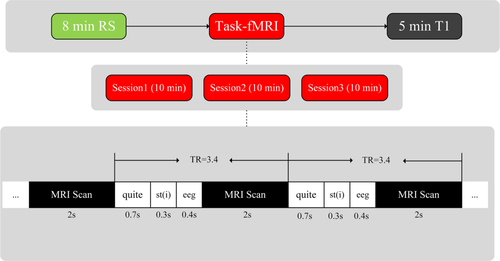
Stimuli presentation and MRI sampling. Three types of data were collected, including resting fMRI data, task-based fMRI data, and T1 image data. Task-based fMRI images were acquired every 3.4 s. Each trial included four parts: baseline = 700 ms, stimulus = 300 ms, EEG collection = 400 ms, and MRI scanning = 2,000 ms [Color figure can be viewed at wileyonlinelibrary.com]
2.3 Procedure
For each subject, three types of MRI data were acquired on the same day: resting-state fMRI, task-based fMRI, and T1 image data. To eliminate any possible influence of task execution, resting data were collected prior to task-based data collection, which was then followed by high-resolution T1-image data collection (Figure 1). To improve the statistical effectiveness of each single subject, multiple task-based fMRI runs were used to increase the total number of trials. During the auditory task, participants were only asked to stay awake and passively listen to the stimuli (Cha et al., 2016; Hu et al., 2017). The stimulus sequence was played via MR-compatible high-fidelity headphones (Optoacoustics) that used an adaptive DSP-based noise-reduction filtering algorithm.
All images were collected on a 3.0-T Siemens (Erlangen, Germany) scanner. The resting-state data were collected using an echo-planar imaging (EPI) sequence (FOV = 220 × 220 mm, acquisition matrix = 64 × 64 mm, pixel spacing = 3.4375 × 3.4375 mm, slice thickness = 3.0 mm, TR = 2000 ms, TE = 30 ms, flip angle = 90°). The task-based functional images were sampled using a 10-min EPI sequence (FOV = 220 × 220 mm, acquisition matrix = 64 × 64 mm, pixel spacing = 3.4375 × 3.4375 mm, slice thickness = 3.0 mm, TR = 3400 ms, TE = 26 ms, flip angle = 90°). High spatial resolution 3D-T1 anatomical data were gathered using a magnetization-prepared rapid gradient-echo (MPRAGE) sequence (FOV = 246 × 256 mm, acquisition matrix = 246 × 256, pixel spacing = 1 × 1 mm, slice thickness = 1 mm, TR = 1900 mm, TE = 2.52 mm, flip angle = 90°).
2.4 Task-based fMRI data analysis
All task-based fMRI data were preprocessed using SPM8 (http://www.fil.ion.ucl.ac.uk/spm/software/spm8/). As the magnetic field of the scanner may be unstable during the initialization phase, the first ten volumes for each subject were discarded (Dresler et al., 2017; Yao et al., 2016). Therefore, only the remaining 170 volumes were used for the subsequent analysis. The preprocessing of task-based fMRI data included the following steps: slice timing (interlayer time correction), realignment (head motion correction), co-registration (T1 images were co-registered to the mean functional image), segmentation (T1 images were divided into gray matter, white matter, and cerebrospinal fluid), normalization (functional and structural imaging data were spatially normalized to the Montreal Neurological Institute (MNI) EPI template using DARTEL; Ashburner, 2007), and spatial smoothing (using a 3D Gaussian kernel, full maximum at half width (FWHM) = 6 mm). Due to head movement issues (translational (mm) > 2.0 or rotation (°) > 2), six task-based image datasets were discarded after preprocessing.
A general linear model (GLM) was applied to each voxel time series, and each frequency condition was modelled with a separate regressor constructed by convolving a boxcar function with a hemodynamic response function provided by SPM8. Six motion parameters were included in the model as nuisance regressor. One sample t tests of beta maps were used to examine brain activation levels under each frequency condition at the group level (p < .001, cluster size = 10, uncorrected). BrainNet Viewer (http://www.nitrc.org/projects/bnv) (Xia, 2011) was used to map these activation maps to the same surface map (Fig. 2). Points on the surface map that showed significant differences across frequencies (i.e., tonotopy) were labeled by assigning the frequency x as the value of each given voxel if its beta value of frequency x was the highest value. This method was similar to the method performed by Humphries et al., 2010. The Brainnetome Atlas (Fan et al., 2016) was used to fractionize the tonotopic areas in the HAC (Supporting Information, Figure S1 and Table S1).
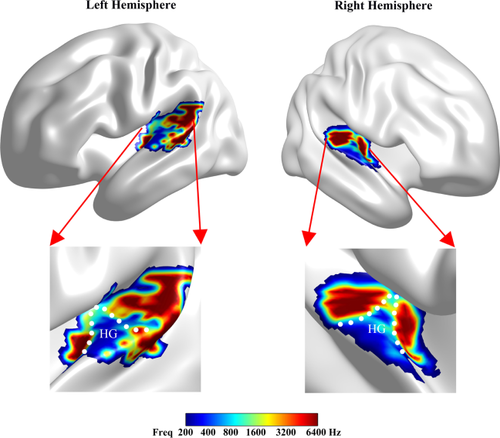
Tonotopic organization of the HAC. Heschl's gyrus is roughly surrounded by the white dotted line. Colored regions in the bilateral hemispheres show voxels of significantly different frequencies, and the color of each voxel represents the frequency that showed the highest activation response of the six frequency tone stimuli [Color figure can be viewed at wileyonlinelibrary.com]
2.5 ROIs definition
The WFU PickAtlas (http://www.nitrc.org/projects/wfu_pickatlas/) was used to produce ROIs. Each seed region is a sphere with a 5 mm radius, and the center of each sphere is the peak point of each activation area. Multiple comparisons (pFDR<0.05, cluster = 10) were performed to select the peak points of each activation area used to generate seed regions (Supporting Information, Table S2). Finally, the WFU PickAtlas was used to combine the peak-point coordinates of each frequency into a ROI. Six ROIs were defined based on the responses of the 50 participants to the six pure tone frequencies, then these ROIs were divided into three categories, that is, a high-frequency (3200 and 6400 Hz), intermediate-frequency (800 and 1600 Hz), and low-frequency (200 and 400 Hz) ROI (Humphries et al., 2010) (Supporting Information, Figure S2).
2.6 Resting-state fMRI analysis
All resting-state fMRI data were preprocessed using SPM8 and analyzed using the Resting-State fMRI Data Analysis Toolkit (REST) (http://www.restfmri.net/forum/REST_V1.8). Similar to the preprocessing of task-based fMRI data, the first ten volumes of each subject were discarded, and subsequent preprocessing also consisted of slice timing, realignment, co-registration, segmentation, normalization, and spatial smoothing (3D Gaussian kernel, FWHM = 6 mm). Additionally, nuisance covariate regressions (including head motion, average time course of cerebral spinal fluid and white matter regions) were also included in preprocessing.
After preprocessing, the voxel-by-voxel RS-FC of the three ROIs (i.e., high-, intermediate-, and low-frequency ROIs) were computed as the temporal correlation of each voxel time series. The correlation coefficient maps of each subject were used in the second level statistical analyses. One sample t tests were used to determine the functional connectivity patterns associated with each frequency seed region. Then, family-wise error (FWE) cluster corrections were performed for multiple comparisons procedures (FWE p < .05, cluster size = 10). To create a more intuitive view of the connection patterns, the RS-FC patterns of the three different ROI groups were mapped onto surface maps (Figure 3).
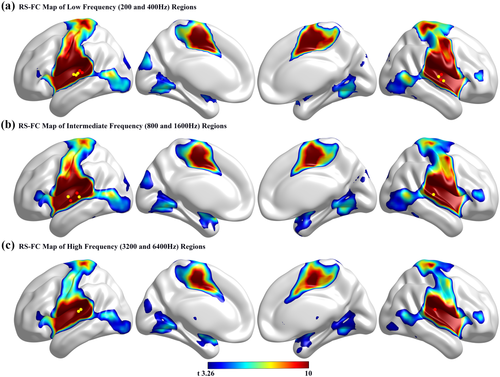
RS-FC maps of the three ROIs. Colored areas in the RS-FC maps of each ROI are voxels that have significant RS-FC with the specific ROI in the HAC. The yellow and red dots represent the seed areas of the different frequencies in the same frequency band: yellow dots represent the seed region of the lower frequency, and red dots represent the seed region of the higher frequency [Color figure can be viewed at wileyonlinelibrary.com]
To determine whether there were significant differences in the RS-FC of the three ROIs, a repeated-measures one-way ANOVA (high, intermediate, and low frequencies) was performed on the correlation coefficient maps of each subject across the three ROIs. Then, an FWE cluster correction was performed for multiple comparisons (FWE p < .05, cluster size = 10). The brain regions that showed significant differences in RS-FC among the three ROIs were projected onto the cortical surface (Figure 4a).
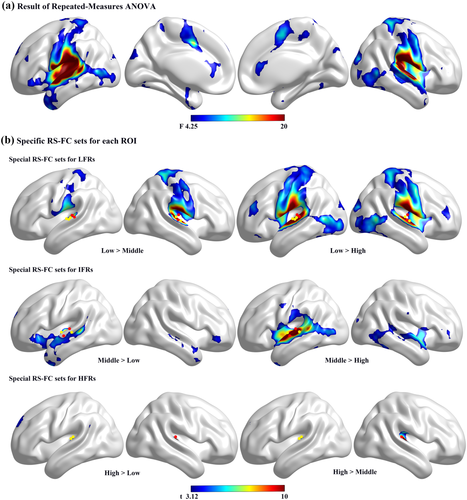
(a) Results of repeated-measures ANOVA. Colored areas are voxels that showed a significant difference in RS-FC between the three frequency groups (p < .001, cluster size = 10, uncorrected). (b) Specific RS-FC sets for each ROI. Colored areas indicate stronger RS-FC between the specific area and the ROI of the specific frequency band (FWE p < .05, cluster size = 10). The yellow dots and red dots represent the seed areas of the different frequencies in the same frequency band: yellow dots represent the seed region of the lower frequency, and red dots represent the seed region of the higher frequency [Color figure can be viewed at wileyonlinelibrary.com]
3 RESULTS
3.1 Tonotopic organization of the HAC
The results of the task-based fMRI analysis demonstrated that the tonotopic organization of the HAC had a high-to-low-to-high pattern (Figure 2). The distribution of the low-frequency regions (LFRs) extended approximately along the axis of Heschl's gyrus (HG). Although it was difficult to determine a precise location, Figure 2 shows that the LFRs were roughly located in the lateral half of HG. Two approximately symmetrical high-frequency regions (HFRs) were distributed on both sides of the LFRs, posteromedially and anteromedially to the LFRs. The intermediate-frequency regions (IFRs) were located between the LFRs and the HFRs. Furthermore, an additional prominent HFR that extended along the posterior–anterior axis of the superior temporal gyrus (STG) was observed in left hemisphere but not in the right hemisphere.
3.2 RS-FC map of the HAC
We chose three ROI groups (i.e., high-, intermediate-, and low-frequency ROIs) and used them as seeds to determine the RS-FC between the HAC and other brain regions (Fig. 3). Voxels were recognized as having a functional interaction with certain ROIs only when the correlation coefficient between them was statistically significant (FWE p < .05, cluster size = 10). Figure 3 shows that there were considerable overlaps among the RS-FC maps of the three frequency ROIs when we did not consider the weight of the connection. By combining these maps, we found that the brain regions that had RS-FC with the HAC mainly included the STG, dorsolateral prefrontal cortex (DL-PFC), inferior frontal cortex (IFC), parietal cortex, ventrolateral occipital lobe, and subcortical structures (Supporting Information, Table S3).
3.3 Frequency-selective RS-FC between the HAC and other brain regions
The results of the repeated-measures ANOVA showed a significant main effect of frequency (F = 4.2528, p < .001, Figure 4a). By comparing Figures 3 and 4a, we found that differences in RS-FC existed in most of the brain regions that had RS-FC with the HAC. Follow-up post hoc tests (paired t tests, FWE p < .05, cluster size = 10) were used to investigate the statistical significance of these differences; six contrasts were applied to compare the RS-FC pattern differences between each frequency group against the other two groups. The results of the post hoc tests were overlaid onto surface maps (Figure 4b).
By comparing Figures 3 and 4b, we found that although different frequency regions in the HAC shared part or almost all of their RS-FC, each frequency region in the HAC had a specific RS-FC set when we considered the weight of the RS-FC (Supporting Information, Table S4). Figure 4b shows that there was stronger RS-FC between LFRs and brain regions including the medial premotor cortex (PMC), somatosensory association cortex (SAC), dorsal insula, SSC, and DL-PFC. Figure 4b also shows that there was stronger RS-FC between IFRs and brain regions that included the STG, the middle temporal gyrus (anterior/posterior superior temporal sulcus (STS), supramarginal gyrus, and IFC. Figure 4b also demonstrates that there was stronger RS-FC between IFRs/LFRs and vision-related regions that included V1, V5/MT, the inferior temporal gyrus (ITG), ventral occipital cortex, and anterior calcarine sulcus. Furthermore, follow-up post hoc tests showed that there was stronger RS-FC between HFRs and brain regions that included the anterior cingulate cortex (ACC) and left DL-PFC (Figure 4b).
The results of ANOVA showed that there were significant differences in the RS-FC of most of the brain regions that had RS-FC with the HAC (Figures 3 and 4a). Furthermore, the results of the post hoc tests showed that each frequency region in the HAC had a specific (i.e., stronger) RS-FC set when we considered the relative weight of the RS-FC (Figure 4b). These data demonstrate that the RS-FC between the HAC and other brain regions is differentiated by frequency. In other words, the RS-FC between the HAC and other brain regions is frequency-selective.
To create a more intuitive observation of the frequency-selective RS-FC between the HAC and other brain regions, average correlation coefficients between specific brain regions and each ROI were calculated. Figure 5a shows the correlation coefficients between the LFRs and the medial PMC, SAC, SSC, posterodorsal insula, DL-PFC, and inferior occipital gyrus were strong. A similar phenomenon was observed between the IFRs and other brain regions such as the rostroventral ITG, lateroventral fusiform gyrus (FuG), and anterior STS (Figure 5b). However, Figure 5c shows that the correlation coefficient between the HFRs and the ACC was slightly higher than that of other seed regions. These findings additionally demonstrated that the RS-FC between the HAC and other brain regions is frequency-selective.
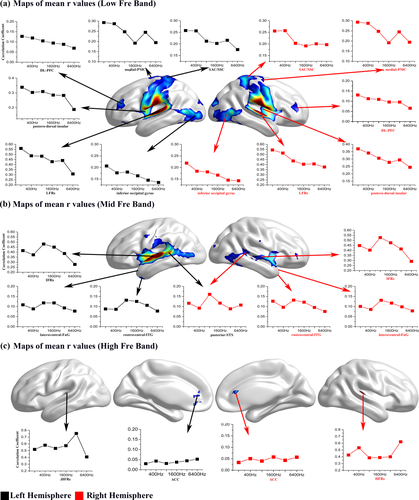
Maps of average correlation coefficients between specific brain areas and each of six seed regions. The x-axis represents the six frequency conditions, and the y-axis represents the average correlation coefficient. Each curve in the graph represents a specific brain region, and each point in the curve represents an average correlation coefficient between the specific area and the seed region of a certain frequency condition. Black squares indicate the specific area was located in the left hemisphere, and red squares indicate the specific area was located in the right hemisphere [Color figure can be viewed at wileyonlinelibrary.com]
4 DISCUSSION
4.1 Frequency-selective RS-FC between the HAC and other brain areas
Many studies have demonstrated that RS-FC within the early sensory cortices has topological specificity. Specifically, a recent study demonstrated that RS-FC within the HAC is frequency-selective. However, our study identified for the first time that RS-FC between the HAC and other brain areas is differentiated by frequency. Moreover, further analysis showed that each frequency region (i.e., HFRs, IFRs, and LFRs) had a unique RS-FC set when we considered the weight of the FC. This finding is consistent with previous biocytin-based studies in the Mongolian gerbil auditory cortex, which showed that each auditory region had a unique set of cortical connections when considering the weight of the connections (Budinger et al., 2000). Because the unique RS-FC sets of the different frequency-selective subregions connect to different functional brain areas, these findings suggest that the frequency-selective RS-FC between the HAC and other brain regions may be closely related to functional differences in FSCRs. In other words, the frequency-selective RS-FC between the HAC and other brain regions may be linked to the functional differentiation of the early auditory cortex.
There was stronger RS-FC between the LFRs in the HAC and brain regions that included the medial PMC, DL-PFC, SAC, SSC, posterodorsal insula, and vision-related regions (first row of Figure 4b). Previous studies have demonstrated that neurons in the PMC directly project to the spinal cord and may play a role in the direct control of movement (Gerloff et al., 1997; Halsband, 1994; Roland et al., 1980). Furthermore, the DL-PFC is the highest cortical area involved in motor planning, organization and regulation (Curtis & Esposito, 2003; Miller & Cohen, 2001). In addition, Mesulam & Mufson, 1982 demonstrated that the posterodorsal insula is related more to auditory–somesthetic–skeletomotor function. In Felleman & Vanessen, 1991, the authors demonstrated that there were extensive connections between visual cortical areas and the SSC. In addition, subsequent studies also verified that sensory cortices and sensory-associated cortices may involve visual motor integration (Felleman et al., 1991; Picard & Strick, 2001; Taira et al., 1990). As these specific regions are either directly involved in the motor system or assist in movement completion, we speculate that the literature is converging towards the possibility that the low-frequency area may play a role in motor systems (Baumann et al., 2007; Chen et al., 2008; Palomar-García et al., 2017).
Many biological studies have found that the roar frequency of many beasts of prey belongs to a low-frequency band, such as the roars of tigers and lions (Baumjohann et al., 1999; Riede et al., 2011; Weissengruber et al., 2002). Furthermore, the sound of other objects that may directly threaten human life, for example, thunder and rattlesnakes (Few et al., 1967; Rome et al., 1996), also belong to a low-frequency band. Campeau & Davis, 1992 demonstrated that it was easier for low-frequency sounds to elicit auditory fear. Whether we can escape from natural threats directly determines whether we can survive, that is, the instinctive response to fear has evolved into a basic ability to protect an individual from predators (Motta et al., 2009). Therefore, we propose that the stronger connections between the LFRs and the PMC, DL-PFC, SAC, and lateral occipital gyrus may be a part of the neural basis for this instinctive protective mechanism, that is, the LFRs may play a role in instinctive protective mechanisms.
There was stronger RS-FC between the IFRs in the HAC and brain regions that included the STG, middle temporal gyrus (anterior/posterior STS), supramarginal gyrus, and IFC (second row of Figure 4b). Previous studies have demonstrated that the ventral stream of the temporo-frontal network—primarily including the anterior STS, posterior STS, and IFC—plays an important role in speech comprehension (Yue et al., 2013). In addition, we know that the supramarginal gyrus, also called Wernicke's speech area, plays an important role in speech comprehension (Just et al., 1996). Convergent data from these studies suggest that the IFRs may play a role in speech comprehension. Rodman, 2003 demonstrated that the bandwidth of the speech signal is one of the most important elements affecting the intelligibility of speech, especially the frequency band of 300∼3300 Hz (i.e., the “telephone speech bandwidth”). Although there are some overlaps between the telephone speech bandwidth and the high-/low-frequency segments, the intermediate-frequency category is the main component of the telephone speech bandwidth. Therefore, the stronger connection between the IFRs and brain regions in the ventral auditory pathway may be due to IFRs playing an important role in speech comprehension.
Furthermore, Figure 4b shows that there was stronger RS-FC between the IFRs/LFRs in the HAC and brain regions that included the V1, V5/MT, ITG, ventral occipital cortex, and anterior calcarine sulcus. Many studies have demonstrated that there are audio–visual interactions (Beer et al., 2011; Eckert et al., 2008; Greenlee et al., 2012; Ogawa & Macaluso, 2013). The stronger RS-FC between the IFRs/LFRs (approximately the HG area) and the visual regions is consistent with previous tracer studies that have demonstrated that the visual cortex, particularly the ventral occipital cortex and the anterior calcarine sulcus, primarily connects to HG rather than planum temporale (PT) (Beer et al., 2011). Therefore, the stronger RS-FC between the IFRs/LFRs and vision-related regions may be due to audio–visual interactions primarily occurring between the IFRs/LFRs in the HAC and vision-related regions. That is, the IFRs/LFRs may play an important role in audio–visual interactions.
There was stronger RS-FC between the HFRs in the HAC and brain regions including the ACC and left DL-PFC (third row of Figure 4b). Many animal studies have demonstrated direct cortical connections from different auditory regions to the CG and DL-PFC (Budinger et al., 2000; Olson & Musil, 1992; Vaudano et al., 1991). Furthermore, Budinger et al. 2000 demonstrated that several neurons in the ACC respond to acoustic stimuli. Importantly, many studies have demonstrated that the ACC and left DL-PFC play an important role in cognitive control (Cocchi et al., 2013; Engel et al., 2001; MacDonald et al., 2000). Therefore, the stronger RS-FC between the ACC, left DL-PFC, and the HFRs in the HAC may be due to HFRs playing an important role in higher auditory brain functions such as cognitive control.
4.2 Tonotopic organization in the HAC and considerable overlaps in the RS-FC of the three ROIs
In this study, in addition to determining that the RS-FC between the HAC and other brain regions is frequency-selective, we also have other findings. For instance, the task-activation findings replicated previous findings showing that the tonotopic organization of the HAC has a high-to-low-to-high pattern across HG (Ahveninen et al., 2016; Da Costa et al., 2011; Humphries et al., 2010; Moerel, 2017). The additional prominent HFRs extending from the posterior STG to the anterior STG is also consistent with previous studies (Humphries et al., 2010). Furthermore, our findings also showed that there was considerable overlap in the RS-FC of the three ROIs in the HAC, and the brain areas that had RS-FC with the HAC mainly included the STG, PFC, parietal cortex, ventrolateral occipital lobe, and subcortical structures. By comparing these regions within the RS-FC map of the HAC to functional pathways found in previous studies (Rauschecker & Scott, 2009; Zatorre & Salimpoor, 2013), we found that the RS-FC map of the HAC indeed included the anteroventral and posterodorsal auditory information processing functional pathway (Rauschecker & Scott, 2009; Wessinger et al., 2001; Zatorre & Salimpoor, 2013).
These findings are consist with the understanding that the HAC is organized in a hierarchical pattern; the tonotopic regions in the HAC are responsible for separate pure tone processing, and the nontonotopic regions in the HAC are responsible for combining separate pure tones into patterns and communicating with other brain regions (Budinger et al., 2000; Kaas et al., 1999; Rauschecker & Scott, 2009). In this study, we cannot directly prove that the considerable overlaps in RS-FC among the three ROIs in the HAC are due to the hierarchical nature of auditory information processing. However, if the processing of auditory information is not carried out in this manner, there should only be differences in RS-FC (as in Figure 4b) among the three ROIs instead of both overlaps and differences.
There are several limitations in this article that merit consideration, chief among them being that the potential functions of each tonotopic region are derived from simple comparative inferences based on previous studies. Whether each tonotopic region exhibits the above functions remains to be verified by further experimental verification. Second, an individual differences analysis might provide new and interesting findings, but we did not perform such an analysis in the present study. Because the primary concern in this article was whether there were significant differences in RS-FC among different frequency regions in the HAC on a group level. However, an individual differences analysis is a valuable topic worthy of further analysis. Third, previous studies have demonstrated that neurons in the HAC respond differently to different frequencies (Humphries et al., 2010) and that the RS-FC in the HAC is frequency-selective (Cha et al., 2016). Our study demonstrated that the RS-FC between the HAC and other brain regions was also frequency-selective. Therefore, we cannot resolve the question of whether brain regions that have RS-FC with the HAC might also be frequency-selective. This interesting question is worth exploring in future experiments.
5 CONCLUSION
In this study, we demonstrated that the RS-FC between the HAC and other brain region is frequency-selective. We demonstrated the following findings: (a) IFRs in the HAC selectively connect to sensorimotor-related brain regions including the medial PMC, DL-PFC, SAC, SSC, and posterodorsal insula; (b) IFRs in the HAC selectively connect to speech-comprehension-related regions, for instance, the STG, anterior/posterior STS, supramarginal gyrus, and IFC; (c) IFRs/LFRs in the HAC selectively connect to vision-related regions that include V1, V5/MT, the ITG, the ventral occipital cortex, and the anterior calcarine sulcus; and (d) HFRs in the HAC selectively connect to the ACC and left DL-PFC. Because different frequency-selective subregions in the HAC selectively connect to different functional brain regions, these findings suggest that frequency-selective RS-FC between the HAC and other brain regions may reflect the functional differentiation of the early auditory cortex in the HAC. Furthermore, the findings on the tonotopic organization in the HAC and those on the considerable overlaps in RS-FC among different frequency ROIs appear consistent with the view that the HAC is organized in a hierarchical manner. There is no contradiction between the findings on the hierarchical organization of the HAC and those on the frequency selectivity of the RS-FC; on the contrary, these data suggest that FSCRs not only are responsible for the processing of separate pure tones but also play an important role in higher order cognitive processing. These findings may help guide the further exploration of the role of different tonotopic subregions in higher order cognitive processing rather than simply thinking that the tonotopic regions are only responsible for separate pure tone encoding.
ACKNOWLEDGMENTS
This work was supported in part by the National Natural Science Foundation of China (Grant No. 61472330) and in part by the Fundamental Research Funds for the Central Universities under Grant XDJK2016E026.


