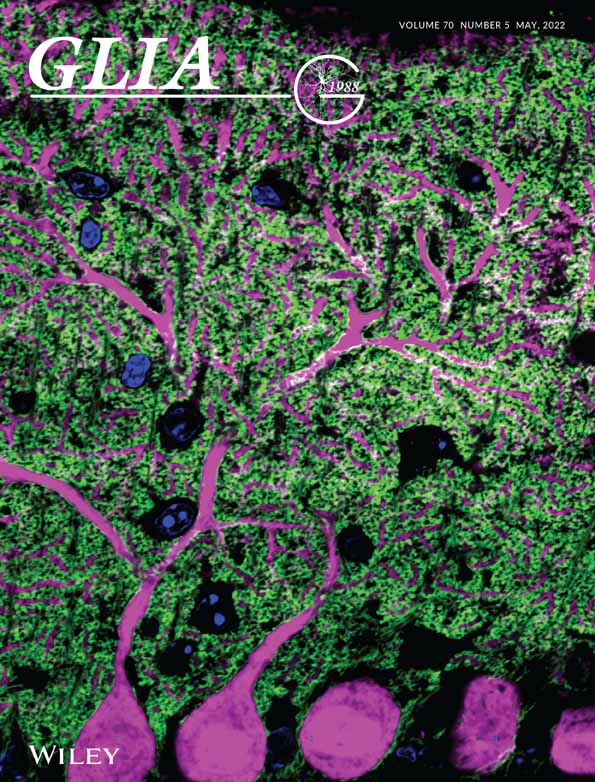
Longitudinal intravital imaging of cerebral microinfarction reveals a dynamic astrocyte reaction leading to glial scar formation
Funding information: National Research Foundation of Korea, Grant/Award Numbers: 2020R1A2C3005694, 2016M3C7A1913844
Abstract
Cerebral microinfarct increases the risk of dementia. But how microscopic cerebrovascular disruption affects the brain tissue in cellular-level are mostly unknown. Herein, with a longitudinal intravital imaging, we serially visualized in vivo dynamic cellular-level changes in astrocyte, pericyte and neuron as well as microvascular integrity after the induction of cerebral microinfarction for 1 month in mice. At day 2–3, it revealed a localized edema with acute astrocyte loss, neuronal death, impaired pericyte-vessel coverage and extravascular leakage of 3 kDa dextran (but not 2 MDa dextran) indicating microinfarction-related blood–brain barrier (BBB) dysfunction for small molecules. At day 5, the local edema disappeared with the partial restoration of microcirculation and recovery of pericyte-vessel coverage and BBB integrity. But brain tissue continued to shrink with persisted loss of astrocyte and neuron in microinfarct until 30 days, resulting in a collagen-rich fibrous scar surrounding the microinfarct. Notably, reactive astrocytes expressing glial fibrillary acidic protein (GFAP) appeared at the peri-infarct area early at day 2 and thereafter accumulated in the peri-infarct until 30 days, inducing glial scar formation in cerebral cortex. Our longitudinal intravital imaging of serial microscopic neurovascular pathophysiology in cerebral microinfarction newly revealed that astrocytes are critically susceptible to the acute microinfarction and their reactive response leads to the fibrous glial scar formation.
1 INTRODUCTION
Cerebral microinfarcts, small ischemic lesions, can be caused by cerebral small vessel disease, microemboli, and hypoperfusion (van Veluw et al., 2017). Prevalent microinfarcts contribute to the disruption of structural brain connection, which can progress to a cognitive impairment and dementia that is independent of Alzheimer's disease (AD) pathology (Smith et al., 2012; van Veluw et al., 2017). A systemic review reported that the cerebral microinfarct prevalence was 62% in vascular dementia patient, 43% in AD patient, and 24% in healthy aged individuals (Brundel et al., 2012). With a growing body of evidence of an association between cerebral microinfarcts and dementia, there are increasing studies to improve the understanding of the microinfarct as a risk factor and its functional impact (Freeze et al., 2019; Okamoto et al., 2012; Shih et al., 2018). It has been shown that cerebrovascular dysfunction could cause spontaneous thrombotic cerebral microinfarcts, followed by cerebral amyloid angiopathy (CAA), blood–brain barrier (BBB) breakdown, and cognitive impairment (Shih et al., 2013; Tan et al., 2015). However, little is known about the mechanistic link between microscopic cerebrovascular disruption and brain damage. Furthermore, dynamic in vivo cellular-level changes in glial, vascular and neuronal cells after the onset of cerebral microinfarction have been mostly unknown partly due to technical difficulties in the longitudinal high-resolution in situ observation of their complex behaviors and fates serially in a live animal models in vivo over long period of time.
In this study, we have achieved a longitudinal cellular level intravital imaging of a cerebral microinfarction mouse model to visualize highly dynamic behaviors of astrocytes and pericytes and changes in vascular obstruction and leakage for 1 month. The intravital imaging of the microinfarction lesion revealed an acute tissue expansion, localized edema, at day 2 followed by gradual tissue shrinkage for 1 month, resulting in a cerebral atrophy with a neuronal loss and collagen-rich scar formation surrounding the microinfarct. An acute astrocyte loss and neuronal death observed after the microinfarct induction was persisted until 1 month whereas acute impairment of pericyte-vessel coverage, microvascular flow and vascular leakage of 3 kDa dextran (but not 2 MDa dextran) were partially recovered at day 5. Meanwhile, glial fibrillary acidic protein (GFAP)-expressing reactive astrocytes were highly accumulated at the peri-infarct area for 1 month after the microinfarct induction. Thus, we further investigated the role of GFAP+ reactive astrocytes as a driver of fibrous scar formation associated with the cerebral microinfarct. GFAP+ reactive astrocytes started to be observed at the peri-infarct area from 2 days after the microinfarct induction and appeared to be accumulated with glial scar formation until 1 month. Additionally, GFAP+ astrocytes co-expressing lipocalin2 (LCN2), severe reactive astrocytes, were observed at the peri-infarct area with glial scar formation in the infarct.
2 METHODS
2.1 Mice
All mice experiments were performed in accordance with the standard guidelines for the care and use of laboratory animals and were approved by the Institutional Animal Care and Use Committee (IACUC) of KAIST (approval no. KA2018-66). Mice used in this study were maintained in a specific pathogen-free facility of KAIST Laboratory Animal Resource Center. All mice were individually housed in ventilated and temperature & humidity-controlled cages (22.5°C, 52.5%) under 12–12 h light–dark cycle and provided with standard diet and water ad libitum. For experimental use, 8–12 weeks old male mice (20 ~ 30 g) were utilized in this study. C57BL/6 mice purchased from OrientBio (Korea) were used in this study. NG2-DsRed mice (Stock No. 008241, Jackson Laboratory) where DsRed is expressed in pericytes, oligodendrocyte precursor cells (OPCs) and vascular smooth muscle cells (vSMCs) were purchased from the Jackson Laboratory. Aldh1l1-GFP mice expressing Green Fluorescence Protein (GFP) in most of astrocytes were generously provided by Dr. W. Chung (Korea Advanced Institute of Science and Technology, Korea). Aldh1l1-GFP x NG2-DsRed double transgenic mouse was produced by crossbreeding NG2-DsRed mouse and Aldh1l1-GFP mouse. NG2-DsRed x Kaede double transgenic mouse was generated by crossbreeding NG2-DsRed mouse and Kaede mouse (generously provided by Dr. Tomura and Dr. Miwa at Kyoto University, Japan), which universally express a photo-convertible fluorescent protein ‘Kaede’ (Tomura et al., 2008), and we performed the photoconversion at day 2 by 405 nm laser illumination after the microinfarct induction to identify the presence of intermediate non-flowing vessel. NG2-DsRed x H2B-GFP double transgenic mouse was generated by crossbreeding NG2-DsRed mouse and H2B-GFP mouse (Stock No. 006069, Jackson Laboratory), which express GFP with a histone H2B gene. Finally, Aldh1l1-GFP x NG2-DsRed x APP/PS1 mouse was generated by crossbreeding NG2-DsRed, Aldh1l1-GFP mouse and APP/PS1 (MMRRC Stock No. 34832, Jackson Laboratory), which express a chimeric mouse/human amyloid precursor protein and a mutant human presenilin 1 associated with early-onset AD.
2.2 Imaging system
Custom-built video-rate laser-scanning confocal and two-photon microscope system previously implemented (Ahn et al., 2019; Ahn et al., 2017; Choe et al., 2013; Lee et al., 2020; Park et al., 2018; Park et al., 2019; Seo et al., 2015) was used. Four continuous-wave laser modules with output wavelengths at 405 nm (OBIS 405, Coherent), 488 nm (MLD488, Cobolt), 561 nm (Jive, Cobolt) and 640 nm (MLD640, Cobolt) were used as an excitation sources for confocal microscope. A femtosecond pulse Ti:Sapphire laser (690–1050 nm, Chameleon Vision-S, Coherent) was used as a two-photon excitation source. A video-rate two-dimensional Raster-pattern laser-scanning was achieved by using a rotating polygonal mirror (MC-5, Lincoln Laser) for fast X-axis scanning and a galvanometer scanner (6230H, Cambridge Technology) for slow Y-axis scanning. Multi-color confocal fluorescence signals were detected by four photomultiplier tubes (PMT; R9110, Hamamatsu) through bandpass filters (FF01-442/46, FF02-525/50, FF01-600/37, FF01-685/40, Semrock). Multi-color two-photon fluorescence signals and second harmonics generation (SHG) signals were detected by four photomultiplier tubes (PMT; R11540, Hamamatsu) through bandpass filters (FF01-445/20, FF01-525/45, FF01-593/46, FF02-675/67, Semrock). Output signal of PMTs were digitally acquired by using a frame grabber (Solios, Matrox) and a custom-written image acquisition software based on the Matrox Imaging Library (MIL10, Matrox) for a real-time image acquisition, display and recording.
2.3 Cranial imaging window preparation
Chronic cranial imaging window implantation (Holtmaat et al., 2009; Lee et al., 2020) were used for intravital imaging of cerebral microinfarction in mice brain in vivo. Briefly, cranial bone of mouse anesthetized by intraperitoneal injection of Zoletile (20 mg/kg) and Xylazine (10 mg/kg) mixture was exposed by skin incision and then the removal of connective tissue covering the cranial bone. Brain tissue of somatosensory cortex or posterior parietal association area was exposed by making a circular-shaped hole in the middle of parietal bone (typically 3 mm in diameter) with the dental drill (Strong 207A, Saeshin) under stereoscopic microscope. A 3 mm cover glass (64-0726, Warner Instruments) covered the exposed brain by using a fast-curing adhesive (Loctite 401. Henkel). To protect both of the incision area and the exposed cranial bone, the area except the cover glass was covered by using dental acrylic resin (1234, Lang Dental). After the imaging window implantation, mice were housed in cages for 3–4 weeks to allow a full recovery from the surgery before intravital imaging experiment. Mice showing normal brain vasculature with no sign of inflammation were selected and used for the intravital imaging and disease modeling.
2.4 Intravital imaging of microinfarct
Mice were anesthetized by intraperitoneal injection of Zoletile (20 mg/kg) and Xylazine (10 mg/kg) mixture and mounted on a stereotaxic plate (US-R-10, Live Cell Instrument) with heating function to maintain the body temperature at 36.5°C during intravital imaging. A cerebral microinfarction was induced for 3–5 s by 561 nm laser illumination with 60× objective lens (LUMFLN60XW, NA 1.1, Olympus) after intravenous injection of 100 μl Rose Bengal (15 mg/ml; 330,000, Sigma Aldrich) (Shih et al., 2013). Sham control group received similar dose of laser illumination after intravenous injection of 100 μl saline. Intravital imaging of ROS and cell death was performed at day 0 and 1 after injecting 250 μg of dihydroethidium (DHE, D11347, Invitrogen) and 75 μg of propidium iodide (PI, P4170, Sigma), respectively. Longitudinal imaging of Aldh1l1-GFP x NG2-DsRed mouse was performed for 30 days after injecting 30 μg of Alexa Flour 647-anti-CD31 antibody. Longitudinal imaging of NG2-DsRed x Kaede mouse was performed for 5 days after the injecting 400 μg of Alexa Flour 647-dextran (D22914, Thermo). Longitudinal imaging of vascular leakage in C57BL/6 mouse was performed for 5 days after injecting 600 μg of 3 kDa TRITC-dextran (LIF-D-3308, Invitrogen) and 600 μg of 2 MDa FITC-dextran (LIF-D-7137, Invitrogen). Time-lapse imaging of Aldh1l1-GFP mouse at day 1–1.5 was performed for 12 h after injecting 30 μg of Alexa Flour 647-anti-CD31 antibody. Time-lapse imaging of NG2-DsRed x H2B-GFP mouse at day 3.5–4.5 was performed for 24 h after injecting 30 μg of Alexa Flour 647-anti-CD31 antibody. Aldh1l1-GFP x NG2-DsRed x APP/PS1 mouse was imaged at 5.5 and 6.5 month-old mouse after injecting 600 μg of 3 kDa TRITC-dextran (LIF-D-3308, Invitrogen), and 250 μg of Methoxy-X04 (4920, Tocris) for staining amyloid plaque.
2.5 Immunofluorescence staining
Harvested brains were fixed with 4% paraformaldehyde (wt/vol, BPP-9016, Tech & Innovation) overnight at 4°C and then sliced with Leica VT1200 vibrating microtome. Brain sections, 50 μm thick, were permeabilized at 37°C for 3 h in 0.2% Triton X-100 (Sigma, T8787, Sigma) in phosphate-buffered saline (PBS, LB004, Welgene) and blocked overnight at 4°C in 0.5% bovine serum albumin (BSA, A9418, Sigma) in permeabilization buffer. The sections were incubated for 3 days with primary antibodies in blocking buffer. Primary antibodies were diluted: NeuN (1:200, LIF-711054, Thermo), MAP 2 (1:250, PA1-10005, Thermo), GLT-1 (1:100, AB1783, Merk), GFAP (1:200, AB5541, Merk) and LCN2 (1:200, AB2267, Merk). The sections were then washed for 1 day with permeabilization buffer and incubated for 1 day with secondary antibodies (all 1:1000 dilution) in blocking buffer: goat anti-rabbit Alexa 555 (A21428, Thermo), goat anti-guinea pig Alexa 647 (A21450, Thermo), goat anti-chicken Alexa 555 (A21437, Thermo), goat anti-rabbit Alexa 647 (A21244, Thermo) and goat anti-chicken Alexa 647 (A32933, Thermo). After incubation, the sections were additionally stained by DAPI (D9542, Sigma) for 1 h in PBS, and then mounted on slides. Images were obtained by custom-built confocal microscope system.
2.6 Brain tissue clearing method
Cubic-L was prepared in deionized (DI) water with 10% (wt/vol) N-butyldiethanolamine (B0725, TCI) and 10% (wt/vol) Triton X-100 (T0818, Samchun). For tissue clearing, brain tissues were immersed and gently shaken in 5 ml Cubic-L solution in 37°C incubator for 1–2 days, exchanging the Cubic-L solution once every 24 h. Once the white matters of the brain samples have been cleared, to minimize tissue damage, the tissue samples were immediately removed from the tissue clearing solution and washed in 5 ml of 0.1% (wt/vol) Triton X-100 in PBS (PBST) overnight. For samples that needed immunostaining, tissues were incubated in 37°C shaker with primary antibody, NeuN, in PBST, washed in PBST, incubated with secondary antibody, goat anti-rabbit Alexa 555, in PBST and washed with PBST at 37°C. For optical clearing, dPROTOS (RI = 1.52) was prepared in DI water with 30% (vol/vol) 2,2’thiodiethanol (166,782, Sigma), 30% (vol/vol) dimethyl sulfoxide (67-68-5, Samchun), and 106% (wt/vol) iohexol (RY2006001, Royal Pharm). Tissue samples were immersed in 5 ml dPROTOS and incubated at 37°C for 1 day to assure homogenous RI matching.
2.7 Statistical imaging analysis
To analyze alteration of tissue area, we constructed vasculature map on the bases of venule and arteriole branching points and then quantified tissue area following the onset of cerebral microinfarction. To quantify area of collagen deposition, maximal intensity projection (MIP) SHG images were obtained from 150 μm of z-stack images, and then measured area by using Image J software. Cell number, NeuN+ nuclear size and average Aldh1l1+ astrocyte size were measured from single field of view (FOV) images by spot analysis and surface rendering of a commercial image processing software, IMARIS (Bitplane). Pericyte processes lengths were quantified by using manual spot analysis of IMARIS. GFAP, Aldh1l1 and LCN2-positive area and co-localization area were measured by mean intensity using Image J software. To analyze the reactivity of individual astrocytes, we performed Sholl analysis, provided by Image J, and used region of interests (ROIs) from single Aldh1l1+ astrocyte images. Sholl analysis automatically measured by 4 μm of radius step size and then we quantified average process lengths and intersects in individual astrocytes. Mean intensity of FITC and TRITC was measured by using histogram of Image J software. Flow dynamics in NG2-DsRed x Kaede mouse were manually measured by tracing same capillaries for 5 days using Image J software, and quantified the ratio of dynamics according to flow, blockage, reflow and regression. Vascular area and lacunarity from 10 μm of MIP images were quantified by AngioTool software (version 0.6a). For statistical analysis, all quantification data were statistically analyzed by unpaired two-tailed t-test or one-way ANOVA with Tukey's multiple comparison using Prism 5.0 (GraphPad), and statistical significance was set at p < .05.
3 RESULTS
3.1 Glial fibrous scar formation in cerebral microinfarct
A microinfarction in a penetrating arteriole identified by in vivo CD31 labeling of endothelial cells (EC) in cerebral cortex was induced by photothrombosis (PT) with 561 nm laser illumination after retro-orbital injection of Rose Bengal (Figure 1a). At 24 h after the induction, a greatly increased level of reactive oxygen species (ROS) and cell death in the cerebral cortical area nearby the PT induction site were revealed by in vivo labeling of dihydroethidium (DHE) and propidium iodide (PI), respectively (Figure 1b,c). At 30 days after the PT, the cerebral cortex with the microinfarct was harvested and optically cleared for 3D volumetric imaging analysis. Interestingly, a strong second harmonic generation (SHG) signal indicating a formation of fibrous collagen-rich glial scar (Esquibel et al., 2020; Perry et al., 2012) was detected by two-photon microscope (TPM) in the cerebral microinfarct as shown in 3D volume reconstructed images (Figure 1d). Cross-sectional Z-stack image sequence revealed accumulation of the collagen fiber at the periphery of the microinfarct (Figure S1). In addition, an almost complete loss of neuronal nuclei (NeuN) inside the microinfarct was confirmed with 3D volumetric imaging (Figure 1e and Video S1), indicating a focal neuronal loss associated with the microinfarct.

3.2 Focal atrophy with gradual collagen deposition and astrocyte loss in cerebral microinfarct
To investigate cellular-level alterations following microinfarction, we performed a longitudinal repetitive intravital imaging of the cerebral cortex for 30 days after the induction of PT in a live mouse implanted with the cranial imaging window. To simultaneously visualize astrocyte and pericyte composing the neurovascular unit (NVU), we used a double transgenic mouse by cross-breeding a pericyte-reporter NG2-DsRed mouse and an astrocyte-reporter Aldh1l1-GFP mouse (Figure S2). In the sham control group (n = 5), no identifiable cellular-level alteration was observed up to 30 days in the same location of cerebral cortex (Figure S3). In the microinfarction group (n = 5), acute tissue expansion followed by gradual tissue shrinkage was observed (Figure 2a, upper panel). A vasculature map identified on the bases of arteriole and venule identified by NG2-DsRed and CD31 labeling (Figure 2a, lower panel) showed that an acute ~1.5 folds expansion of the brain tissue, indicating a severe edema, for 1–2 days followed by a gradual shrinkage to the baseline at 5–8 days and then a significant 50% reduction of the brain tissue, indicating a focal brain atrophy, for 2–4 weeks (Figure 2b). Next, to identify the time-courses of fibrous glial scar formation and astrocyte changes, we imaged optically cleared 500 μm thick brain sections obtained from Aldh1l1-GFP mice after the microinfarct induction. Aldh1l1+ astrocytes almost completely disappeared inside the microinfarct at day 5 and failed to repopulate at day 30 (Figure 2c, upper panel). At day 5 with the astrocyte loss, SHG signal started to be detected in the microinfarct where no Aldh1l1+ astrocyte was observed, which progressively increased at day 11, 20, and 30 (Figure 2c,d).

3.3 Acute loss of astrocyte and neuron in the microinfarct
At 2 days after the induction of photothrombosis, we identified that Aldh1l1+ astrocytes and their processes disappeared from the microinfarct lesion (Figure 3a). To observe the cellular-level dynamics of the astrocyte loss, a time-lapse intravital imaging of Aldh1l1+ astrocyte and CD31+ EC was performed for 12 h starting from 1 day after the microinfarct induction, which revealed a sequential disappearance of juxtavascular Aldh1l1+ astrocytes along the blood vessel (Figure 3b and Video S2). In the sham control group, no alteration of Aldh1l1+ astrocyte was observed up to 30 days in the same location of cerebral cortex (Figure S4). In addition, the distribution of astrocyte and neuron in and around the microinfarct were identified by immunostaining with NeuN and glutamate transporter 1 (GLT-1), respectively. At day 0, both GLT-1+ astrocyte and NeuN+ neurons uniformly distributed in cortex (Figure 3c and Figure S5). At day 2, the DAPI+ nuclei number in the microinfarct significantly decreased by half (Figure 3d). Astrocytes in the microinfarct were poorly labeled by GLT-1 as compared to those in the peri-infarct whereas those in the normal area had similar level of staining to day 0. In addition, the number and the size of nuclei in NeuN+ neurons decreased greatly (Figure 3e,f), suggesting that these neurons were in the process of death.

3.4 Acute loss of pericyte coverage and recovery
To examine how pericyte responded following a microinfarction, a longitudinal intravital imaging of NG2+ pericyte at same cortex area in a single mouse was performed for 11 days after the microinfarct induction. To note, NG2+ pericyte lining the capillary could be clearly distinguished from NG2+ oligodendrocyte precursor cells (OPCs) not associated with vessels and NG2+ vascular smooth muscle cells (vSMCs) surrounding artery or vein (Figure S6). An acute decrease in the pericyte coverage over CD31+ blood vessels was observed at day 2, which was at least partially recovered at day 5 (Figure 4a). In the sham control group, no changes in pericyte processes length or vascular coverage was observed up to 30 days (Figure 4b and Figure S7). In the microinfarct, the processes length of NG2+ pericytes significantly decreased by more than 48% from day 1 to day 3 after the microinfarct induction then recovered at day 5 and maintained until day 11 (Figure 4b). To observe the cellular-level dynamics in the recovery of pericyte coverage, a time-lapse intravital imaging of NG2+ pericyte expressing histone H2B-GFP in their nuclei was performed for 24 h starting from 3.5 days after the microinfarct induction. Proliferation of juxtavascular NG2+ pericyte (Figure 4c and Video S3) and processes elongation along the vessel (Figure 4d and Video S4) were clearly imaged, suggesting that both processes contributed to the recovery of pericyte coverage from day 3 to day 5 after the microinfarct induction.

3.5 Impairment of vascular flow and leakage followed by partial recovery
To examine an impairment in cerebral vascular perfusion and leakage following a microinfarction, a longitudinal intravital imaging of blood flow at same cortex area in a single mouse was performed for 5 days in the peri-infarct after the microinfarct induction (Figure 5a). The blood flow was visualized by intravenously injected 2 MDa FITC-dextran and 3 kDa TRITC-dextran right before each imaging experiment at days 0, 3 and 5. At day 3, a leakage of 3 kDa TRITC-dextran but not 2 MDa FTIC-dextran from blood vessel to brain parenchyma was observed, suggesting a compromised blood–brain-barrier (BBB) integrity at least for smaller-sized molecules in the peri-infarct causing the edema observed at same time point (Figure 2a). Interestingly, the vascular leakage of 3 kDa TRITC-dextran was not observed at day 5. The fluorescence intensity of 3 kDa TRITC-dextran detected in brain parenchyma showed similar changes, significant increase at day 3 followed by decrease to the baseline at day 5, while the fluorescence intensity of 2 MDa FTIC-dextran showed no changed from day 0 to day 5 (Figure 5b,c). In addition, an impairment and recovery of vascular flow in cerebral microvasculature at peri-infarct area next to the site of photothrombosis was observed by a longitudinal intravital imaging for 5 days after the microinfarct induction. The blood flow and vasculature were visualized by intravenously injected Alexa Flour 647-dextran and a photo-convertible protein ‘Kaede’ (Tomura et al., 2008) with NG2-DsRed+ pericyte, respectively. For individual capillary branches followed for 5 days, four distinguishable dynamic patterns of changes in blood flow and vasculature were identified, including maintained flow, recovered flow, blocked flow, and vessel regression (Figure 5d and Figure S8). Among a total of 157 capillary branches identified at day 0 with blood flow (mouse n = 4), 83 capillary branches were observed to have no blood flow, categorized as blocked flow, at day 2. In each mouse, the proportion of individual capillary branches maintaining blood flow at day 2 ranged between 30.5% and 70% (Figure 5e). Interestingly, 18.9% of capillary branches observed with blood flow at day 2 were found to have no blood flow or have disappeared at day 5, which were categorized as blocked flow and vessel regression, respectively. On the other hand, 61.4% of capillary branches observed with no blood flow at day 2 were found to recover blood flow at day 5, which was categorized as recovered flow. These combined changes in the blood flow in capillary branches resulted in partial recovery of blood flow, from 47.6% at day 2 to 74% at day 5 (Figure 5e).

3.6 Accumulation of GFAP+ reactive astrocytes at peri-infarct
At day 4 after the microinfarct induction, a ~1.5 fold increase in the size of astrocyte soma was observed at peri-infarct area (Figure 6a,b). To identify the increase of astrocyte reactivity, an immunostaining of glial fibrillary acidic protein (GFAP) and SHG imaging were performed at day 30 after the microinfarct induction (Figure 6c,d). Based on the loss of Aldh1l1+ astrocytes and the formation of fibrous collagen-rich glial scar, the infarct area was delineated to identify the peri-infarct area (Figure 6c). Remarkably, GFAP+ reactive astrocytes appeared to be highly accumulated at the peri-infarct area up to ~200 μm away from the infarct border (Figure 6d). Serial observation of the peri-infarct area revealed that GFAP+ reactive astrocytes started to appear at the peri-infarct area at 2 days after the microinfarct induction and remained until 30 days with the glial scar formation (Figure 6e,f). In addition, Aldh1l1+ astrocyte in the peri-infarct area significantly increased from day 5 and remained until 30 days (Figure 6g,h). Sholl analysis of individual Aldh1l1+ astrocytes accumulated at the peri-infarct showed a significant increase of process lengths and a decrease of process number (Figure S9), implying an increased astrocyte reactivity accompanying the increased GFAP. Furthermore, an immunostaining of lipocalin2 (LCN2) showed an accumulation of LCN2+ GFAP+ astrocytes, presumably severe reactive astrocytes (Bi et al., 2013), co-localized with Aldh1l1+ astrocytes at the peri-infarct (Figure 6i).

4 DISCUSSION
In the present animal study, cortical microinfarction in the animal was induced by laser illumination-mediated ‘thrombosis’ of a cortical ‘penetrating arteriole’, which generates an irreversibly damaged ischemic core that is located within the cortex and surrounded by a small penumbral region (Grome et al., 1988). Middle cerebral artery occlusion (MCAO) is performed to generate large arterial cerebral infarcts, which also have an ischemic core that is surrounded by a penumbral region (Je et al., 2017), although to a much greater extent than the cortical microinfarcts. Moreover, photothrombosis-induced small cortical infarction was reported to show similar immune-mediated inflammatory characteristics as in large cerebral infarction caused by permanent MCAO (Jander et al., 1995; Schroeter et al., 1994), although further research is required to clarify the complexity of immune and inflammatory responses to stroke (Balch et al., 2020). In humans, cortical microinfarction has a heterogeneous etiology, such as intracranial atherosclerosis-related large cortical infarction as well as cerebral small vessel disease-related subcortical lacunar infarction (Hilal et al., 2016; Regenhardt et al., 2019). Cerebral microinfarct, a very small ischemic lesion (size <2 mm), can be presumably caused by vascular risk factors, small vessel diseases, microemboli, and hypoperfusion (van Veluw et al., 2017). Notably, patient with multiple microinfarcts are highly associated with dementia or impairments in cognition, perceptual capabilities and memories (Arvanitakis et al., 2011). A postmortem study of cortical microinfarcts showed tissue pallor with neuronal loss, extraneuronal aggregation of disorganzed lipofuscin granules, macrophage infiltration, and astrocytic scar (Yilmazer-Hanke et al., 2020). These pathologic features are also commonly seen in large arterial cerebral infarcts. In addition, subcortical lacunar infarction is caused by not only lipohyalinotic vessel wall thickening but also ‘thrombotic’ occlusion of the distal small ‘penetrating arteriolar’ branches of larger cerebral arteries (Fisher, 1968; Wardlaw & Pantoni, 2014). Lacunar infarcts have been reported to be highly related to progressive motor deficits by accumulative occlusion of penetrating branches in stroke patients (Steinke & Ley, 2002). Taking into account the small size of mouse brain, the small microinfarct (<2 mm) induced in this work occupies considerable volume in the mouse brain. Taken together, these previous studies suggest that our results from the microinfarction model inducing photothrombosis in a penetrating arteriole may also partly reflect pathophysiology of large arterial cortical infarcts and deep subcortical lacunar infarcts.
Conventional detection methods for cerebral microinfarcts are neuropathological examination, diffusion-weighted imaging (DWI), and high-resolution structural MRI (van Veluw et al., 2017). Neuropathological examination can detect the smallest hyperacute to chronic microinfarcts in a brain autopsy (Westover et al., 2013), DWI can detect a sub-millimeter sized small microinfarcts (Keir & Wardlaw, 2000), and high-resolution structural MRI using 7T (van Veluw et al., 2014) and 3T MRI (Hilal et al., 2016; van Veluw et al., 2015) can detect an 1–2 mm sized microinfarcts in the cortical gray matter of human brain. Notably, a post-mortem histological examination of brain sections of individuals with dementia showed a neuronal loss, collagen 4-positive microvessel and GFAP-positive astrocyte in the microinfarct core detectable by T2-weighted imaging (Yilmazer-Hanke et al., 2020). Histological examination of dissected brain tissue has the limitation in analyzing spatiotemporal changes in the microinfarct in vivo as it only provides information at the end-point. While non-invasive DWI and MRI can follow the microinfarct in vivo over long periods of time, the detectable sizes of microinfarct are limited to larger than ~1 mm and the follow-up time-points are relatively limited due to the high cost. Although its application is currently limited to animal model, the intravital microscopy capable of an in vivo longitudinal observation of brain based on chronic imaging window (Holtmaat et al., 2009) can be a better method to mechanistically investigate the spatiotemporal changes after the onset of small microinfarct in sub-cellular resolution in vivo. To note, intravital longitudinal imaging of mouse cerebral cortex enabled by the chronic imaging window has revealed a myelin degeneration and internodes loss in aged mouse (Hill et al., 2018), an impairment of short-term memory function with reduction of blood flow in Alzheimer's disease (AD) models APP/PS1 and 5xFAD mice (Cruz Hernandez et al., 2019), and neurovascular uncoupling, resulting from pericyte deficiency in mice with a loss-of-function mutation of platelet-derived growth factor receptor-β (Pdgfrb+/−) (Kisler et al., 2017).
In this study, we successfully performed a longitudinal imaging of mice for 1 month after the induction of microinfarction with a custom-built intravital confocal and two-photon microscope. The longitudinal imaging revealed an acute tissue expansion with an acute astrocyte loss at day 2 followed by gradual tissue shrinkage for 1 month, resulting in a cerebral atrophy with a neuronal loss and a persisted astrocyte loss in the microinfarct (Figures 2 and 3). Interestingly, a fibrous collagen-rich glial scar formation was observed in the microinfarct with second harmonic generation (SHG) imaging using the two-photon microscope (Figure 1d). SHG is a nonlinear optical process that two photons are combined to form a new photon with twice the energy, which efficiently occurs in noncentrosymmetric molecules such as the collagen in biological tissue enabling a visualization of collagen without additional labeling (Mostaco-Guidolin et al., 2017; Zipfel et al., 2003). A label-free SHG imaging have been widely used to monitor the fibrillar collagen in specimens of various fibrotic diseases in skin (Chen et al., 2009), liver (Goh et al., 2019), lung (Kottmann et al., 2015), carotid artery (Megens et al., 2008), eye (Tan et al., 2007), tendon and ligaments (Doras et al., 2011). In brain tissue, SHG imaging was used to investigate the structure and polarity of microtubules in neuronal processes (Dombeck et al., 2003; Van Steenbergen et al., 2019), and collagen deposition in glioblastoma (Jiang et al., 2017). However, to the best of our knowledge, neither the fibrous collagen accumulation and scar formation associated with the brain microinfarcts nor the SHG imaging of them has been reported.
In the central nervous system (CNS), fibrotic scar has been reported to be generated by scar-forming cells such as EC, immune cells, fibroblasts, and astrocyte in focal damaged tissue associated with neurodegenerative diseases (D'Ambrosi & Apolloni, 2020; Dorrier et al., 2021), spinal cord injury (Hara et al., 2017) and brain injuries (Frik et al., 2018; Huang et al., 2014). After CNS injury, fibrotic scar segregated the damaged lesion from normal tissue to prevent the spread of cellular damage, however, on the other hand it impaired axonal regeneration and thus limited functional recovery (Kawano et al., 2012). Reducing fibrotic scar formation by ablating CNS fibroblasts reduced motor disability in experimental autoimmune encephalomyelitis (EAE) mouse model of multiple sclerosis (Dorrier et al., 2021). Moreover, suppression of scar formation by intracerebral injection of 2,2′-dipyridyl (DPY) to inhibit the type VI collagen formation reportedly promoted axonal regeneration after traumatic brain injury (Yoshioka et al., 2010). These reports suggest that elucidating the underlying cellular and molecular mechanisms in fibrous glial scar formation surrounding the microinfarct could potentially led to the development of therapeutics to alleviate an adverse impact of the microinfarct.
A significant increase of astrocyte reactivity can be induced after CNS insults, such as trauma, stroke, infection, and neurodegenerative diseases (Sofroniew, 2009). In this process, astrocytes undergo dramatic changes in their morphology, hypertrophy of soma and processes, and in molecular expression including elevated glial fibrillary acidic protein (GFAP), and then they can induce a glial scar formation in CNS in severe cases (Hara et al., 2017; Sofroniew, 2009; Wanner et al., 2013). In our study, at 4 days after the microinfarct induction, a ~1.5 fold increase in the size of astrocyte soma was observed at peri-infarct area (Figure 6a,b), suggesting a reactive astrocyte change. Consistently, at the peri-infarct area, GFAP+ reactive astrocytes started to be observed from 2 days after the microinfarct induction and were highly accumulated until 30 days with fibrous collagen accumulation (Figure 6c–f). Furthermore, Lipocalin 2 (LCN2), a maker of severe reactive astrocyte, was co-expressed in GFAP+ reactive astrocyte at the peri-infarct area (Figure 6i). LCN2 has been reported as an autocrine factor for reactive astrocytosis (Lee et al., 2009), has a neurotoxicity, and can be secreted from GFAP+ reactive astrocytes in neurodegenerative disease animal model (Bi et al., 2013). Additionally, severe reactive astrocytes recognized by co-expression of LCN2 and GFAP were characterized as scar-forming reactive astrocytes in spinal cord injury animal model (An et al., 2020).
In this study, we longitudinally observe a complex cellular-level changes of astrocyte, pericyte and vascular functions and integrity after microinfarct induction. While acute loss of pericyte coverage, impaired vascular flow and integrity are partially recovered at day 5, the acute loss of astrocyte and neuron persists in the microinfarct at day 30. Notably, a fibrous collagen-rich glial scar formation is observed in the microinfarct with accumulation of GFAP+LCN2+ reactive astrocytes in the peri-infarct. Collectively, our longitudinal intravital imaging study of neurovascular pathophysiology in cerebral microinfarction demonstrate a susceptibility of astrocytes to ischemic brain injury and their reactive response leads to a long-term glial scar formation in cerebral cortex.
ACKNOWLEDGMENTS
We would like to thank Dr. W. Chung (Korea Advanced Institute of Science and Technology, Korea) for providing the Aldh1l1-GFP mouse, and Dr. Tomura and Dr. Miwa (Kyoto University, Japan) for providing the Kaede mouse. This work was supported by the Brain Research Program (2016M3C7A1913844) and the Basic Research Program (2020R1A2C3005694) funded by the Ministry of Science and ICT, Republic of Korea. Dr. D.-E. Kim was supported by the National Priority Research Center program (NRF-2021R1A6A1A03038865) and the Basic Science Research Program (NRF-2020R1A2C3008295) of the National Research Foundation of Korea. [Correction added on February 11, 2022, after first online publication: Acknowledgment section has been updated]
CONFLICT OF INTEREST
The authors declare no conflict of interest.
AUTHOR CONTRIBUTIONS
Jingu Lee designed and performed the experiments, analyzed and interpreted data, and wrote manuscript. Joon-Goon Kim, Sujung Hong, Young Seo Kim, Soyeon Ahn, Ryul Kim performed experiments and interpreted data. Heejung Chun, Ki Duk Park, Yong Jeong, C. Justin Lee, Dong-Eog Kim, Taeyun Ku interpreted data, reviewed and edited the paper. Pilhan Kim supervised the study, design the experiments, interpreted data and wrote the manuscript. All authors read and approved the final manuscript.
Open Research
DATA AVAILABILITY STATEMENT
The data that supports the findings of this study are available in the supplementary material of this article.