Giemsa-negative chromosome bands preferentially recombine in cancer-associated translocations and gene fusions
Funding information: Swedish Cancer Foundation; Swedish Childhood Cancer Foundation
Abstract
Chromosome abnormalities, in particular translocations, and gene fusions are hallmarks of neoplasia. Although both have been recognized as important drivers of cancer for decades, our knowledge of the characterizing features of the cytobands involved in recombinations is poorly understood. The present study, based on a comparative analysis of 10 442 translocation breakpoints and 30 762 gene fusions comprising 13 864 protein-coding genes, is the most comprehensive evaluation of the interactions of cytobands participating in the formation of such rearrangements in cancer. The major conclusion is that although large G-negative, gene-rich bands are most frequently involved, the greatest impact was seen for staining properties. Thus, 60% of the recombinations leading to the formation of both translocations and fusion genes take place between two G-negative bands whereas only about 10% involve two G-positive bands. There is compelling evidence that G-negative bands contain more genes than dark staining bands and it has previously been shown that breakpoints involved in structural chromosome rearrangements and in gene fusions preferentially affect gene-rich bands. The present study not only corroborates these findings but in addition demonstrates that the recombination processes favor the joining of two G-negative cytobands and that this feature may be a stronger factor than gene content. It is reasonable to assume that the formation of translocations and fusion genes in cancer cells, irrespective of whether they have a pathogenetically significant impact or not, may be mediated by some underlying mechanisms that either favor the origin or provide a selective advantage for recombinations of G-negative cytobands.
1 INTRODUCTION
Chromosome aberrations are a hallmark of cancer, and cytogenetic investigations of neoplastic cells have been decisive for our present understanding that cancer at the cellular level is a genetic disorder. Chromosome aberrations leading to disturbances in the regulation of proliferation and differentiation have been revealed in all tumor types studied in a sufficient number to allow conclusions and a steadily increasing number of characteristic chromosome rearrangements have been found to be strongly associated with specific tumor entities; in many instances, such aberrations may even be pathognomonic for distinctive tumor types.1, 2 These findings have important clinical implications to help establish a correct diagnosis, to predict prognosis, and to select the most appropriate treatment. Cytogenetics has furthermore become an important tool in the search for cancer-causing genes in that identification of tumor-specific chromosome rearrangements may shed light on chromosome segments that can be expected to harbor genes of significance for cancer development. Practically all balanced rearrangements, in particular translocations, that have been characterized at the molecular level have been shown to exert their effects through one of two alternative mechanisms: deregulation of a gene in one breakpoint or the creation of a hybrid gene through fusion of parts of two genes, one in each breakpoint.3 Paradigmatic examples of these two mechanisms are deregulation of the MYC gene in Burkitt lymphoma and the BCR::ABL1 chimeric gene in chronic myeloid leukemia, respectively. Deep sequencing or massively parallel sequencing (MPS) has during the last two decades revolutionized the possibility to detect gene fusions without any previous cytogenetic guidance about genomic rearrangements. Such studies have led to a dramatic increase of identified fusion genes in neoplastic disorders.4-6
The aim of the present study was to reveal possible characterizing features of the cytobands involved in recombinations in cytogenetically detected translocations and gene fusions in malignant disorders in terms of chromosomal location, band size and staining properties, and gene content. Previous studies have shown that breakpoints of individual bands involved in structural chromosome rearrangements and in genes forming chimeric genes preferentially affect gene-rich bands,7, 8 but no studies have been performed on the general characteristics of the interacting bands participating in recombinations. We show that the results obtained by both cytogenetic and molecular genetic studies, in spite of their fundamentally different resolution levels, are highly concordant in that Giemsa-negative bands preferentially recombine in both cancer-associated translocations and gene fusions.
2 MATERIALS AND METHODS
Cytogenetically detected chromosome abnormalities were extracted from the Mitelman Database of Chromosome Aberrations and Gene Fusions in Cancer9 on January 15, 2022 containing 72 603 neoplastic disorders reported in the literature in which at least one clonal numerical and/or structural chromosome change had been identified. Furthermore, 8253 cytogenetically abnormal unpublished cases from our laboratory were also ascertained, making a total of 80 856 cases available for inclusion. Next, all translocations in which the breakpoints had been localized to specific chromosome bands were selected. Hence, all descriptions of translocations indicating breakpoint uncertainty, that is, denoting alternative interpretations (or), containing a question mark (?), having a breakpoint interval indicated as an approximate sign (~), or lacking band specifications were excluded. For the present study, all benign tumors were excluded, leaving 72 296 malignant neoplasms containing 15 023 well characterized translocations.
Considering the general problems inherent in cytogenetic studies in precisely localizing breakpoints to specific bands, we restricted our study to only recurrent translocations, thereby avoiding ambiguities as far as possible. Furthermore, in order to avoid bias in the existing data due to overrepresentation in the literature of characteristic aberrations reported in specific tumor entities and selective reporting of characteristic tumor-associated abnormalities, identical recurrent translocations were counted only once; for example, t(9;22)(q34;q11), present in 4074 cases of chronic myeloid leukemia (CML), 1283 acute lymphoblastic leukemias, and 344 acute myeloid leukemias, were counted as one recurrent translocation. Variant translocations in CML were excluded. After applying the abovementioned exclusion criteria, a total of 5221 unique recurrent translocations remained for analyses and forms the basis of the present study.
The breakpoint distribution of the 5221 unique translocations in each of the 320 bands of the standard human karyotype was compared with the gene content (number of protein-coding genes with an HGNC/NCBI gene ID) and band length (defined as number of nucleotides); these data were retrieved from Ensembl genome database assembly GRCh38.p13 (http://www.ensembl.org/index.html). Band staining properties according to ISCN (2020)10 were classified into two groups: 163 G-positive dark bands (B), including 37 heteromorphic bands, and 157 G-negative light bands (W). The B and W bands are of equal size, median 9.0 Mb. Given the similar average size of W and B bands, the expected frequencies of WW and BB combinations can be calculated as (157/320)2 × 100 = 24.1% and (163/320)2 × 100 = 25.9%, respectively. The total number of protein-coding genes in the genome was 19 202; the number of genes per band ranged from 0 to 774 (median 38), 23 bands contained no such genes. Band lengths varied between 1.00 and 30.6 Mb and were subdivided into three equally large groups designated L (large; 11.4–30.6 Mb, median 14.5 Mb, n = 107), M (medium; 6.5–11.3 Mb, median 9.0 Mb, n = 108), and S (small; 1.0–6.4 Mb, median 4.4 Mb, n = 105). The proportions of L, M, and S bands are equal in B and W bands (approximately one-third in each). Chromosomes were subdivided according to size into four groups: large-sized chromosomes 1–5 (La), medium-sized chromosomes 6–12 and X (Me), intermediate-sized chromosomes 13–18 (In), and small-sized chromosomes 19–22 and Y (Sm).
The frequency with which each of the 320 bands was involved in translocations was classified into three categories: 0–3 breakpoints (10th percentile and below), 4–79 breakpoints, and 80–185 breakpoints (90th percentile and above); comparisons were made between the two extreme groups as well as between these two groups and the intermediate group in the interval between the 10th and 90th percentiles.
All unique fusion genes in malignant disorders were retrieved from the Mitelman Database9 on April 8, 2022 comprising a total of 30 762 gene fusions involving 13 864 protein-coding genes. In accordance with the cytogenetic data, each chimeric gene was counted only once irrespective of tumor site and histogenetic origin. The fusion genes in the total material of malignant neoplasms were subdivided into three major groups: hematologic disorders, epithelial tumors, and nonepithelial tumors. These three entities were further subdivided into subgroups containing a sufficient number of fusion genes to allow meaningful comparisons: 2102 in hematologic malignancies classified as acute myeloid leukemias, acute lymphoblastic leukemias, and malignant lymphomas; 23 056 in malignant epithelial tumors subdivided into 11 entities based on their location (breast, lung, prostate, etc), and 4071 in nonepithelial tumors classified as neuroglial neoplasms, malignant melanomas, and bone and soft tissue tumors. The band location of each gene involved in a fusion was identified, and the staining characteristics of each participating band were determined.
Independent samples t test and Chi square test were used to compare gene content and band length between groups, and the association between groups and G-staining properties, respectively. Linear regression analyses were used to study associations between breakpoint localizations in relation to gene content, band length, and G-band staining properties. The coefficient of determination (R2) was calculated for each model. To compare the predictive value of band length, gene content, and G-band staining properties, the increase in R2 (denoted R2 diff) when adding one of the variables to a univariable model including one of the other variables, was calculated. All analyses were performed in SAS 9.4 (SAS Institute Inc., Cary, NC) and a p value lower than 0.05 was considered significant.
3 RESULTS
3.1 General aspects of breakpoint distributions in unique recurrent translocations
All parameters studied, that is, number of breakpoints per band, band length (number of nucleotides), band size category (L/M/S), band staining property (B/W), and gene content are presented in Table S1. These data are summarized at the chromosome level in Table 1 which shows the distribution of the 10 442 breakpoints in relation to chromosome length, breakpoint occupancy (number of breakpoints per Mb), and gene content in the 5221 unique recurrent translocations. As can be seen, there are considerable differences among chromosomes in regard to numbers of breakpoints/Mb. Among the autosomes, most breakpoints/Mb are found in chromosomes 17 (6.0), 22 (5.2), 1 (5.0), 21 (5.0), and 11 (4.9); the lowest numbers are seen in chromosomes 4 (1.8), 2 (2.1), 10 (2.6), 18 (2.7), 5 (2.8), and 20 (2.8). Regression analyses (not shown) demonstrated a highly significant association between numbers of breakpoints vs. chromosome length (p < 0.0001) and numbers of breakpoints vs. gene content (p = 0.0001) at univariable analyses. In multivariable analyses, both gene content and chromosome length remained statistically significant (p < 0.05 in both comparisons), but the R2 differences indicated that gene content provided the best explanation of the breakpoint distributions.
| Chromosome No. | No. of breakpoints | Chromosome length (Mb) | No. of breakpoints (Mb) | No. of genes | No. of genes (Mb) |
|---|---|---|---|---|---|
| 1 | 1240 | 249 | 5.0 | 1993 | 8.0 |
| 2 | 517 | 242 | 2.1 | 1208 | 5.0 |
| 3 | 777 | 198 | 3.9 | 1040 | 5.3 |
| 4 | 338 | 190 | 1.8 | 737 | 3.9 |
| 5 | 502 | 182 | 2.8 | 854 | 4.7 |
| 6 | 513 | 171 | 3.0 | 1003 | 5.9 |
| 7 | 614 | 159 | 3.9 | 882 | 5.6 |
| 8 | 534 | 145 | 3.7 | 653 | 4.5 |
| 9 | 559 | 138 | 4.0 | 752 | 6.5 |
| 10 | 344 | 134 | 2.6 | 710 | 5.3 |
| 11 | 662 | 135 | 4.9 | 1261 | 9.3 |
| 12 | 602 | 133 | 4.5 | 996 | 7.5 |
| 13 | 379 | 114 | 3.3 | 315 | 2.8 |
| 14 | 440 | 107 | 4.1 | 590 | 5.5 |
| 15 | 326 | 102 | 3.2 | 570 | 5.6 |
| 16 | 270 | 90 | 3.0 | 815 | 9.1 |
| 17 | 503 | 83 | 6.0 | 1134 | 13.7 |
| 18 | 216 | 80 | 2.7 | 262 | 3.3 |
| 19 | 233 | 59 | 3.9 | 1381 | 23.4 |
| 20 | 183 | 64 | 2.8 | 524 | 8.2 |
| 21 | 235 | 47 | 5.0 | 225 | 4.8 |
| 22 | 267 | 51 | 5.2 | 423 | 8.3 |
| X | 168 | 156 | 1.1 | 831 | 5.3 |
| Y | 20 | 57 | 0.4 | 43 | 0.8 |
| Total | 10 442 | 3086 | 3.4 | 19 202 | 6.2 |
3.2 Characteristics of bands involved in unique translocations
Figure 1, based on Table S1, shows the distribution of the 10 442 breakpoints involved in the 5221 unique recurrent translocations. As can be seen, all 320 bands except two (Xq12 and Xq25) are involved, and there is a clear nonrandom involvement of certain bands. The most frequently involved bands (90th percentile and above; 80–185 breakpoints) are located in chromosomes 1 (7 bands), 11, 12, and 17 (3 bands), 3, 7, 8, 9, 14, and 19 (2 bands), 5, 6, 13, 21, and 22 (1 band). The least frequently involved bands (10th percentile and below; 0–3 breakpoints) are located in chromosomes 1–4, 6, 13–16, 19, 21, 22, X, and Y. The 90th percentile bands are significantly more often light-staining (p < 0.0001), larger (p < 0.0001), and more gene-rich (p < 0.0001) than the 10th percentile bands.
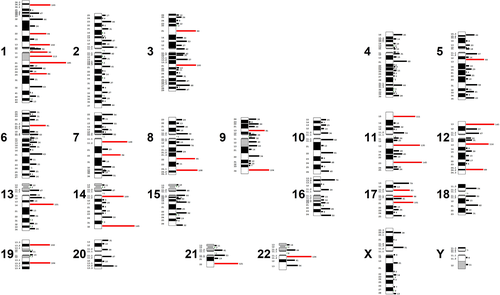
Table 2 shows univariable and multivariable regression analyses of associations between number of breakpoints in relation to gene content, band length, and G-band staining properties. As can be seen, there are highly significant associations between the breakpoint distribution and all three parameters at univariable analyses with more breakpoints occurring in gene-rich, large, and G-negative bands (p < 0.0001). It should be noted that gene content and G-band staining characteristics each explain more than 30% of the breakpoint variation whereas the contribution of band length is only 8%. In multivariable analyses, gene content and band staining remained statistically significant (p < 0.0001 for all pairwise comparisons), whereas the contribution of band length in relation to gene content was negligible (R2 diff = 0.01). In general, the R2 differences clearly indicate that gene content and band staining provided the best explanation of the breakpoint distribution.
| Gene content | Band length | G-band staining | Full model | |||||
|---|---|---|---|---|---|---|---|---|
| Model | p value | R2 | p value | R2 | p value | R2 | R2 | R2 diff |
| Univariable | <0.0001 | 32.90 | <0.0001 | 7.95 | <0.0001 | 32.30 | ||
| Length (genes) | <0.0001 | 0.8677 | 32.90 | 0.01 | ||||
| Staining (genes) | <0.0001 | <0.0001 | 50.20 | 17.30 | ||||
| Genes (length) | <0.0001 | 0.8677 | 32.90 | 24.96 | ||||
| Staining (length) | <0.0001 | <0.0001 | 44.14 | 36.20 | ||||
| Genes (staining) | <0.0001 | <0.0001 | 50.20 | 17.90 | ||||
| Length (staining) | <0.0001 | <0.0001 | 44.14 | 11.84 | ||||
- Note: Model with only the column variable as predictor. Column R2 diff shows how much R2 increases when the variable outside parenthesis is added to a model with the variable inside parenthesis.
3.3 Chromosome level characteristics of breakpoint recombinations
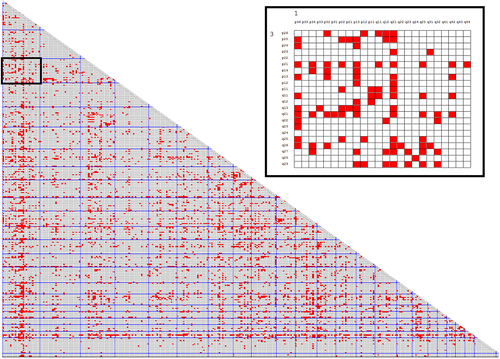
All breakpoint recombinations of the unique recurrent translocations are presented in Table S2 and visualized in Figure 2 in a matrix format. These translocations with 10 442 breakpoints resulted in 5221 band recombinations constituting 10.2% of the 51.360 possible recombinations. The breakpoint combination pattern clearly deviates from a random distribution in that certain chromosome combinations are favored, others clearly underrepresented.
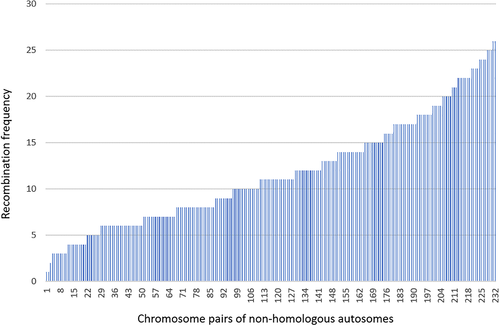
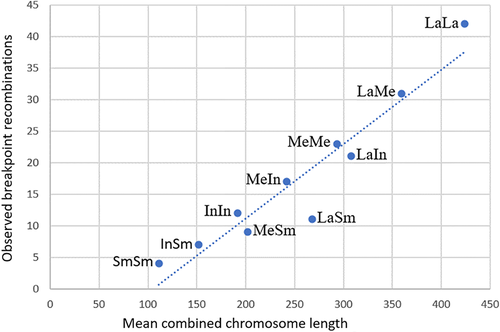
Information about chromosome size, gene content and number of possible band combinations and observed band recombinations in the 300 pairwise comparisons are contained in Table S3. The main results as regards observed band recombinations in relation to various chromosome features may be summarized as follows: First, the recombination frequencies vary substantially (Figure 3) between different pairs of nonhomologous autosomes. As can be seen in Table S3, the lowest recombination frequency (1%) is seen in t(2;20) and t(4;18) whereas the highest (26%) is found in t(1;22) and t(8;12). Second, there is a highly significant correlation between chromosome length and recombination frequency. This is strikingly apparent in Table 3 where chromosomes are grouped according to the combined size of the two chromosomes involved in translocations, that is, size categories ranging from La + La to Sm + Sm. The highly significant correlation between mean combined chromosome length and observed breakpoint recombinations (R2 = 0.905) is shown in Figure 4. Since gene content and chromosome size are strongly interrelated (R2 = 0.987), there is consequently a highly significant correlation also between recombination frequency and gene content (R2 = 0.885).
| Chromosome size category (La, Me, In, Sm) | Combined chromosome length (Mb) | Number of genes | Observed breakpoint recombination frequency |
|---|---|---|---|
| La + La (n = 15) | 424 | 2333 | 42.0 |
| La + Me (n = 40) | 359 | 2052 | 31.0 |
| La + In (n = 30) | 308 | 1781 | 20.9 |
| Me + Me (n = 36) | 293 | 1772 | 22.8 |
| La + Sm (n = 25) | 268 | 1686 | 11.1 |
| Me + In (n = 48) | 242 | 1500 | 16.6 |
| Me + Sm (n = 40) | 202 | 1405 | 8.7 |
| In + In (n = 21) | 192 | 1229 | 11.7 |
| In + Sm (n = 30) | 152 | 1134 | 6.5 |
| Sm + Sm (n = 15) | 111 | 1038 | 4.0 |
3.4 Band level characteristics of breakpoint recombinations
Each of the 5221 observed band recombinations and 46 139 noninvolved band combinations were evaluated according to their distribution in regard to the six possible combinations of band size (LL, LM, LS, MM, MS, and SS) and the three combinations of staining properties (BB, BW, and WW). The results are presented in Table 4, which also shows the mean gene content in each category, and illustrated in Figure 5. There are some notable differences between the observed and noninvolved distributions as regards band size. The observed band recombinations are clearly more common in the two largest band combinations. Thus, 47.5% of the 5221 observed recombinations take place in the combined LL and LM groups as compared to 32.2% in the noninvolved group. In contrast, the corresponding figures for the smallest SS group are 5.1% versus 11.5%. Notably, in this context, 16.4% of the possible 5778 LL band combinations are involved in a recombination, in sharp contrast to only 4.8% of the possible 5565 SS band combinations. However, as can be seen in Figure 5, the most obvious differences as regards frequencies of observed recombinations and noninvolved band combinations relate to band staining properties. Thus, 60.1% of observed recombinations take place between two G-light bands (WW) in contrast to only 8.0% between two G-dark bands (BB). The corresponding figures among noninvolved combinations are 20.1% and 28.1%, respectively. Similarly, no less than 25.3% of the 12 403 possible WW combinations harbor an observed recombination in contrast to only 3.1% of the 13 366 possible BB combinations. It should be noted that dark and light bands are of equal size, median 9.0 Mb for both. The general conclusion is thus that staining properties have a greater impact than band size on the frequencies of observed recombinations. As expected from the results presented in Table 2 for individual band characteristics, that is, large light bands are more gene-rich than small dark bands, there is a gradual decrease in mean number of genes from 246 in the LL group to 47 in SS, and from 211 in WW to 57 in BB. This association is almost identical for observed recombinations and noninvolved band combinations (R2 = 0.988), only the figures are generally lower among the latter.
| Possible band combinations | Observed band recombinations | Noninvolved band combinations | Mean No. of genes | |||||
|---|---|---|---|---|---|---|---|---|
| Band characteristics | No. | % | No. | % | No. | % | Observed band recombinations | Noninvolved band combinations |
| Band size combinations | ||||||||
Large/large (LL) Median 29.0 Mb |
5778 | 11.3 | 947 | 18.1 | 4831 | 10.5 | 246 | 197 |
Large/medium (LM) Median 23.5 Mb |
11 556 | 22.5 | 1535 | 29.4 | 10 021 | 21.7 | 186 | 148 |
Large/small (LS) Median 18.9 Mb |
11 235 | 21.9 | 934 | 17.9 | 10 301 | 22.3 | 158 | 122 |
Medium/medium (MM) Median 18.0 Mb |
5886 | 11.5 | 673 | 12.9 | 5213 | 11.3 | 116 | 107 |
Medium/small (MS) Median 13.4 Mb |
11 340 | 22.1 | 866 | 16.6 | 10 474 | 22.7 | 82 | 77 |
Small/small (SS) Median 8.8 Mb |
5565 | 10.8 | 266 | 5.1 | 5299 | 11.5 | 47 | 46 |
| Band staining properties | ||||||||
| White/white (WW) | 12 403 | 24.2 | 3138 | 60.1 | 9265 | 20.1 | 211 | 167 |
| Black/white (BW) | 25 591 | 49.8 | 1666 | 31.9 | 23 925 | 51.8 | 149 | 118 |
| Black/black (BB) | 13 366 | 26.0 | 417 | 8.0 | 12 949 | 28.1 | 57 | 64 |
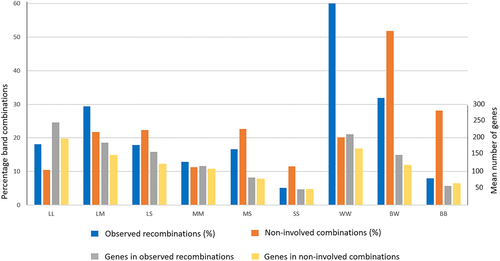
Table 5 and Figure 6 show the results when considering the consequences of the combined effects of band size and staining properties in the resulting 18 groups. The distribution of observed recombinations differs substantially from the noninvolved combination possibilities. The most characteristic feature is that the combinations containing two light bands irrespective of band size (LL/WW, LM/WW, LS/WW, MM/WW, and MS/WW) predominate among the observed recombinations (8.8%–19.7%); the only exception is SS/WW found in only 2.1%. The two most striking examples are LL/WW (10.0% vs. 1.4%) and LM/WW (19.7% vs. 3.9%). In contrast, all BB combinations are underrepresented, for example, LS/BB (1.6% vs. 6.8%) and MM/BB (0.4% vs. 2.6%). There is within each size category (LL, LM, LS, MM, MS, and SS) in all instances a stepwise increase of observed recombinations related to staining properties in that the lowest recombination frequencies are seen in BB followed by BW and then by WW. The levels differ among the six categories, but the pattern is strikingly similar in all of them. In accordance with the data presented above regarding band size and staining properties evaluated separately, the combined data further support the conclusion that chromosomal breakpoints to a certain degree involve larger bands but preferentially take place in light bands.
| Possible band combinations | Observed band recombinations | Noninvolved band combinations | Mean No. of genes | |||||
|---|---|---|---|---|---|---|---|---|
| Band size and staining properties | No. | % | No. | % | No. | % | Observed band recombinations | Noninvolved band combinations |
| LL/BB | 1770 | 3.4 | 85 | 1.6 | 1685 | 3.7 | 100 | 100 |
| LL/BW | 2832 | 5.5 | 341 | 6.5 | 2491 | 5.4 | 275 | 202 |
| LL/WW | 1176 | 2.3 | 521 | 10.0 | 655 | 1.4 | 362 | 290 |
| LM/BB | 2891 | 5.6 | 77 | 1.5 | 2814 | 6.1 | 79 | 83 |
| LM/BW | 5833 | 11.4 | 427 | 8.2 | 5406 | 11.7 | 194 | 151 |
| LM/WW | 2832 | 5.5 | 1031 | 19.7 | 1801 | 3.9 | 284 | 211 |
| LS/BB | 3245 | 6.3 | 85 | 1.6 | 3160 | 6.8 | 59 | 62 |
| LS/BW | 5590 | 10.9 | 335 | 6.4 | 5255 | 11.4 | 180 | 122 |
| LS/WW | 2400 | 4.7 | 514 | 9.8 | 1886 | 4.1 | 236 | 183 |
| MM/BB | 1225 | 2.4 | 22 | 0.4 | 1203 | 2.6 | 60 | 67 |
| MM/BW | 2891 | 5.6 | 148 | 2.8 | 2743 | 5.9 | 110 | 110 |
| MM/WW | 1770 | 3.4 | 503 | 9.6 | 1267 | 2.7 | 177 | 145 |
| MS/BB | 2695 | 5.2 | 82 | 1.6 | 2613 | 5.7 | 29 | 46 |
| MS/BW | 5695 | 11.1 | 326 | 6.2 | 5369 | 11.6 | 89 | 79 |
| MS/WW | 2950 | 5.7 | 458 | 8.8 | 2492 | 5.4 | 128 | 107 |
| SS/BB | 1540 | 3.0 | 66 | 1.3 | 1474 | 3.2 | 13 | 25 |
| SS/BW | 2750 | 5.4 | 89 | 1.7 | 2661 | 5.8 | 46 | 46 |
| SS/WW | 1275 | 2.5 | 111 | 2.1 | 1164 | 2.5 | 81 | 66 |
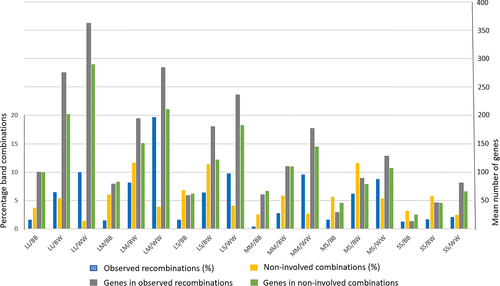
As can be seen in Table 5, the mean gene content in both observed band recombinations and noninvolved band combinations varies considerably among the different groups. With a few exceptions, the mean gene content is higher in the observed band recombinations. Taken into consideration the large quantitative intergroup differences in terms of numbers of observed and noninvolved combinations, it can be calculated that in the total material the mean number of genes is 1.9 times higher among observed recombinations as compared to noninvolved combinations (204.9 vs. 110.2).
The combined effects of band size and staining properties for the 18 groups were also compared (data not shown) between the three major types of malignant disorders, namely hematologic malignancies (HM), malignant epithelial tumors (MET), and malignant bone and soft tissue tumors (MBST). The results showed a very high degree of concordance with the following R2 values: HM versus MET 0.95, HM versus MBST 0.94, and MET versus MBST 0.93.
3.5 Band characteristics of fusion genes
Band characteristics of the 13 864 genes involved in 30 762 unique gene fusions are presented in Table S1. The distribution of the breakpoints along chromosomes in all gene fusions is displayed in Figure 7. In total, 294 out of 320 bands are affected and there is a clear nonrandom involvement of certain bands. The 29 most frequently involved bands (90th percentile) are in decreasing order of frequency (No. of breakpoints in parentheses): 19q13 (567), 19p13 (458), 1p36 (296), 11q13 (219), 17q21 (218), 6p21 (210), 12q13 (190), 12q24 (181), 16p13 (180), 17q25 (169), 20q13 (165), 11p15 (163), 17p13 (161), 22q13 (161), 9q34 (149), 1q21 (148), 3p21 (139), 12p13 (132), 8q24 (129), 1p34 (119), 21q22 (117), 11q12 (115), 1q32 (113), 5q31 (112), 20q11 (108), 14q32 (103), 22q12 (99), 1q23 (92), and Xp11 (91). It may be noted that half of these bands are located in chromosomes 1, 11, 12, and 17. Among the 26 bands, all heterochromatic, that are not involved in any gene fusion, 23 contain no protein-coding genes. Strikingly, the gene fusion breakpoints are almost three times as often located in G-negative bands (range 0–567, mean 63.9, median 52) as compared to G-positive bands (range 0–115, mean 23.5, median 18). Notably, 27 of the 29 90th percentile bands are G-negative. There is a highly significant correlation between fusion gene band involvement and gene content (R2 = 0.971). This is true for both G-negative and G-positive bands (R2 = 0.974 and R2 = 0.897, respectively).
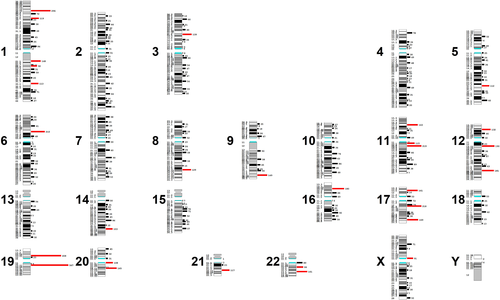
Table 6 shows data on the combinations of light and dark bands harboring the genes involved in the 30 762 unique fusion genes. The results are in very good agreement with the cytogenetic findings (Table 4). Thus, among all malignant neoplasms the WW group in the cytogenetic data set makes up 60.1% as compared to 60.2% in the molecular data set, and correspondingly the BB group in the cytogenetically investigated cases is only 8.0% and 13.0% among the fusion genes. The very large amount of information available on gene fusions in cancer as revealed by MPS makes it possible to evaluate the characteristics of the bands containing genes involved also in subtypes of malignant disorders, in particular solid tumors, information that to a large extent is not available for the cytogenetic data. As can be seen in Table 6, the pattern is strikingly similar among such diverse entities as hematologic malignancies and solid tumors representing various tumor locations and histogenetic origins. In all tumor entities, the WW group predominates (range 53.0%–72.3%) and the BB group is in a clear minority (range 5.7%–15.6%).
| Band staining characteristics | |||||||
|---|---|---|---|---|---|---|---|
| WW | BW | BB | |||||
| Tumor type | No. of gene fusions | No. | % | No. | % | No. | % |
| Malignant neoplasms, total | |||||||
| 30 762 | 18 512 | 60.2 | 8254 | 26.8 | 3996 | 13.0 | |
| Hematologic disorders | |||||||
| Acute myeloid leukemia | 495 | 318 | 63.9 | 149 | 30.1 | 28 | 5.7 |
| Acute lymphoblastic leukemia | 731 | 488 | 66.8 | 196 | 26.8 | 47 | 6.4 |
| Malignant lymphomas | 969 | 701 | 72.3 | 206 | 21.3 | 62 | 6.4 |
| Totala | 2102 | 1433 | 68.2 | 534 | 25.4 | 135 | 6.4 |
| Malignant epithelial tumors | |||||||
| Oral/nasal cavity | 968 | 589 | 60.8 | 232 | 24.0 | 147 | 15.2 |
| Lung | 4295 | 2555 | 59.5 | 1130 | 26.3 | 610 | 14.2 |
| Stomach | 1263 | 855 | 67.7 | 244 | 19.3 | 165 | 13.1 |
| Liver | 1257 | 793 | 63.1 | 288 | 22.9 | 176 | 14.0 |
| Colon/rectum | 742 | 423 | 57.0 | 210 | 28.3 | 109 | 14.7 |
| Kidney | 730 | 402 | 55.1 | 236 | 32.3 | 92 | 12.6 |
| Bladder | 1538 | 944 | 61.4 | 379 | 24.6 | 215 | 14.0 |
| Breast | 6490 | 3684 | 56.8 | 1861 | 28.7 | 945 | 14.6 |
| Ovary | 2239 | 1533 | 68.5 | 415 | 18.5 | 291 | 13.0 |
| Uterus | 2200 | 1543 | 70.1 | 393 | 17.9 | 264 | 12.0 |
| Prostate | 2270 | 1231 | 54.2 | 685 | 30.2 | 354 | 15.6 |
| Totala | 23 056 | 13 883 | 60.2 | 5993 | 26.0 | 3180 | 13.8 |
| Malignant nonepithelial tumors | |||||||
| Neuroglial neoplasms | 1825 | 987 | 54.1 | 599 | 32.8 | 239 | 13.1 |
| Malignant melanoma | 1670 | 990 | 59.3 | 463 | 27.7 | 217 | 13.0 |
| Bone and soft tissue tumors | 608 | 322 | 53.0 | 215 | 35.4 | 71 | 11.7 |
| Totala | 4071 | 2281 | 56.0 | 1266 | 31.1 | 524 | 12.9 |
- a The total numbers do not add up to the sums of individual entities because the same fusion genes may be found in different tumor types.
3.6 Comparison of breakpoint distributions obtained by cytogenetic and genomic studies
Table 7 shows the 46 most frequently involved bands (90th percentile) in cytogenetically identified translocations and MPS-detected gene fusions (Figures 1 and 7), 33 detected by cytogenetics, 29 through genomic studies, and 16 identified by both methods. The great majority, 42 of the 46 bands, are G-negative, including all of the 16 shared bands. The distribution as regards band size is quite equal. Of the 33 cytogenetically detected bands, 19 are L, 12M, and 2S. The corresponding figures for the 29 bands involved in gene fusions are 22L, 7M, and 0S. There is no significant difference as regards gene content; the mean values for the cytogenetic group are 182 and for the molecular group 237. It may be noted that mean gene content among the 16 shared bands is 285 versus 126 among the 30 bands that were detected by either cytogenetics or molecularly, that is, more than twice as many genes in bands detected by both methods.
| Cytoband | G-staining | Band length | No. of genes | Translocations | Gene fusions |
|---|---|---|---|---|---|
| 1p36 | W | L | 375 | X | X |
| 1p34 | W | L | 169 | X | |
| 1p22 | W | M | 65 | X | |
| 1p13 | W | M | 115 | X | |
| 1q11 | B | S | 0 | X | |
| 1q12 | B | L | 0 | X | |
| 1q21 | W | L | 224 | X | X |
| 1q23 | W | M | 133 | X | |
| 1q25 | W | L | 76 | X | |
| 1q32 | W | L | 146 | X | |
| 3p21 | W | M | 198 | X | X |
| 3q21 | W | M | 70 | X | |
| 5q13 | W | M | 58 | X | |
| 5q31 | W | L | 188 | X | |
| 6p21 | W | L | 290 | X | X |
| 7q11 | W | L | 86 | X | |
| 7q22 | W | M | 139 | X | |
| 8q22 | W | L | 66 | X | X |
| 8q24 | W | L | 167 | X | |
| 9p13 | W | S | 88 | X | |
| 9q34 | W | M | 212 | X | X |
| 11p15 | W | L | 299 | X | X |
| 11q12 | B | M | 195 | X | |
| 11q13 | W | L | 264 | X | X |
| 11q23 | W | M | 120 | X | |
| 12p13 | W | L | 187 | X | X |
| 12q13 | W | L | 267 | X | X |
| 12q24 | W | L | 211 | X | X |
| 13q14 | W | L | 87 | X | |
| 14q11 | W | M | 109 | X | |
| 14q32 | W | L | 140 | X | X |
| 16p13 | W | L | 249 | X | |
| 17p13 | W | M | 234 | X | |
| 17p11 | W | M | 67 | X | |
| 17q11 | W | M | 79 | X | |
| 17q21 | W | L | 300 | X | X |
| 17q25 | W | M | 195 | X | |
| 19p13 | W | L | 564 | X | X |
| 19q13 | W | L | 774 | X | X |
| 20q11 | W | M | 124 | X | |
| 20q13 | W | L | 217 | X | |
| 21q22 | W | L | 183 | X | X |
| 22q11 | W | M | 123 | X | |
| 22q12 | B | L | 112 | X | |
| 22q13 | W | L | 188 | X | |
| Xp11 | W | L | 174 | X |
4 DISCUSSION
The present study is the most comprehensive evaluation of the interactions of cytobands involved in recombinations in the dominant form of structural chromosome rearrangements in cancer, namely translocations, as well as in the major genomic consequence of translocations in cancer, namely gene fusions. A general problem in cancer cytogenetics is that the localization of breakpoints in rearrangements may be imprecise due to poor chromosome morphology, in particular in complex karyotypes, a common finding in cancer cells. In order to minimize such ambiguities we restricted our study to only recurrent translocations. Furthermore, to reduce bias in the existing data due to overrepresentation in the literature of characteristic aberrations reported in specific tumor entities and selective reporting of characteristic tumor-associated abnormalities, identical recurrent translocations were counted only once. With this approach, frequently occurring abnormalities do not skew the picture in that they are given the same weight as rare aberrations. For example, the 10 most common cancer-associated translocations in the database (t(9;22)(q34;q11), t(8;21)(q22;q22), t(14;18)(q32;q21), t(8;14)(q24;q32), t(11;14)(q13;q32), t(15;17)(q22;q21), t(12;21)(p13;q22), t(11;19)(q23;p13), t(9;11)(p22;q23), and t(11;22)(q24;q12), in decreasing order of frequency) have been reported in altogether 14 214 cases, that is, 29.4% of the 48 349 malignant disorders with a translocation reported in the literature.9 However, seen from the perspective of the present study where each of them are counted only once, these prevalent abnormalities altogether represent only the tip of an iceberg, that is, just 0.2% of all unique recurrent translocations. Similarly, each fusion gene, irrespective of how often it occurs, for example, the TMPRSS2::ERG fusion gene, which is found in about 50% of prostate cancer,11 was registered only once in this study. Both the cytogenetic and molecular data handled in this way, giving equal weight to rare and common recombinations, irrespective of in which tumor type they have been found, hence may provide a reasonably unbiased guidance to genomic regions of possible pathogenetic significance. Applying these criteria, we identified 5221 unique translocations involving 10 442 breakpoints encompassing 318 of the 320 bands. The same approach yielded a total of 30 762 gene fusions involving 13 864 protein-coding genes located in 297 bands.
The two methods for investigating the pattern of genomic recombinations used in the present study each have their specific merits and shortcomings. Thus, the findings can potentially be both supportive and disclose different aspects of the genetic reorganization events. Molecular detection of gene fusions by definition identifies only those rearrangements that affect two genes, whereas chromatin breaks and novel reunion of broken ends that hit only one or no gene are not registered. On the other hand, the breaks can be localized very precisely at the sub-band and nucleotide position levels. The advantage of cytogenetic analysis is that it is based on the findings in individual cells and hence capable of detecting aberrations occurring even in minor clones. The precise identification of breakpoint position is, however, inferior and can at best be determined to a cytoband at the 320 band resolution level. Moreover, no information is obtained on whether a break affects a gene or not. Still, cytogenetics may reveal translocations in which at least one breakpoint has occurred in a band containing no protein-coding gene, in particular heterochromatic bands. In the gene fusion database such an event is a blind spot.
We have previously shown that cancer chromosome breakpoints and breakpoints in fusion genes preferentially affect G-negative bands.7, 8 Our approach in the present study was to focus on the importance of the combined effects of band size and staining properties in regard to the formation of cancer-associated recombinations. We found that both play a role. However, although large bands are more frequently involved than small bands, the greatest impact was seen for staining properties in that recombinations involving G-negative bands predominate. Thus, 60.1% of observed cytogenetic recombinations take place between two light bands (WW) in contrast to only 8.0% between two G-positive bands (BB). The location of genes participating in the origin of fusion genes offers a unique possibility to evaluate the generalizability of the cytogenetic findings. It is of great interest that the fusion gene data show a remarkable correspondence with the cytogenetic data: in 60.2% of recombinations leading to gene fusions both breakpoints are located in light bands and only 13.0% in dark bands, that is, almost identical figures as for the formation of cytogenetically detected translocations. These figures are in sharp contrast to the expected frequencies of roughly 25% for both WW and BB if rearrangements occurred by chance.
Why G-negative bands are preferentially involved can only be speculated upon. The underlying mechanisms of the staining patterns yielding G-bands are not fully disclosed,12 but there is compelling evidence that light staining G-bands are less condensed, in general more GC-rich, and contain more genes than dark staining bands,13-15 and it seems logical to assume that these bands should be found to be more frequently involved in rearrangements. Indeed, we have previously shown that breakpoints involved in structural chromosome rearrangements and in genes forming chimeric genes preferentially affect gene-rich bands.7, 8 The present study not only corroborates these findings but in addition demonstrates that the recombination processes favor the joining of two G-negative cytobands and that this feature may be a stronger factor than gene content. The mean number of genes per band among observed recombinations is only 1.9 times higher as compared to all possible band combinations that have not yet been found to be involved in neither translocations nor gene fusions (204.9 vs. 110.2) whereas recombinations of two G-negative bands are no less than six times higher than between two G-positive bands. Thus, other factors than gene content probably also play a role. There are several reports of a preferential involvement of G-negative bands in constitutional structural rearrangements of animals and humans,16, 17 suggesting that G-negative bands may be more vulnerable to breakage. Other possible factors that may affect the origin of double-strand breaks in G-negative versus G-positive bands differently include, for example, common fragile sites,18 replication timing,19 and perhaps in particular interphase chromosome organization. There is overwhelming evidence from 3-D nuclear architecture studies20-22 that chromosomes occupy distinct territories with separate domains or compartments corresponding to functional differences, and it seems reasonable to assume that spatial proximity between genes and chromosomes in interphase cells may play an important role in the genesis of fusion genes and structural neoplasia-associated chromosome rearrangements, including translocations. However, clonal evolution—one of the most important hallmarks of cancer1—constantly operating as a driving force within a tumor cell population, results in a strong selection bias. Consequently, we only observe those changes that are either neutral or confer an evolutionary advantage on the cells carrying them. Hence, the genetic changes in neoplastic cells at the time of diagnosis of a cancerous state do not necessarily reflect the initial cancer-causing event(s).
Apart from the preferential involvement of G-negative bands in the formation of translocations and gene fusions, we found that the breakpoints in both data sets were clearly nonrandom (Figures 1 and 7) but that the breakpoint distribution patterns correspond only partially (R2 = 0.325, Figure 8). Several possible explanations for this discrepancy can be offered. First, aberrations that involve heterochromatic bands, containing no or few genes, are not detected when searching for fusion genes. However, such rearrangements can still be of pathogenetic importance through embedding and silencing of protein-coding genes into transcriptionally inactive heterochromatic sequences. Second, as mentioned above, cancer cells are characterized by often very complex karyotypes making it difficult to exactly determine breakpoint localizations at the interface between individual bands. Finally, there is evidence supporting the view that a clear majority of gene fusions detected by MPS may be stochastic events and that hence most reported gene fusions are passengers without any pathogenetic importance.3, 8 The differing results as regards exact breakpoint localizations obtained by the two investigative techniques is therefore not surprising. However, the fact that both approaches, in spite of their fundamentally different resolution levels, show a quantitively almost identical preference for interactions of G-negative bands is striking. These concordant results provide compelling, albeit indirect, support for the assumption that the formation of translocations and fusion genes in cancer cells, irrespective of whether they have a pathogenetically significant impact or not, may be mediated by some underlying mechanisms that either favor the origin or provide a selective advantage for recombinations of G-negative cytobands.

FUNDING INFORMATION
The Swedish Cancer Society and Swedish Childhood Cancer Foundation.
CONFLICT OF INTEREST
The authors declare no conflict of interest.
Open Research
DATA AVAILABILITY STATEMENT
The data that supports the findings of this study are available in the supplementary material of this article.


