Economic Feasibility of Agrivoltaic Systems for Sustainable Small Scale Farming
Funding: This work was supported by Hawaii Agriculture Reserach Center.
ABSTRACT
The global push toward renewable energy systems has prompted a desire to more efficiently use land through the co-location of agricultural and industrial activities. Agrivoltaic systems (AV), crops grown underneath/adjacent to solar photovoltaic (PV) panels, present a unique value proposition to produce food and energy in a single location. Here, we conducted a field trial within a PV site, empirically testing AV methods using small-scale sustainable farming practices in a peri-urban landscape in Hawaiʻi. By mimicking commercial production conditions, we identified the most profitable lettuce genotype (e.g., Magenta) and created an enterprise budget to generate realistic financial expectations for those (company, municipality, university) aiming to create energy-generating foodscapes. These empirical data generated in a commercial setting can be used as valuable inputs for future planning work in a range of different geographies.
1 Introduction
Deploying renewable energy systems in response to the climate crisis has prompted a dramatic transformation of landscapes and has motivated the re-thinking of potential land use efficiencies, including through co-location of activities (Hernandez, Easter, et al. 2014; Hernandez, Hoffacker, et al. 2014; Trainor et al. 2016; Zainali et al. 2025). Renewable energy often requires large tracts of land to produce sufficient energy, causing a land use conflict with food production (Abbott et al. 2017; Stern and Valero 2021). This complex challenge of managing land use change necessitates a multifaceted approach to ensure enough food and energy for the burgeoning global human population (Harvey and Pilgrim 2011; Calvert and Mabee 2015). One approach is combining renewable energy in the form of high-efficiency solar panels with agriculture in a high land-use efficiency system called agrivoltaics (AV)1 (Jain et al. 2021; Ibrahim et al. 2022).
The concept of AV was first introduced in the early 1980s (Proctor et al. 2021) when it was suggested that solar energy production and agriculture could coexist in one efficient system (Cagle et al. 2020). Recent studies have indicated that solar energy production could offset global energy demand if < 1% of cropland was converted to dual-use systems (Patel et al. 2019; Sekiyama and Nagashima 2019). The yield from agricultural products adds critical benefits such as an additional revenue stream that can help pay for capital improvements and increase access to land by reclassifying “industrial land” to “agricultural land” (Asa'a et al. 2025). However, the economics of dual land-use systems are understudied, leaving a gap for practitioners who wish to start new operations (Chamazkoti et al. 2025). AV can increase farm incomes by over 30% if yield losses through shading effects are minimized by the selection of suitable crops, though farm-specific conditions lead to wide variation (Weselek et al. 2019; Agostini et al. 2021; Abidin et al. 2021; Feuerbacher et al. 2021). However, there is often a negative relationship between crop performance and energy efficiency (Weselek et al. 2019; Riaz et al. 2021). AV systems will require choosing the suitable crop variety or crop type to maximize agricultural yield and energy production (Reher et al. 2025), with a general trend showing that leafy greens perform better than root crops in dual-use systems (Barron-Gafford et al. 2019). Another way to improve the quality and productivity of the crop is to create a hydroponic system. Hydroponic systems can help increase water use efficiency due to the ability to recycle water and nutrients (Barbosa et al. 2015). Hydroponic technology presents a sustainable alternative to in-ground production, offering higher yields and reducing water consumption (Morison et al. 2008). Further, the system allows more control over planting and harvesting, making marketing more manageable.
The peri-urban area of Oʻahu provides an interesting case study for AV systems because the island faces intense competition for the limited available land, high solar radiation, and strong demand for affordable local produce. The unique micro-environment (e.g., shade) created by AV systems can also alleviate the solar radiation and heat stress caused by Hawaiʻi's tropical climate. Therefore, this study developed a pilot farm on central Oʻahu that explored the variety of costs of setting up a commercial-scale hydroponic system at an already established megawatt-scale PV site. Within this case study, instead of simulating crop yields as is common in the nascent literature (e.g., Rabasoma et al. 2024), we conducted an empirical variety trial to identify the most profitable lettuce variety for production within the system. Thus, we created an empirically based enterprise budget that can be modified for specific locations, therefore providing a way to gain insight into the range of possibilities for AV.
2 Materials and Methods
2.1 Site Description
The project site was located at the Hawaiʻi Agrivoltaic Research and Demonstration Center located in the Mililani Agricultural Park at Clearway Energy at the Lanikuhana site (21.4263496 latitude, −158.0225322 longitude) (Figure 1a). The soil at the Mililani site is a Lahaina Series with the taxonomic classification as a very fine, kaolinitic, isohyperthermic Rhodic Eutrustox. The mean annual rainfall is 790 mm (mean January = 114 mm, mean July = 330 mm). The mean annual temperature is 22°C (mean January = 20.5°C, mean July = 23.7°C). The water source for Mililani Agricultural Park is from the Waiāhole Ditch System, and the source is located near the northwest edge of the site. The previous land use was primarily pineapple production before being acquired for solar energy production (Class D LSB Rating). Earlier class D land classification reports suggested that hydroponic systems are a more relevant choice for potential growers. The 12-ha enclosed parcel generates ~14 MW of power directly into the grid. A hydroponic system was chosen due to the expertise of commercial partners and the existence of commercial-scale aquaponic lettuce production in Oʻahu. A hydroponic system was installed due to capital costs associated with installing a whole aquaponic fish tank system (Figure 1b).

2.2 Hydroponic System
To prepare the site, the space for each planting trough was completely leveled to a 15 cm downhill gradient to ensure appropriate water flow from the top (north-facing) side of the trough to the bottom (south-facing). Each trough is ~30.5 m long and ~ 2.5 m in width and was constructed with approximately 6-m planks ~5 cm × 10 cm of timber on their side, additionally with plywood cut into 30 cm wide pieces and laid on their side to further support the trough (Figure 1b,c). The wood pieces were then anchored with square metal stakes 1 m in length every 1.5 m. The plywood pieces were placed a few cm off the ground to avoid rot, and outdoor screws were used for attaching wood pieces. Food-grade plastic called P2000 liner was purchased from Inland Plastics. The roll is approximately 3.5 m wide, and extra length was used to line the exterior perimeter of the trough and staple it down. The Styrofoam molds were custom-made and ordered locally from Pacific Allied Products, and 60 cm × 121 cm were used for a single person to harvest and fit into the trough comfortably. Plugs for the immature lettuce were drilled at Kunia Country Farms LLC, and row space was measured 20 cm from the center.
Water flow was controlled through a “downhill” drainpipe slightly below the desired water level and proper circulation. For optimum water level control, a 5 cm fill pipe was used to fill and a larger 7.6 cm drainpipe to drain. In commercial systems, two are recommended, a primary and a backup, but our hydroponic plumbing system has been set up with shut-off valves. Bubblers from Pentair were purchased and installed every 3 m to ensure dissolved oxygen was at ~6%. Water was sterilized periodically for pathogens using a BIGboy UV Sterilizer Kit purchased from Hydrologic. An AutoGrow Intelliflo nutrient dosing system was purchased to inject liquid fertilizer directly into the water and monitor pH and EC. Since rainwater is typically acidic, a pH buffer is recommended; oyster shells (calcium carbonate) were used as a pH corrector.
2.3 Lettuce Germination, Transplanting, and Harvest
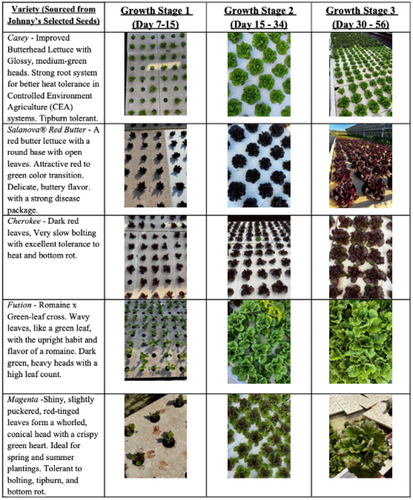
Coated seeds were sown and germinated into Black Gold Just Coir coconut media (Sun Gro Horticulture, Agawan, MA) in nursery troughs. Plastic hydroponic cups were filled and packed with coconut coir, and each block was labeled with the date sown and variety. Germination rates were ~90%, but to achieve these ideal conditions, must be met with water and sunlight and protection from pests and additional rainfall. To ensure we had enough plants to fill the blocks, we sowed 500 plants per 360-plant block. Plants were transplanted into the Styrofoam floats in the open sun troughs once they had 2–4 mature true leaves. During development, growth was categorized into 3 growth stages: establishment, rapid growth, and maturation. Establishment was categorized as an emergence of the third true leaf. The rapid growth phase was categorized as the head beginning to form and reaching 50% of head size. The maturation stage was categorized as a mature head ready to harvest, and each cultivar developed at roughly the same rate (Figure 2).
2.4 Variety Trial Experimental Design and Analysis
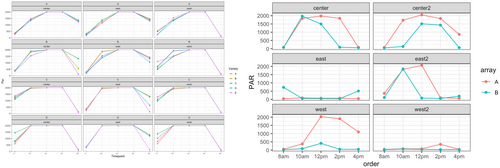
We conducted a randomized complete block lettuce variety trial where we examined the yield and economic profitability of five lettuce varieties (Casey, Fusion, Magenta, Cherokee, and Salanova Hydroponic Red Butter) with troughs as the blocking variable. We repeated the trial twice (July 2022 and October 2022), and we used light interception (PAR) as a covariate to adjust for the temporal differences in production (Figure 3). However, PAR and trial replicates (i.e., time) were insignificant in the final model. So, the final mixed linear model only included variety as the fixed effect of variety and block (i.e., trough) as the random effect. We determined differences in marketable yields between varieties using the Tukey HSD multiple comparison test of least square means.
2.5 Financial Analysis
We constructed an enterprise budget using 2021 US dollars for the economic analysis. Prices experienced a steep increase since 2019 due to the COVID-19 global pandemic, resulting in relatively high construction costs. We determined capital costs directly from the construction budget; these costs were taken directly from lumber yards (Home Depot and Lowes LLC), construction supply companies (White Cap LLC), local distributors (Ag Tech), local transportation (Penske LLC), local heavy machinery operation (Allied Machinery Corp), and shipping supplies from the continental USA.
We determined variable costs (irrigation, electricity, labor) using empirical estimates from the site. Irrigation costs were not considered as water was provided in kind by a commercial partner. Electricity needs and costs were determined by the monthly power usage of the water pump, UV filter, and air pump in kilowatt hours. We calculated labor using Hawaiʻi Agriculture Research Center's hourly rate for a research technician staff in 2021, which was USD 20 per hour, which is the starting rate for most full-time agricultural staff around the state. We recorded labor time throughout the project in total labor hours required to complete the task regardless of the number of people who completed the task.
We determined revenue by surveying local farmers markets (Ward Farmers Market, Kakaako, and Kailua) and grocery chains (Foodland Farms, Whole Foods, Safeway, and Times) to find the range of prices for the different lettuce varieties that were grown. These prices were then used to determine the return on investment from the yield of each variety. We did not explore the value of electricity because electricity by itself is profitable at the scale of our commercial partners' operations. The impetus for studying the profitability of the farming system was to determine whether rezoning “industrial” land to “agricultural” would offset initial losses due to capital cost. Net revenue was calculated using the eight cycles of lettuce produced during the experiment and duplicated to represent a full-year cycle.
3 Results and Discussion
3.1 Variety Performance
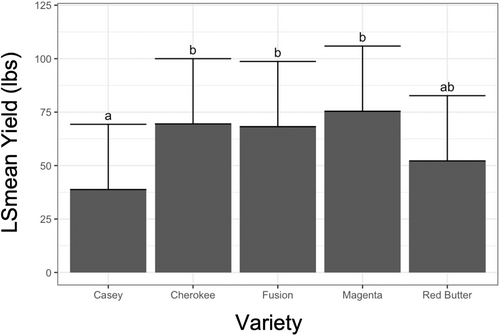
Overall, we found that the highest-yielding varieties were Cherokee, Fusion, and Magenta, whereas Casey had the lowest yield. During establishment (Growth Stage 1), the cultivar “Fusion” showed better vigor than the others, exemplified by the characteristic of larger, fuller leaves and faster development (Figure 2). However, production differed based on the physical position (east vs. west) within the site for the various varieties, which impacted total and marketable yield, thus altering potential profitability (Figure 4; Table 1). The east side of the trough had a higher marketable yield than the west side, indicating that the light intensity for lettuce might be too high even with the reduced overall solar radiation due to the shadow of the solar panels (Figure 3). Most of the non-marketable yield was made up of lettuce with tip burn. After transplanting, the green leaf varieties had a higher die-off rate than the red leaf varieties. In this experiment, we observed a differential response to solar radiation among varieties, that different varieties or species would be optimal in different solar radiation environments (Figure 3). Monitoring microclimate variation can help the optimization process; for example, lettuce crops grown in AV conditions typically yield 81%–99% of the full-sun controls (Marrou et al. 2013). Farm yields are very dependent on solar system architecture, photosynthetically active radiation (PAR) available, appropriate water availability (e.g., irrigation) and cultivar choice (Miller et al. 2020; Abidin et al. 2021; Majid et al. 2021).
| Estimated production costs of a 1 acre hydroponic agrivoltaic system | For 12 troughs of standard green leaf lettuce variety | For 12 troughs for the high-value red butter lettuce variety | 7 cycles of standard green leaf lettuce which represents a full year of production for the 1 acre site | 7 cycles high-value red butter which represents a full year of production for the 1 acre site | 21 cycles of standard green leaf lettuce which represents 3 full years of production for the 1 acre site | 21 cycles high-value red butter which represents 3 full years of production for the 1 acre site |
|---|---|---|---|---|---|---|
| Yield | 8088 (lbs/acre) | 21,600 (total heads) | 56,616 (lbs/acre) | 151,200 (total heads) | 169, 848 (lbs/acre) | 453,600 (total heads) |
| Marketable yield (pounds/acre) | 7301 (lbs/acre) | 21,600 (total heads) | 51,107 | 151,200 (total heads) | 169, 848 (lbs/acre) | 453,600 (total heads) |
| Wholesale price | $2.85 ($/pound of lettuce) | $3.00 ($/head of lettuce) | $2.85 ($/pound of lettuce) | $3.00 ($/head of lettuce) | $2.85 ($/pound of lettuce) | $3.00 ($/head of lettuce) |
| Total revenue ($/acre) | $20,806.43 | $48,600.00 | $145,644.98 | $453,600.00 | $484,066.80 | $1,360,800 |
| Operating costs | ||||||
| Fertilizer | $1050.00 | $1050.00 | $7350.00 | $7350.00 | $22,050.00 | $22,050.00 |
| Sanitizer | $1178.82 | $1178.82 | $8251.74 | $8251.74 | $24,755.22 | $24,755.22 |
| Labor | $13,200.00 | $13,200.00 | $92,400.00 | $92,400.00 | $277,200.00 | $277,200.00 |
| Seed | $2985.00 | $2985.00 | $20,895.00 | $20,895.00 | $62,685.00 | $62,685.00 |
| Germination, watering, and hand labor | $2160.00 | $2160.00 | $15,120.00 | $15,120.00 | $45,360.00 | $45,360.00 |
| Baskets for lettuce | $3840.00 | $3840.00 | $3840.00 | $3840.00 | $11,520.00 | $11,520.00 |
| Just coir coconut media | $3288.00 | $3288.00 | $23,016.00 | $23,016.00 | $69,048.00 | $69,048.00 |
| Pick, haul, and pack | $7312.00 | $7312.00 | $51,184.00 | $51,184.00 | $153,552.00 | $153,552.00 |
| Total harvest and marketing cost | $7603.29 | $7603.29 | $53,223.03 | $53,223.03 | $159,669.09 | $159,669.09 |
| Total operating cost | $42,617.11 | $42,617.11 | $298,319.77 | $298,319.77 | $894,959.31 | $894,959.31 |
| Fixed costs | ||||||
| Trough construction supplies | $17,772.87 | $17,772.87 | $17,772.87 | $17,772.87 | $17,772.87 | $17,772.87 |
| Plumbing | $16,864.77 | $16,864.77 | $16,864.77 | $16,864.77 | $16,864.77 | $16,864.77 |
| P-Liner 2000 (food grade plastic) | $5017.50 | $5017.50 | $5017.50 | $5017.50 | $5017.50 | $5017.50 |
| Pentair sta-rite pump | $1218.55 | $1218.55 | $1218.55 | $1218.55 | $1218.55 | $1218.55 |
| Styrofoam floats | $15,282.39 | $15,282.39 | $15,282.39 | $15,282.39 | $15,282.39 | $15,282.39 |
| PV system | $2789.18 | $2789.18 | $2789.18 | $2789.18 | $2789.18 | $2789.18 |
| Total fixed cost | $24,307.62 | $24,307.62 | $24,307.62 | $24,307.62 | $24,307.62 | $24,307.62 |
| Total costs | $66,924.73 | $66,924.73 | $322,627.39 | $322,627.39 | $919,266.93 | $919,266.93 |
| Estimated profit | −$46,118.30 | −$18,324.73 | −$176,982.41 | $130,972.61 | −$435,200.13 | $441,533 |
- Note: Highlighted rows indicate summaries of different parts of the operation.
3.2 Understanding the Business Case for Small-Scale AV Production
Multiple challenges associated with setting up an AV farm affect the financial benefits of a small-scale system. The first significant challenge of setting up an AV farm was to modify the AV installation for hydroponic production, including construction costs, equipment costs, and operator time (Table 1). While each site will have different challenges, our site needed to construct off-grid power and level the field. For a large-scale commercial hydro or aquaponic footprint, infrastructure for powering the site should be considered before construction of the troughs and as part of the overall design. The second major challenge was to address water access; this access will differ depending on local considerations. For vegetable production, the proximity of germination facilities to the production areas is essential to improve logistics and reduce labor/transportation costs. The third challenge is to make sure there is synchronization between harvest and transplant schedules.
Our enterprise budget is based on a detailed accounting of fixed costs, operating costs, and potential market value generated, which revealed that red butter is a profitable system because of a combination of yield, market price, and similar cost of production (Table 1). In our revenue analysis, we found that more revenue was generated by the lower-yielding varieties (e.g., Red Butter) due to consumer preference leading to higher prices. This highlights the importance of selecting a variety that performs well within the AV system and the market.
When developing the system, the first hurdle was to have the capital for several fixed costs (e.g., construction, plumbing, pump, food grade plastic, Styrofoam Floats, PV System, storage baskets). These costs were substantial for any new enterprise due to the lag in creating profitable crops. Next are the operating costs (e.g., fertilizer, sanitation, labor, seed germination, just Coir coconut media), particularly the additional steps of sanitation and germination, which increase operating costs. Also, there was increased waste in the initial cycles due to the need to develop skills among the wokforce. We see that profitability significantly increased in Year 3 compared to Year 1. By Year 3 (21 cycles of planting and harvesting), it was generally possible to generate profits. However, not unexpectedly, the farming operation itself was not initially profitable. Yet, if only the most profitable lettuce variety were used, the system could be profitable over more growing cycles (Table 1).
The efficiency of AV technology is highly dependent on solar PV architecture and agronomic management (Weselek et al. 2019). The system in our test farm is not the most efficient. For example, reusing the coconut coir media, reducing labor costs, and increasing harvest efficiency could improve the operation. Maximum crop efficiency would require wider row spacing to increase the solar radiation to crops, increase the panel height, use tracking panels, or facilitate the use of traditional agricultural machinery (Proctor et al. 2021). Our small-scale pilot has illuminated inefficiencies that could be optimized for small growers.
A limitation of the current study is that water was not included in the enterprise budget (Table 1), but this is an additional cost for aquaponic and hydroponic systems. It was not included because its charge was not accrued during the project, so we could not access the real cost data. Currently, the cost of water is $0.315 per 1000 gal of irrigation water (HDOA, Water Pricing Report). Water use for the hydroponics installed in Mililani was the initial upfront cost of filling the troughs 32,000 gal for all four (~8000 gal per trough), with an estimated 4000 gal needed every 6 months, depending on the loss from production. The specifics of the system were modified to fit the needs of the site and, more generally, sites in Hawaiʻi.
3.3 Picking the Right Site (Right System, Right Place, Right Crop, Right Price)
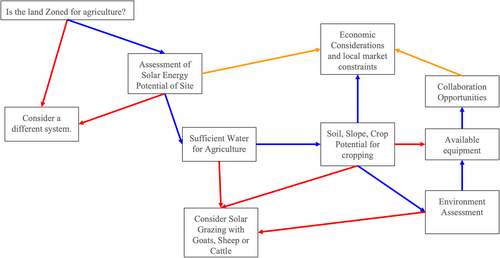
In building the system, there were unforeseen limitations due to land choice. For example, since the solar panels were already in place, there were equipment limitations that could be used to create the hybrid system, which led to project delays (Figure 1c). Next, initial blueprints (Figure 1b) had all the necessary “elements”, but did not consider the logistics of the site, such as machinery accessibility, water availability or power availability (Figure 1c). Pump operation, fertilization, and sterilization requires a substantial amount of power to continuously run the system. The issues associated with engineering the site led to a modified list of requirements (Table 1); it is crucial to match the type of agriculture with the appropriate soil type, moisture regime, land gradient, and water accessibility to maximize its agronomic performance and reduce its environmental impact (Williams et al. 2025). This alignment becomes even more essential when considering co-locating agriculture within a megawatt-scale PV system, with additional considerations for the energy production potential, zoning restrictions, capital requirements, and post-harvest processing facilities. The decision process is complex requiring foresight to facilitate opportunities between power utilities and agriculture systems (Figure 5). The nuance of site-specific constraints requires policymakers be consulted at key decision points to maximize the chances of success (Figure 5). While there are many paths forward presented in Figure 5, often the most significant impediment is the capital investment, this generally requires developing open collaborations and co-location, potentially opening opportunities across scale to diversify farming.
3.4 Broader Considerations of Dual-Use
Creating synergy between the energy and food sectors requires bring together many disparate stakeholders (Sirnik et al. 2023). The logistical requirements differ between the sectors, resulting in leverage points for creating profitable enterprises (Huber et al. 2017). Despite this, there are areas of collaboration such as finding ways to work understand the limitations of local zoning code and land costs to create the duel-use opportunities (Semeraro et al. 2022; Sirnik et al. 2023). Such opportunities include tax policy, for example in some places tax offsets occur when switching from “industrial” to “agricultural” (i.e., decreasing land cost). If this is included in operation costs, it will increase PV farm profitability significantly. This savings cost could then be passed along to new farmers to reduce overhead costs (e.g., free or significantly reduced land rental) and/or subsidize water costs. Reducing overhead in this way would allow farms to exist longer, ideally long enough to optimize production and become more profitable which takes several growing cycles (Table 1). Specifically, the time it takes to make the agricultural system profitable could be subsidized by the cost breaks associated with energy production, eventually creating a more resilient system than either alone.
4 Conclusion
Climate change is an increasing threat and there is great interest in creating dual-use landscapes (Mora et al. 2018; Fu et al. 2023). Agrivoltaics offers a synergistic solution, addressing the need for renewable energy and the equally vital need for sustainable local food. Optimizing the “System × Market × Variety” interaction will be fundamental to commercially successful endeavors. The use of aquaponics systems with the addition of fish as a secondary source of revenue could also increase the system's efficiency and perennial crops planted directly under the panels where troughs could not be installed. AV systems create an opportunity to entice more laborers to farm, where working underneath the panels has been shown to have a health benefit due to the increased shade, lowering average body temperature throughout the workday (Lucas et al. 2022). Long-term planning (e.g., long-term leases of 5–25 years) is essential for larger-scale operations to invest capital into their business. While this study focuses primarily on hydroponic lettuce, future studies could look more into commercial in-ground crops and the impacts of the augmented light from the panels on crop efficiency, production, and how the microclimate could be used to grow crops that might not otherwise be available.
Author Contributions
J.B.: conceptualization, formal analysis, experimentation, writing and reviewing; T.M.M.: formal analysis, writing and reviewing; M.C.: formal analysis, writing and reviewing; N.C.: writing and reviewing; S.A.L.: writing and reviewing; S.A.L.: writing and reviewing; M.K.: formal analysis, writing and reviewing.
Acknowledgments
The authors would like to thank the Hawaiʻi Agriculture Research Center (HARC) for Juli Burden's Sustainable Agriculture Fellowship.
Conflicts of Interest
The authors declare no conflicts of interest.
Endnotes
Open Research
Data Availability Statement
The data that support the findings of this study are available on request from the corresponding author.


