Underpinnings of Multiscale Interactions and Heterogeneities in Li-Ion Batteries: Electrode Microstructure to Cell Format
Abstract
Lithium-ion batteries exhibit a coupled set of electrochemical, thermal, and mechanical interactions ranging over different length scales. Microstructure-scale electrode characteristics govern the intrinsic and kinetic processes and lead to distinct signatures in electrochemical performance and degradation (e.g., lithium plating). Accurate prediction of cell response relies on advanced physics-based models that can analyze the spatial heterogeneity in pore-scale and electrode-scale features. Herein, a hierarchical modeling framework that captures the mechanistic interactions stemming from electrode microstructure and systematically connects this to the lithium-ion pouch cell performance/degradation response is developed. In conjunction with the microstructural arrangement, the roles of cell format on spatiotemporal heterogeneity in intercalation/plating dynamics, internal heat generation, and mechanical stresses across the pouch cell that are important aspects for fast charging are analyzed. Based on the cell design and operating conditions, unique attributes with respect to the location of plating onset, presence of thermal/mechanical hotspots, and the manifestation of temperature gradients across the pouch cell. are delineated. This study provides a mechanistic understanding of the multiscale interactions and heterogeneity underlying the electrochemical–thermal–mechanical response of lithium-ion batteries, critical for operational extremes such as fast charging.
1 Introduction
The rapid advancement of lithium-ion batteries (LIBs) has been beneficial for the improved performance of portable electronics and electrical vehicles.[ 1 ] LIBs are complex systems exhibiting coupled multiphysics interactions that govern their electrochemical performance, thermal response, plating behavior, aging characteristics, etc. The spatiotemporal dynamics underlying these coupled processes that manifest during LIB operation can be challenging to determine and analyze experimentally. A robust electrochemical–thermal–mechanical computational framework to predict the multiphysics interactions in LIBs is required.[ 2 ] Traditionally, modeling techniques like single-particle model (SPM)[ 3 ] and pseudo-P2D macrohomogeneous models[ 4-6 ] are employed to predict the performance and degradation of LIBs. A detailed review of these techniques was presented by Jokar et al.[ 7 ] In particular, the macrohomogenous P2D model, based on porous electrode theory, is a preferred prediction tool for cell sandwich configurations due to its superior computational efficiency. The P2D[ 5 ] model predicts the performance of LIBs by considering the electrode averaged material properties. However, despite the satisfactory prediction of various cell characteristics by P2D models, analysis of complex multiscale interactions in large-format LIBs requires the development of more advanced physics-based modeling frameworks.
A robust computational framework is critical toward resolving the coupled multiphysics (electrochemical–thermal–mechanical) processes at different length scales (particle, electrode, and cell). The multiscale multidimensional (MSMD) model provides an efficient framework for this purpose.[ 8-18 ] The pioneering work in this context by Kim et al.[ 8 ] accounts for the multiphysics phenomena at various length scales while considering segregated computational domains. Following the MSMD strategy, Lee et al.[ 12 ] employed a subvariant of the MSMD model to investigate the behavior of cylindrical wound cells based on the wound potential–pair continuum model (WPPC). Despite the excellent prediction accuracy achieved by MSMD models, they are computationally expensive. Therefore, various modifications of MSMD[ 18-22 ] have been developed to obtain faster predictions at the cost of accuracy and are categorized as reduced-order models (ROM).[ 10, 11, 23 ] In this context, Guo et al.[ 10, 11 ] proposed a reduced-order MSMD (RO-MSMD) model, using the macrohomogenous (P2D) approach to solve the electrochemical and thermal response in a decoupled manner. The RO-MSMD model achieves good accuracy for multiphysics predictions and reduces significant computational time. Later, Kim et al.[ 23 ] optimized their elementary MSMD model to further reduce the computational time by solving the potential fields at different length scales.
Analytical and experimental[ 24 ] methods have been effectively used for probing the coupled electrochemical–thermal behavior of pouch cells.[ 15, 17, 18, 20, 21, 25-31 ] Yazdanpour et al.[ 20 ] used an analytical approach to investigate the thermoelectrochemical behavior in the pouch cell format and observed the role of localized ohmic heating on nonuniformity in temperatures within the cell. Goutam et al.[ 25 ] experimentally determined the surface temperature of commercial pouch cells using IR thermography and contact thermistors. It was found that a combination of material properties, cell geometry, and loading conditions is responsible for nonuniform temperature distribution. Experimentally informed computational models provide a robust framework for predicting the myriad multiphysics interactions within the cell. In this regard, Wu et al.[ 15 ] used a multidimensional electrochemical–thermal model to understand the mechanisms behind nonuniform temperature distribution and the increase in internal temperatures. Input parameters such as the contact resistance between the tab and cable were experimentally determined for the simulation. According to their calculations, heat flux near the tab is the major contributor to nonuniform temperature distribution rather than the heat generation within the cell.
Tabs play an important role in inducing heterogeneous behavior[ 32 ] within LIBs due to the high local current density[ 33 ] and enhanced heat generation near this region.[ 27, 34, 35 ] The large temperature and potential gradients that manifest within the battery critically affect the intercalation and plating dynamics.[ 36 ] Additionally, aspects such as maximum temperature rise and internal thermal variation are also governed by the specific heat capacity and in-plane thermal conductivity. It is essential to study the nonuniform thermal effects[ 27 ] to avoid localized degradation and thermal runaway scenarios[ 37, 38 ] and eventually achieve an optimal balance between battery performance and life. The thermal management system (TMS) is incorporated with the pouch cell battery pack to maintain a standard range of temperatures. However, the use of TMS can cause temperature nonuniformity due to the significant difference in conductivities of the TMS and battery pack.[ 39 ] Klein et al.[ 27 ] focused on the effect of in-plane thermal nonuniformity on the performance of the pouch cell LIBs, subjected to different temperature gradients at various ambient conditions. Fear et al.[ 40 ] discussed the negative implications (plating) of various thermal gradient scenarios within a lithium-ion cell, providing a mechanistic explanation to the experimental observations of Carter et al.[ 41 ]. Rieger et al.[ 16 ] investigated the effect of the temperature and location of tabs on the mechanical behavior of pouch cell LIBs using the MSMD approach. During discharge, tab location was found to broadly alter stress distributions within the positive electrode compared with the negative electrode. Overall, given the various modes of multiphysics interactions, it is imperative to understand the inherent heterogeneities associated with large-format pouch cells.
Physics-based prediction of large-format lithium-ion battery performance requires simultaneously resolving the mechanistic interactions occurring at various scales. Unfortunately, while most models perform well at a given length scale, gaining a comprehensive picture of the mechanisms occurring over different length scales remains a challenge. For example, macrohomogeneous models[ 4-6 ] assume uniform electrode properties and a lumped system for thermal behavior predictions. Several developments have been made to the seminal macrohomogeneous models including incorporating different aspects of electrode microstructure[ 42 ] such as spatial heterogeneity,[ 43, 44 ] mechanical degradation,[ 45 ] etc. However, further advancement is required for coupling the mesoscale interactions with underlying multiscale performance and safety interactions in larger-scale formats such as pouch cells.
Pore-scale resolved models[ 46-48 ] perform direct numerical simulations over the electrode architecture to capture the variation in cell performance due to particle morphology, size, etc. However, for analyzing the electrochemical performance of pouch cells, this may potentially include a considerably large computational cost. State-of-the-art macroscale pouch cell models combine the thermal distribution profiles on a pouch cell scale (using macroscale simulations) with an electrochemical model (macrohomogenous, equivalent circuit, etc.). However, the primary limitation of these models is the inability to capture the influence of variability due to electrode microstructure. Furthermore, the use of Bruggeman's[ 49, 50 ] expression for transport property estimation in physics-based models reduces the accuracy in the description of realistic electrode architectures.[ 51 ] In this context, it is noted that graphite electrodes with different electrode morphologies show a significant difference in thermoelectrochemical response due to the anisotropy in electrode properties.[ 52 ] Variations in electrode microstructure alter the inherent transport–kinetic interactions and lead to unique response signatures concerning electrochemical–thermal performance and Li plating, which are critical considerations for applications such as fast charging[ 53-55 ] and low-temperature operation.[ 56 ] A major challenge with macroscale models is translating the pore-scale attributes of coupled electrochemical–thermal–mechanical interactions for larger cell formats.
In this work, we develop a hierarchical modeling framework that captures the microstructure-coupled mechanistic interactions in Li-ion battery electrodes and systematically connect this to the thermoelectrochemical performance of the pouch cell. In addition to the electrode microstructure, the effect of cell format on the spatiotemporal evolution and heterogeneity in the intercalation/plating dynamics, thermoelectrochemical, and mechanical response of the electrodes has been analyzed. A detailed description of the computational framework and workflow has been presented in the subsequent section.
2 Model Description
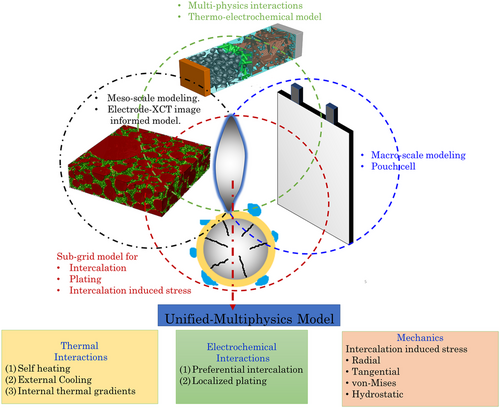
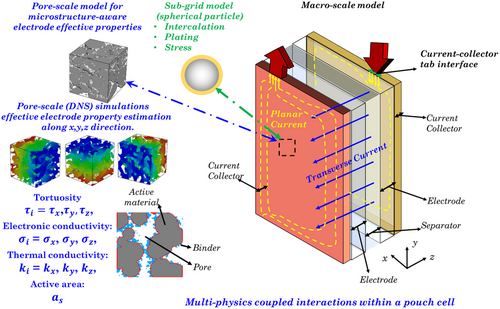
Figure 1 depicts an overview of the proposed modeling framework for the pouch cell. Here, graphite is the anode, Li(Ni0.33Mn0.33Co0.33)O2 is the cathode, and LiPF6 is the electrolyte with propylene carbonate (PC)/ethylene carbonate (EC)/dimethyl carbonate (DMC) as the solvents. The modeling framework encompasses a pore-scale model for effective electrode property estimation, while the macroscale model uses the electrode properties to predict the heterogeneous coupled thermoelectrochemical response. A subgrid model based on spherical active particles within each macrocontrol volume captures the influence of heterogeneous thermal fields on intercalation dynamics within the pouch cell. The subgrid model also captures the spatiotemporal dynamics of lithium plating within the pouch cell using a physics-based electrodeposition description.[ 57 ] We use the concept of intercalation-induced stress within a spherical active particle (subgrid model) and systematically translate it to predict the localized stress distribution within a pouch cell. Finally, the pouch cell model (Figure 2 ) demonstrates the multiphysics prediction capabilities and incorporation of heterogeneity at scales. Integrating multiscale features in LIB models is vital as the stochastic nature of electrodes[ 51 ] and variability due to cell architecture[ 33, 34 ] (form-factor, tab design) significantly influence performance and degradation. The present pouch cell model comprehensively captures the coupled electrochemical, thermal, and mechanical characteristics using different submodels to capture the intrinsic heterogeneity at different scales. The submodels based on the different length scales of analysis have been categorized and developed as follows. 1) image-based pore-scale model and analysis for electrode property estimation (tortuosity for ionic transport, active interfacial area, and effective electronic conductivity); ; 2) subgrid model for predicting variability in intercalation, lithium deposition, and mechanical stress; and; 3) macroscale model for prediction of electrochemical performance of the pouch cell.
2.1 Pore-Scale Modeling and Effective Electrode Property Analysis
This method evaluates the values of electronic and thermal conductivity for the positive and negative electrodes. The values of electronic and thermal properties for the current collectors are adopted from the previous studies.[ 59 ] Due to the presence of multiple components in the battery design, differences in the electrode properties at the electrode–current collector and the electrode–separator interface can be observed. Therefore, the present finite-volume-method-based model evaluates the interface properties using harmonic averaging. Summary of the cell component properties used for the current study is provided in Table S2, Supporting Information.
Here, is the number of common faces between active–material–pore. represents the electrode domain size in voxels, and 4π gives the surface area of the sphere. The model assumes a digitized sphere with radius r = Nζ with number of faces to compute its surface area. Here, ζ represents the smallest voxel size (ζ = 325 nm). We use a value of f = 0.05 from the calibration curve described in Mistry et al.[ 51 ] to calculate the radius of the digitized sphere using the expression f =
2.2 Subgrid Model for Electrochemical–Mechanical Interactions
We employ a subgrid model to simulate the intercalation, lithium electrodeposition, and stress generation for the active particle. We use the subgrid model at each control volume of the pouch cell to reflect the influence of thermal heterogeneity at a macroscale on the coupled electrochemical–mechanical interactions.
The modeling framework enables us to identify the localized regions within the negative electrode, which experience plating currents. We also compute the local film thickness evolution by considering the influence of local plating current using Equation (24).
Here, , , denote the radial, tangential, and hydrostatic components of stresses, respectively. Von-Mises stress is defined as the difference between radial and tangential stress.
We note that particle-level strain will have a further effect on the solid-volume fraction and the active surface area. In the present study, this effect of particle-level strain has not been considered. We also note that the coupling of stress to the reaction kinetics at the electrode–electrolyte interface is not considered in this framework.[ 65, 66 ] and will be taken up in the future studies.
2.3 Macroscale Model for Thermoelectrochemical Cell Response
We simulate the coupled thermoelectrochemical interactions within a single-layer 3D pouch cell (anode–separator–cathode), including the current collectors within the computational domain. Mesoscale modeling provides effective electrode properties to solve the conservation of charge and species within the 3D pouch cell domain, as shown in Figure 2 using the finite volume method.[ 43 ] The governing equations for the macroscale model are discussed in this section; the boundary conditions have been presented in Table S1, Supporting Information.
Here, a s is the local specific surface area within the electrode control volume, the subscript l denotes the positive electrode, negative electrode, and separator. The value of volumetric current density is specified as zero at the separator. The governing equations are solved in three dimensions while considering the influence of tortuous anisotropy within the electrodes ( = , , ).
Here represents the unit outward normal, is the electronic conductivity of the current collector, and is the value of current density at the tab/current collector interface.
The present model also considers the heat generation at the tabs and is a function of ohmic heating and heating due to contact resistance, as shown in Equation (42). Here is the local current density at the junction of current collector and tab while is the resistivity of the current collecting tabs with values of 2.8 × Ωm at the positive end while at the negative end, the resistivity values are defined as 1.7 × Ωm.
The values of thermophysical properties used in the present study are tabulated in Table S2, Supporting Information; electrode properties such as thermal conductivity are obtained from pore-scale simulations, while the rest of the properties are obtained using weighted volume averaging of respective fractions. The basic cell fabrication parameters and electrode/electrolyte properties are tabulated in Table S2, S3, Supporting Information. The present study uses a convective heat transfer coefficient of 5 W/ for simulating the heat dissipation to the environment.
Here, is the active-material volume within the electrode and and are the average intercalated lithium-ion concentration at the beginning 0% and end of charging 100% SOC. The end of the charging is determined by a cutoff voltage specified as 4.2 V.
The computational domain used in the present study is depicted in Figure S1, Supporting Information. The domain comprises a single-layer pouch cell with domains of the anode, separator, and cathode. The anode and cathode are present over a copper and aluminum current collector, respectively. The pouch cell has a height of 192 mm, while the width of the cell is 145 mm. Additionally, there are two tabs located on the current collectors. The tabs are 45 mm in width, and the thickness of the tabs is equal to the thickness of the current collectors specified as 10 mm. The influence of thermal contact resistance at the tabs is captured based on the heating (due to contact resistance) condition at the tab–current collector interface. Additionally, the cell experiences convective cooling, with a heat transfer coefficient of h = 5 W .
The coupled partial differential equations are solved implicitly using an open-source library, Lis.[ 67 ] We employ Incomplete LU factorization (ilu) preconditioner with biconjugate gradient stabilized method (bicg) solver for solving the governing equations for the conservation of charge, mass, and energy. While our computational framework employs [ 1 ] Library of Iterative Solvers for linear systems (Lis), which is a parallel software library to solve the coupled governing equations, we acknowledge that the computational speed can be lower than the commercial/MSMD solvers. We note that the main objective of the study is to develop a modeling framework that can capture the pouch cell response, cognizant of the underlying electrode microstructure–coupled interactions such as thermoelectrochemical coupling and Li plating response. The governing equations for the macrohomogenous intercalation/plating reaction, temperature response, and mechanical stress have been proposed in prior literature[ 5, 51, 56, 60-63 ]; the key novelty of our current work is establishing a hierarchical analysis approach spanning the role of electrode microstructure and cell design on the manifestation of heterogeneities in thermal profile, plating severity, mechanical stress distribution, and resulting pouch cell performance.
In contrast to the MSMD approaches that solve the electrochemical and thermal equations in different mesh domains, we solve both these coupled governing equations in the same mesh domain. While this results in additional computational cost, this approach is important to delineate the underlying thermoelectrochemical interaction that manifests as thermal gradients, heterogeneity in intercalation/plating dynamics, and resulting cell performance.
2.4 Validation of the Model
The results from the physics-based modeling framework have been validated with benchmark data available in literature. Figure S2a,b, Supporting Information, depicts the validation of charging and discharging performance at different current rates.[ 68 ] Additionally, we also validate the temperature rise (Figure S2d, Supporting Information)[ 25 ] and thickness of the plated lithium (Figure S2c, Supporting Information)[ 60 ] with previous studies. The validation of intercalation-induced stresses (radial, tangential, and von Mises)[ 62 ] within the spherical active particle is shown in Figure S3, Supporting Information.
2.5 Grid Independence
Table S4, Supporting Information shows the grid independence analysis for the LIB charged at 4C rate with an initial temperature of 303 K. The mesh along the x and y direction is sequentially changed from 10 × 10 to 160 × 160, while the thickness direction (z-direction) mesh is changed from (4, 2, 4) to (10, 4, 10) to discretize the anode, separator, and cathode domains. Convergence in the grid sensitivity is observed at an 80 × 80 grid along the x–y plane direction and a (10, 4, 10) grid for the anode, separator, and cathode along the thickness direction. This grid specification has been chosen for the analysis in this study. Additionally, the current collector domain corresponding to the anode and cathode has two grid points along the thickness direction.
3 Results and Discussions
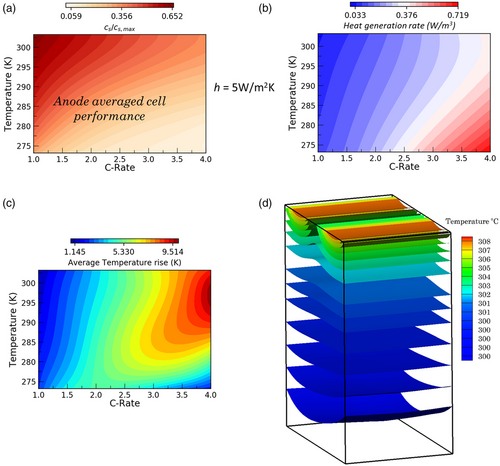
Figure 3a–c depicts the overall electrochemical and thermal characteristics exhibited by the pouch cell toward the end of the charging operation at various ambient conditions (273–313 K) and charging rates (1C–4C). The role of thermoelectrochemical interaction and the spatiotemporal evolution of lithium plating are critical considerations for operational extremes such as low temperature and fast charging applications. As shown in Figure 3a, the electrode-averaged intercalation levels of the active material (graphite) particles show a significant decrease with the rise in C-rates and reduction in temperature. Due to the sluggish reaction and transport kinetics during low-temperature operation and increased transport overpotential at higher C-rates, the internal cell resistance increases and results in a considerable reduction of electrode utilization levels. By the end of charging, larger internal resistances manifest at high C-rates and low temperatures that restrict the complete utilization of the electrode material. As shown in Figure 3b, cell-averaged heat generation rates increase monotonically with C-rates and reach maximum values during low-temperature operation. However, the maximum rise in pouch-cell average temperature occurs during room-temperature operations of the pouch cell at higher C-rates, owing to amplified ohmic heat generation rates, as shown in Figure 3c. Despite the large ohmic heat rates at low temperatures, due to the limited duration of cell operation before reaching the cutoff voltage of 4.2 V, the average rise in cell temperatures is predominantly lower when compared with the performance at room temperature. Figure 3d presents the 3D isotherms within the pouch cell (the aspect ratio is adjusted to depict the variations along the thickness direction, i.e., anode–separator–cathode cell sandwich) at operating conditions of 298 K and 4C. As shown here, maximum temperatures occur near the tab regions due to localized higher ohmic heating and subsequently decay along the thickness of the cell. Thus, we infer that a thermal gradient of around 8 K manifests across the thickness direction of the pouch cell.
Following the electrode-averaged electrochemical and thermal performance analysis, we study the in-plane variations in reaction current density, electrode utilization, internal heat generation, and temperature across the pouch cell. Cell performance is analyzed at three different instances of electrochemical operation––that correspond to cell voltages of 2.8 V (the initial stage of charge), 3.5 V (mid of charge), and 4.2 V (toward the end of charge), for an ambient temperature of 20 °C and a charging current of 3C. We observe key differences in electrochemical and thermal performance characteristics across the in-plane direction of the pouch cell at the beginning and end of the charging operation. The profiles in Figure 4a–l have been plotted at the midplane cross section of the pouch cell at the anode–separator interface. As shown in Figure 4a,b, maximum magnitudes of reaction current and particle-level SOC due to intercalation are observed near the tab regions. Since high current density is imposed at the current collector–tab interface (due to cell architecture design), electrochemical reactions tend to occur at the vicinity of the tabs preferentially. Subsequently, the transverse flow of ionic current through the thickness direction of the pouch cell is responsible for similar trends to manifest at the midplane cross section of the pouch cell. The larger magnitudes of electrochemical reactions also result in significant heat generation near the tabs. As shown in Figure 4c,d, higher heat generation and temperature magnitudes have been observed at the top. Similar trends in reaction current density and thermal response are observed at the middle of charging, as shown in Figure 4e–h. As observed during the beginning of the charge, maximum magnitudes of reaction current and temperature are found in the vicinity of the tabs. However, once the active material gets preferentially intercalated (almost reaching a particle-level SOC of 1) near the tabs, electrochemical reactions tend to get distributed at regions away from them. This phenomenon is captured in Figure 4i,j, which depicts the electrochemical reaction response toward the end of the charge. Since tab regions are almost entirely lithiated, the in-plane reaction current is focused more away from the tab regions shown in Figure 4i. This also dictates the distribution of heat generation that is more prominent in areas away from the tabs. As shown in Figure 4l, the maximum temperature is still located at the tab vicinity since the initially accumulated heat has not been entirely conducted away from them within the end of the charge. However, when compared to the middle of the charging process, it is to be noted that there is a slight decrease in the temperature near the tabs and a corresponding increase in temperatures away from them.
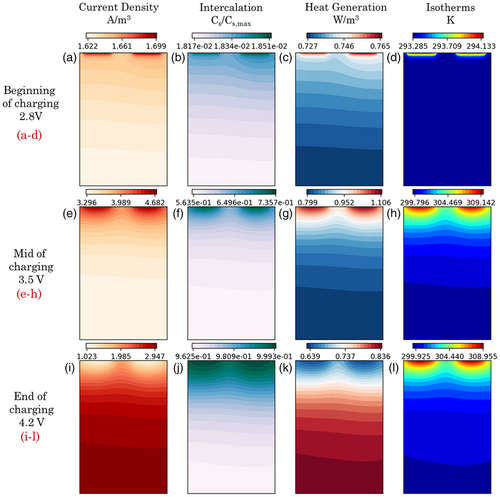
In summary, based on the simulation results in Figure 4, we identify a strong difference in the spatial distribution of reaction current/heat generation between the initial (a–d) and final stages (i–l) of charging.
In Figure 5a–c, the distribution of intercalation current densities, electrolyte concentration (C e), and Li concentration in the solid phase (C s) have been described along the thickness direction of the pouch cell at various charging rates (from 1C to 4C) at an ambient temperature of 20 °C. Positions along the thickness directions from 0–80, 80–100, and 100–180 μm correspond to the anode, separator, and cathode domains, respectively. Thickness direction variations of reaction current and electrolyte concentration profiles have been captured in response to the applied current. As shown in Figure 5a, reaction current density distribution gets highly nonhomogenized with an increase in the applied current rate, with a significant concentration near the separator region. Due to larger transport resistances at higher C-rates, local intercalation of the active material occurs near the anode–separator interface, which renders the regions close to the current collector relatively less utilized. In addition to the significant increase in reaction current close to the separator, an increase in the current rate from 1C to 4C significantly reduces the reaction current at regions away from the separator. This trend can be seen in Figure 5a, which shows how the degree of nonhomogeneity in reaction current increases with the applied current rate. These trends in reaction current are also in accordance with the Li concentration profile (in the active material) across the thickness direction, which is shown in Figure 5c. The active material gets fully lithiated close to the separator regions at all current rates while regions away from it remain less utilized. A nonlinear trend in ionic concentration is also established along the thickness direction in response to the applied current.
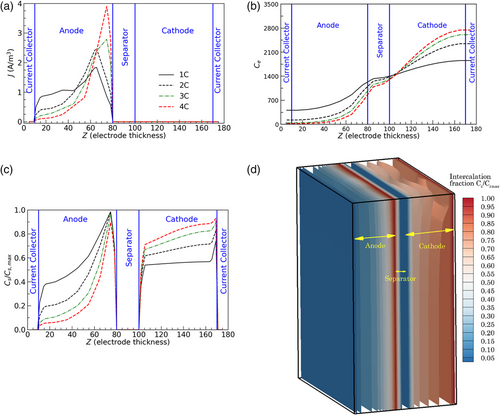
Figure 5d presents 3D contours of intercalation levels of the active material across the electrodes. It is observed that the predominant fraction of electrode utilization occurs near the anode–separator interface. Maximum delithiation and lithiation of the cathode and anode occur at the vicinity of their interfaces with the separator, respectively. As presented in Figure 5b, with an increase in current rates, a significant increase in electrolyte concentration is observed near the cathode, accompanied by a corresponding decline in the anode domain. As the current rates increase from 1C to 4C, bulk electrolyte polarization increases, leading to a more significant difference in electrolyte concentrations at the cathode–current collector and anode–current collector interfaces. Such mass transfer limitations get exaggerated at high charging current rates, leading to more considerable ohmic losses and a nonuniform active material utilization across the cell. We find that a more significant inhomogeneity is observed along the thickness direction upon comparing the electrochemical reaction distribution in the in-plane and thickness directions. However, subtle differences in reaction current and thermal profiles have been identified along the in-plane direction during the beginning and end of the charge. Limited electrolyte transport and nonuniform active material utilization in the thickness direction are significant challenges toward achieving optimal electrochemical performance at high charging rates.
Figure 6a–l analyzes the low-temperature charging characteristics of the pouch cell, with a major focus on the thermal profiles, lithium intercalation, plating current densities, and the lithium plating severity. Herein, cell performance is again studied at three different instances of operation, corresponding to voltages of 2.8, 3.5, and 4.2 V, for an ambient temperature of 0 °C and a charging current of 1C. As shown in Figure 6a,b, due to the enhanced reaction kinetics, maximum temperatures and interaction current densities are found at the vicinity of the tabs during the initial stage of charging. At this stage, there is no propensity for lithium plating across the in-plane direction of the cell, as depicted in Figure 6c,d. Lithium intercalation currents dominate over plating currents across all regions of the pouch cell in this regime.
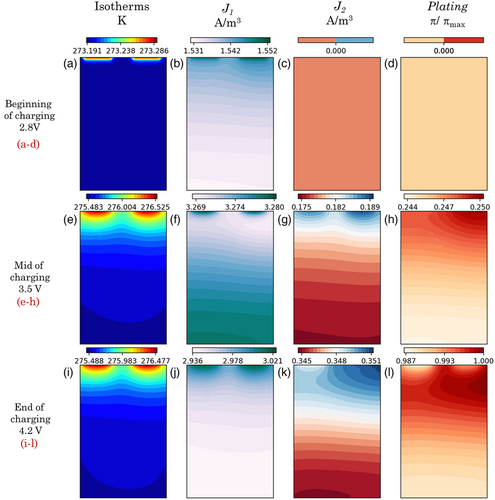
Interestingly, toward the middle of charging operation at such low temperatures ≈0 °C, there is a switch in the intercalation current distribution with major concentration away from the tab regions. However, thermal profiles remain qualitatively similar when compared to the initial stages of charging. Figure 6e,f shows the mapping of the thermal profile and intercalation current map toward the middle of the charging operation. This stage also marks the onset of lithium plating (see Figure 6g,h), which is observed to occur predominantly near the tab regions. The preferential intercalation that occurs near the tabs during the initial stages of low-temperature charging results in sluggish solid-state diffusion kinetics and causes the plating potential to drop below zero locally, inducing plating currents at later stages of charging. Compared with the charging state at a cell voltage of 3.5 V, the final charging stage exhibits similar thermal and lithium plating profiles with a significant concentration toward the tab regions. These temperature and dimensionless plating maps are depicted in Figure 6i,k–l, respectively. However, the fluctuations are minor in magnitude; the intercalation profiles toward the end of the charge show higher intensities near the tab regions.
In summary, it is to be noted that the nature of intercalation maps exhibits minor variations across the charging duration, with intensified reaction currents occurring both toward and away from the tabs at different stages of operation. However, the onset of lithium plating appears near the tab regions and consistently remains concentrated in their vicinity. Other regions of the cell along the in-plane direction also experience degradation due to lithium plating, although the severity is slightly lesser when compared with the severity at the tab vicinity.
Figure 7a summarizes the dimensionless plating severity that is observed across the thickness direction of the pouch cell at current rates from 1C to 4C at an ambient temperature of 0 °C. At 1C, lithium plating occurs up to a thickness of 30 μm from the separator; maximum plating is observed at the separator–anode interface and decays in severity as we move toward the anode–current collector interface (also illustrated in Figure 7d). However, as C-rate is increased above 1C, the sluggish electrolyte transport and reaction kinetics cannot sustain the high applied current and results in self-shutdown of the cell. Due to the enhanced ohmic and kinetic overpotentials within the cell at such high charge rates and low temperatures, cell voltage tends to reach the cutoff voltage at lower capacities. Hence, as shown in Figure 7a, plating severity is also found to be significantly reduced at current rates from 2C to 4C. Plating severity distributions that have been plotted here correspond to the end of the charging operation. Plating severity is summarized in Figure 7b in terms of an electrode-averaged metric for temperatures from 273 to 303 K and current rates from 1C to 4C. As shown here, maximum plating occurs at ambient temperatures from ≈ 0 to 10 °C and 1C due to the high durations of cell operation under severe transport and reaction-limited regimes. Upon inspection of the plating map, intensified plating is further observed with increased ambient temperature and C-rates. For ambient temperatures ≈25 °C, in most cases, this is during the later stages of charging when the active material particles are close to complete lithiation, and plating reactions tend to onset. As mentioned previously, self-shutdown occurs at low ambient temperatures and high current densities and consequently mitigates cell degradation due to lithium plating. Figure 7c) shows the electrolyte potential distribution with respect to the solid-phase potential across the cell thickness at current rates from 1C to 4C. It is noted that lithium plating is locally favored at regions where the electrolyte potential drops below the solid-phase potential and thereby results in the kinetic overpotential for plating reaction to being below zero.
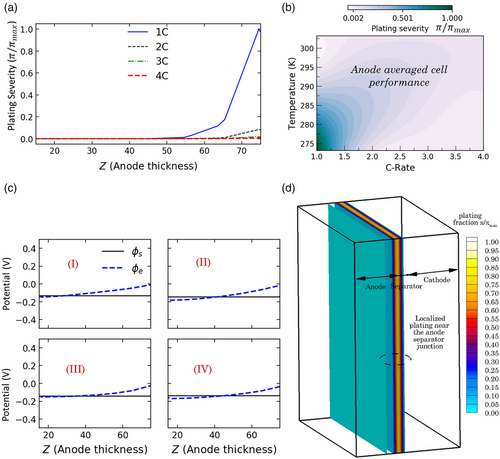
Figure 8a–f depicts the von Mises stress distribution at the electrode level and probes its interaction with the operating temperature and applied current. Here, positive magnitudes denote tensile stress regimes, while negative magnitudes denote compressive stresses. In the in-plane direction (at the anode–separator interface), as shown in Figure 8a,b, maximum stress magnitudes during the beginning and middle stages of charging (30 °C, 4C) occur near the tab regions. Since the tab regions experience higher current density, this induces more significant heat generation rates. Consequently, these regions experience enhanced kinetics due to higher temperature and preferential intercalation, which cause concentration gradients within the active particles and leads to higher stress. However, toward the end of charging (Figure 8c), this scenario is reversed, with the tab regions experiencing minimum stress levels and regions away from it experiencing maximum stress magnitudes. The primary reason for this observation is due to the complete lithiation near the tab region induced by the higher local temperature and improved kinetics. In contrast, regions away from tabs experience more significant gradients in concentration toward the later stages of charging. This also showcases the spatiotemporal thermal heterogeneity that can manifest within the pouch cell.
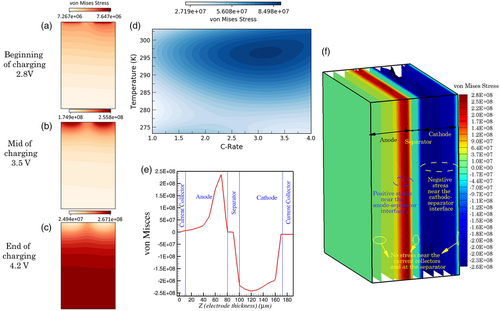
Along the thickness direction (Figure 8e), a sharp increase in compressive stress is observed close to the cathode–current collector interface; away from the current collector interface, the stress magnitudes remain relatively uniform across the cathode. However, at the vicinity of the separator–anode interface, a sharp increase in tensile stress manifests, after which the stress magnitudes significantly decay toward the current collector interface. 3D contours of particle-level von Mises stress are presented in Figure 8f, depicting the occurrence of maximum stress magnitudes near the anode–separator interface and minimum stress levels within the current collectors and separator. Figure 8d presents the anode-averaged von Mises stress magnitudes that manifest over a wide window of operating currents rates and temperatures. As observed here, maximum stress magnitudes occur around charge rates of 3–3.5C and an operating temperature of 295 K. Additionally, it is also inferred that a significant reduction in particle-level stresses occurs in the regimes of low-temperature operation and low C-rates (<1.5C).
4 Conclusion
This study presents a hierarchical modeling framework to comprehensively study the multiphysics interactions in pouch cells, capturing the influence of heterogeneity at different length scales. This framework mechanistically couples the pore-scale model to a macroscale model that captures the effect of cell architecture. The coupled set of partial differential equations is solved using Krylov Subspace methods (Lis[ 67 ] library). The spatiotemporal dynamics of lithium plating and intrinsic heat generation investigated in this study are critical aspects to consider for operational extremes such as fast charging. Major findings of the present work have been summarized below. 1) The pouch cells experience maximum local temperatures and ohmic heating rates near the tab regions. The internal cell temperature subsequently decays along the thickness of the cell and manifests in a thermal gradient across its ends. 2) Higher heating rates near the tabs alter the local rates of intercalation and plating. While the electrochemical–thermal maps illustrate localized heat generation and reactions in the tab vicinity at the beginning of charging, these preferential thermal/reaction regimes can potentially switch to regions away from the tabs at later stages of charging. 3) The onset of lithium plating occurs near the tab regions and remains consistently concentrated in the vicinity. Other regions of the cell along the in-plane direction also experience degradation due to lithium plating. However, the plating severity is found to be maximum near the tab vicinity. 4) When compared to the in-plane direction, a more significant inhomogeneity in intercalation/plating dynamics is observed along the thickness direction of the pouch cell. 5) A predominant fraction of electrode utilization occurs near the anode–separator interface. Maximum delithiation and lithiation of the cathode and anode during the charging process occur at the vicinity of their interfaces with the separator. Limited electrolyte transport and nonuniform active material utilization in the thickness direction are major challenges toward achieving high charging rates in pouch cells. 6) Along similar lines, maximum stress levels during charging are observed near the anode–separator (tensile) and cathode–separator (compressive) interface, while the current collector vicinity exhibits reduced mechanical stresses.
The developed electrochemical–thermal–mechanical modeling framework allows us to incorporate additional aspects such as aging behavior and thermal stability response. Building on the modeling framework presented in this work, our future work will study effect of mechanisms including thermal gradient and plating heterogeneity on the degradation-safety characteristics of Li-ion cells.
Acknowledgements
Financial support in part from the Office of Naval Research (ONR) grant N00014-18-1-2397 is gratefully acknowledged. P.P.M. would like to thank Dr. Michele Anderson from ONR for supporting this work.
Conflict of Interest
The authors declare no conflict of interest.
Open Research
Data Availability Statement
The data that support the findings of this study are available from the corresponding author upon reasonable request.


