Improving Wetting Behavior and C-Rate Capability of Lithium-Ion Batteries by Plasma Activation
Abstract
Atmospheric corona plasma activation was used at varied energy input levels to modify microsurfaces of cathodes and anodes, previous to assembly into lithium-ion batteries. Correlations of the plasma activation grade are evaluated considering electrode topography, crystal structure change, electrolyte wetting characteristics, as well as C–rate capability and cycling stability. This reveals upper limits for plasma modification, as well as direct dependencies of possible hydrophilicity changes on electrode composition. Deeper insights into electrochemical impacts are gained by the application of electrochemical impedance spectroscopy, showing changes in C–rate capability to arise from changes in the cathode crystal lattice.
1 Introduction
Climate change is part of today's most complex global challenges. Social efforts to achieve sustainable and CO2–neutral ways to provide mobility as well as for electrical energy production, induce ambitious challenges to energy storage. In the field of rechargeable batteries, the lithium–ion–battery (LIB) is today's most promising approach, to match all energy storage requirements of electric vehicles (mobile energy storage) as well as for grid stabilization (stationary energy storage). Since their first commercialization by Sanyo, Sony, and Matsuhita in the early 1990ies,[1] LIBs enabled a wide range of portable electronics. Nevertheless, LIBs still require further improvements in terms of energy density, power density, lifetime, safety, and cost reduction, which presently drives enormous research efforts to focus on these topics. Typical research fields cover the advancement of active and inactive electrode materials, separators, electrolytes, as well as manufacturing techniques. Simulation approaches for characterization of fundamental physical and chemical processes during LIB operation highlighted surfaces and interfaces to have a substantial influence on LIB kinetics, in terms of electrolyte mass transport, charge–transfer (CT) reactions at anodic and cathodic active material (AM) particles, and electronic resistance at the electrode––current collector interface. Significant improvements to battery performance by surface/interface modification were yet demonstrated by calendering[2, 3] or laser structuring[4-8] of electrodes, lamination of electrodes and separator,[9] or by enlargement of the current collector micro-surface.[10-14]
Plasma–processes are well–known as a helpful tool in the field of LIBs.[15] Plasma–processes enable the production of nanosized AM particles,[16-18] carbon–based conductive AM coatings,[19] specialized 3D architectures for electrode nanowires,[20, 21] deposition of adhesion layers on metallic substrates,[22] or production of binder-free electrode layers by direct AM deposition on the current collector.[23]
Plasma–processes also allow for the deposition of special coating layers like metal oxide (TiO2, SiO2, Al2O3) coatings, e.g. used to improve to improve electrolyte uptake characteristics of polyolefin separators.[24-26]
Ensuring sufficient electrolyte wetting is an essential requirement for LIB production. Insufficient electrolyte wetting of any electrode and separator interfaces might separator interfaces might influence anodic SEI growth negatively during formation and might lead to total cell failure in the worst case.[27] As this wetting process is typically very time-consuming––up to several days in industrial productions––it is highly relevant for the cost of LIB production.[28] Several methods have been presented to directly monitor and study the wetting properties of LIBs. These differ primarily in whether the material–specific wetting behavior or the wetting behavior at the cell level is to be investigated. The material-specific behavior can be determined by optical approaches like capillary rise tests on horizontally[7] or vertically orientated samples,[29] gravimetrically by means of wetting balance test,[30] or in combined methods.[9, 31] Aside, for determination of the wetting behavior on cell levels, radiographic methods like neutron radiography,[32, 33] X-ray,[34] or thermography[35] are frequently used. In addition, ultrasonic scanning[36] and the specialized use of electrochemical impedance spectroscopy (EIS)[9, 37] have been presented recently as suitable methods for the quantification of wetting characteristics. EIS, which is already well established for the determination of electrochemical parameters in battery cell production, can also be used to investigate both macroscopic and microscopic wetting aspects.[37]
Direct plasma etching is a well-established technique for change of surface energies and hydrophilicity characteristics, which is frequently used for the reduction of contact angles of electrode slurry solvents on electrode current collectors[38] or for the improvement of LIB separator wetting characteristics.[15, 39, 40] Though an analogous etching approach on as–coated LIB electrodes to modify the hydrophilicity of any carbon–based electrode components and thus improve the electrodes’ electrolyte uptake characteristics might seem obvious, only very limited scientific research was published on this approach so far.
Using a plasma-based CVD approach for subsequent deposition of a diamond–like carbon layer was demonstrated to improve the high–voltage stability of LiCoO2 cathodes.[41] Similarly, controlled deposition of graphite layers on LiMn2O4 cathodes was demonstrated to improve their high–temperature cyclability.[19]
The lack of systematic studies on direct plasma etching of LIB electrodes inspired this study.
2 Experimental Section
2.1 Materials
Reference electrodes were provided by ZSW (ZSW Laboratory for Battery Technology, Ulm, Germany) as internal reference material within the German competence cluster ProZell (Federal Ministry of Education and Research, Germany). Anodes had a composition of 94%wt. active graphite, 2%wt. carboxymethylcellulose (CMC), 3%wt. styrene butadiene rubber (SBR), and 1%wt. carbon black and were double-layer–coated on a Cu current collector with an areal AM loading of 8.0 mgAM cm−2 at each side. Reference cathodes consist of 95.5%wt. NMC 622, 1.5%wt. polyvinylidene difluoride (PVDF), 0.75%wt. carbon black, and 2.25%wt. conductive graphite, double–layer–coated on an Al current collector (areal loading 13.6 mgAM cm−2 at each side). A pure PVDF membrane (LIELSORT KA9301, TEIJIN LIMITED, Tokyo, Japan) was used as a separator. 1 M LiPF6 in EC/EMC 3/7 wt/wt (Electrolyte blend LP57, Gotion Inc., Fremont, USA) and vinylene carbonate (Additive – VC, Gotion Inc., Fremont, USA) were mixed in a mass ratio of 98/2 and used as electrolyte.
For the wetting balance tests, an analogous electrolyte mixture composed of 1 M LiPF6 in EC/EMC 3/7 wt/wt and an additional 2%wt VC (PuriEL electrolyte, SoulBrain MI, Seongnam, South Korea) was used.
2.2 Plasma Activation
Plasma modification of electrodes was realized by atmospheric corona plasma activation of samples passing an 800 W plasma zone at <1 m·min−1; plasma activation time was 2.4 s for all samples. Both anode and cathode samples were modified either at 30%, 60%, or 90% of the maximum plasma zone power. The energy input into the samples corresponds to the activation levels shown in Table 1.
| 800 W plasma zone level | energy input | energy input per electrode coating volume | energy input per electrode coating mass |
|---|---|---|---|
| 30% @ cathode | |||
| 60% @ cathode | |||
| 90% @ cathode | |||
| non–activated (reference) | |||
| 30% @ anode | |||
| 60% @ anode | |||
| 90% @ anode |
2.3 Pouch Cell Preparation
Cathode, anode, and separator were punched into rectangular samples (5 × 8, 5.4 × 8.4, and 5.8 × 8.8 cm2) and paired to have an areal anode/cathode capacity ratio of 116.9%. Each plasma-activated anode or cathode was paired with a pristine counter electrode. Single-cell stacks were laminated using a roll laminator (BLE 282 D, MANZ Italy, Bologna, Italy) with a line force of 157 N cm−1 at a roll speed of 1.4 m min−1 and temperatures within 100–110 °C, to form compact single cell stacks. The stacks were partially sealed into pouch foil and dried under vacuum at 70 °C for 12 h. In an argon-filled glovebox (MB20, H2O, and O2 content <0.1 ppm, MBraun, Garching, Germany) all single cell stacks were filled with 1500 μL of electrolyte previous to vacuum sealing.
Cells prepared for subsequent C-rate and cycling tests were initially charged to 0.5 V and rested for 6 h at room temperature to ensure sufficient electrolyte wetting. Formation was done by applying 3 cycles at a 0.2 C–rate, then cells were finally evacuated and sealed below electrolyte vapor pressure.
2.4 Physical Characterization
Plain sight scanning electron microscopy was performed on a Helios NanoLab 600i microscope (FEI, Hillsboro, USA) using an Everhart–Thornley–Detector (ETD). XRD analysis on as-coated electrodes was performed with a Bragg-Brentano X-ray diffractometer (Empyrean Cu LFF HR goniometer, Almelo, Netherlands) using Cu-Kα1 radiation (λ = 1.5405980 Å, 40 kV, 40 mA) and a 2θ range of 10°–140° (pristine electrodes) or 10°–90° (plasma activated electrodes), step size at 0.1°, and a pixel detector (Empyrean series 2, PANalytical PIXcel-3D detector, Almelo, The Netherlands).
For determination of the electrolyte uptake/wetting properties, electrodes were punched into 20 × 40 mm2 samples. Penetration rate K [g s−0.5] of these samples was determined by means of a wetting balance test, using a tensiometer (DCATS 25, DataPhysics Instruments GmbH, Filderstadt, Germany) with the sample holder FO11 for flexible solids. Tests were performed at a constant electrolyte temperature of 20 °C and under a conditioned dry room atmosphere (ambient temperature 20 °C, dew point −40 °C). The recorded raw data [g2 s−1] were transformed [g s−0.5] and evaluated in a time range of 8–18 s0.5 by fitting a regression line. For each investigated experimental point, five replicate experiments were performed.
2.5 Electrochemical Characterization
Charge/discharge cycles in terms of formation, power test, and lifetime test were carried out with a battery test system (CTS-LAB, BaSyTec, Asselfingen, Germany), using constant current and constant voltage (CCCV; CV current cutoff below 0.1 C–rate) modes for the charging step and CC-mode during discharge. The voltage ranges were adjusted to 2.9–4.2 V. During formation, C–rates were calculated according to the NMC weight in the cell, using the NMC 622 nominal capacity of 176 mAh g−1 as given by the supplier. At all subsequent CC charge/discharge steps, C–rates were calculated by the nominal cell capacity as provided by the final discharge step during formation. Along with power tests and lifetime tests, at least three replicate cells were assembled and studied at each investigated experimental point.
All EIS measurements were performed in a climate chamber (INCU-Line IL 68 R, VWR, Ismaning, Germany) at a constant ambient temperature of 25 °C, using a potentiostat (PGSTAT204, Metrohm Autolab, Filderstadt, Germany). EIS analysis along cycling was performed by collecting a series of EIS measurements at six separate CutOff voltages (3.0 V/3.6 V/3.7 V/3.8 V/4.0 V/4.2 V). EIS CutOff voltages were adjusted at 0.2 C-rate in CC–mode (CCCV mode at 4.2 V), followed by a controlled relaxation period of 2 h in open circuit voltage previous to any EIS measurement. Potentiostatic EIS datasets were collected in a frequency range of 100 kHz–10 mHz (10 datapoints per decade) using an amplitude of 10 mVrms. Data fitting and analysis were performed using the open–source Z-fit protocol and a modified version of the open–source DRTtools graphical user interface (GUI) analysis,[42-46] both implemented in a MATLAB environment (MATLAB R2017b, MathWorks, Natick, USA) for automation and plotting.
EIS analysis was performed on two replicate cells as parts of a total separate power test/lifetime test cell series at each point of investigation.
3 Results and Discussion
3.1 Bulk and Surface Modification Phenomena
3.1.1 Surface Characterization
Electrode samples in the pristine and plasma-activated states were characterized by a scanning electron microscope (SEM) (see Figure 1).
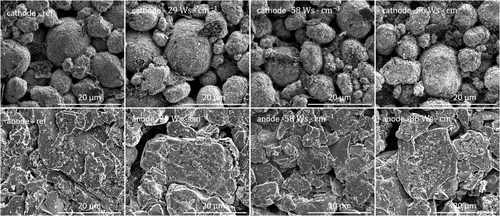
Clearly, none of the plasma modification modes caused significant changes in electrode topography, so consequently, significant changes of roughness factors or Brunauer–Emmet–Teller (BET) areas are hereinafter considered rather unlikely for the plasma-activated electrodes.
3.1.2 Crystal Structure Changes
We performed XRD analysis for further comparison of pristine and plasma-activated electrodes (see Figure 2).
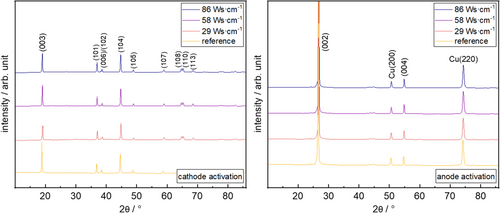
For cathode measurements, all peaks correspond to typically reported XRD patterns of NMC 622,[47] while in case of anodes, the diffractograms show typical graphite peaks[48] as well as some copper peaks.[49]
Plasma activation of anodes clearly has negligible influence on the graphite bulk structure, as the graphite peaks remain rather unaffected comparing pristine and plasma-activated anode samples. In contrast, plasma activation of cathodes clearly induces a reduction of the (003) peak intensity compared with the pristine state, with a similar extent at all activation modes. Similar effects were also reported in the literature on XRD patterns of plasma-activated LiCoO2 electrodes[41] or plasma activation of thin-film LiMn2O4 cathodes.[23] Analogous to these known literature phenomena, we consider the (003) peak intensity change as a hint for small influences of plasma activation on the NMC 622 crystal structure.
3.1.3 Wetting Phenomena
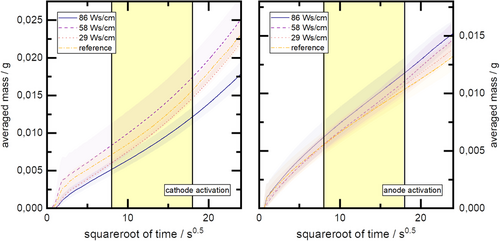
The penetration rate K [g s−0.5] acts as a material-specific parameter to describe the wetting behavior of the electrodes. It is composed of the material-specific parameters of the solid phase (electrode) such as effective capillary radius , porosity P, cross-sectional area A, and of material-specific parameters of the liquid phase (electrolyte) such as surface tension σ, viscosity η, density ρ, and the contact angle θ, which are related to the interaction of the solid and liquid phases. Thus, the penetration rate allows for quantitative comparison between samples of the same material.
The evaluation of the slope of the linear regression curve in the range of 8–18 s0.5 (yellow highlighted area) is shown in Table 2. The table also contains the results of a checkup for statistical significance. For this purpose, a Levene test (see Table 2) was performed for the results of the anode and cathode, respectively, to determine the variances for homogeneity in combination with an Anderson Darling test to check for normal distribution, followed by a one–tailed t-test with a confidence interval of .
| Plasma Modification | Penetration Rate K | ΔK | Statistical Significance | ||
|---|---|---|---|---|---|
| Reference | 30% Plasma | 60% Plasma | |||
| Cathode Pristine | 8.59 E-04 | 2.88 E-05 | – | – | – |
| @ cathode | 8.37 E-04 | 2.31 E-05 | ⊠ | – | – |
| @ cathode | 9.06 E-04 | 1.85 E-05 | ☑ | ☑ | – |
| @ cathode | 7.02 E-04 | 3.76 E-05 | ☑ | ☑ | ☑ |
| Anode Pristine | 4.73 E-04 | 2.49 E-05 | – | – | – |
| @ anode | 5.20 E-04 | 3.70 E-05 | ☑ | – | – |
| @ anode | 5.42 E-04 | 6.75 E-05 | ☑ | ⊠ | – |
| @ anode | 5.51 E-04 | 2.59 E-05 | ☑ | ⊠ | ⊠ |
The results show plasma modification of anodes leading to an increase in penetration rate at all examined energy input levels. Although there is no statistically significant difference in penetration rate between the specific anode activation levels, a trend to higher penetration rate with increasing anodic plasma energy input is suggested.
A different result is obtained for plasma treatment of cathodes. No statistically significant difference is found comparing the lowest cathodic plasma energy input level with the pristine/reference state, although the averaged value of the penetration velocity for the plasma treatment deteriorates slightly compared to the reference. Clearly, the second level of cathodic plasma energy input leads to a significant improvement in penetration speed compared to any other cathode test points. In contrast, the cathodic plasma treatment at the highest energy input level leads to a statistically significant deterioration of the penetration rate compared to all other test points. More details are shown in Figure 4.
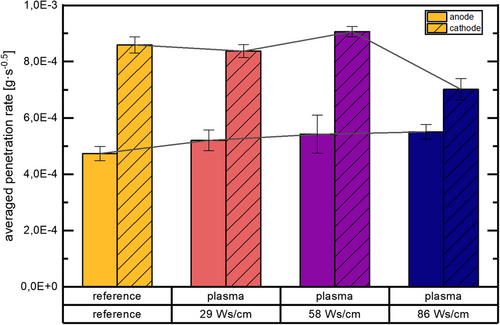
As significant topographic changes of the electrode surfaces were excluded by the SEM measurements to the possible extent, any changes in electrolyte penetration rates have to originate from changes in surface energy or changes of hydrophilicity, improving the interaction with the polar, aprotic solvent molecules or with the solvated Li+ ions present in high concentration in the used electrolyte.
Similar effects on improved electrolyte uptake and wetting characteristics were also described by Z. Wang et al. for O2 plasma activation of polypropylene (PP) separators,[39] while an increase of surface hydrophilicity was reported by S.–H. Han et al. for corona plasma activation of polyethylene terephthalate (PET) membranes.[50] Nevertheless, both for inorganic filled (SiO2) polyvinylidene difluoride-hexafluoropropylene (PVDF–HFP) membrane separators as well as for PVDF–HFP/SiO2 coated polypropylene (PP) separators, plasma etching processes exceeding a specific modification time were described as detrimental both by excessive etching phenomena and by increasing thermal shrinkage phenomena.[15]
As in this study, only the cathode is based on the thermoplastic polymer PVDF acting as electrode binder (carboxymethyl cellulose–styrene butadiene rubber/CMC–SBR used for the anode), similar phenomena might have caused a deteriorated penetration rate at the highest cathodic plasma energy input level.
3.2 C-rate Capability
C–rate capability of NMC 622–graphite single cells composed of pristine/plasma activated electrodes were studied after formation. Details are shown in Figure 5.
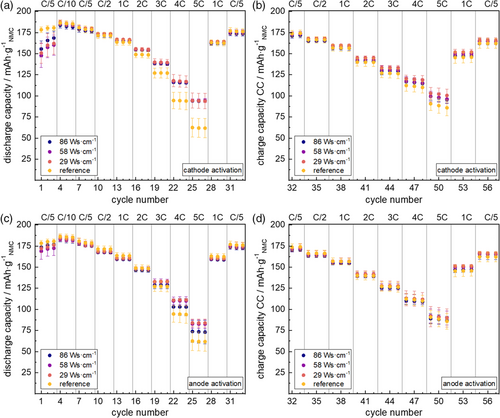
Clearly, all types of plasma activation on cathodes or anodes improve capacity retention at high discharge rates, while charge rate capability remains rather unpersuaded. While plasma activation of graphite anodes improves the capacity retention at 5C discharge by ≈10% (highest plasma energy input) or ≈27% (lowest and medium plasma energy input), highly improved capacity retention of ≈45% is found at all cathode activation modes. Similar improvements in capacity retention at high C–rates were also reported in a US patent for O2 plasma modification of thin film LiCoO2 electrodes,[51] and were attributed to improvements in AM stability and ionic conductivity.[52] C.–L. Chen and coworkers found similar effects for the O2–plasma treatment to the rate capability of thin-film LiMn2O4 cathode layers.[23] They showed a more smooth/dense nanocrystal surface (upon plasma–treatment) to correlate with reduced CT resistances and attributed the electrochemical effects to a more uniform current distribution on the cathode film surface.[23] C.–L. Chen and coworkers also found excessive plasma activation to counteract the positive electrochemical effects most likely due to the deep impact of the plasma bombardment on the substrate bulk material and therefore causing serious damage to the crystal structure.[23] This correlates to our findings on lowered C-rate capability upon highest plasma energy input to graphite anodes (see Figure 5). Though in contrast to these reports by C.–L. Chen and coworkers,[23] we found plasma-based changes of our cathode XRD pattern to correlate with an improvement in C–rate capability (see Figure 2), which might indicate more a complex nature of plasma interaction to layered oxide cathodes than considered so far.
Further insights can be found in the charge–discharge curves at low/high C-rates. Exemplary curves are given in Figure 6.
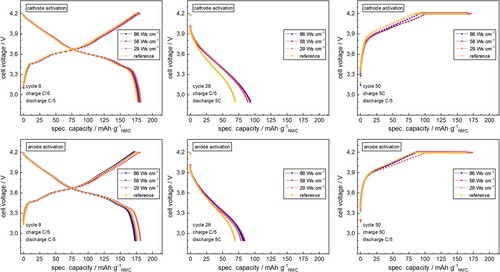
Analogous to the trends of overall cell capacities during the C–rate test (see Figure 5), no significant difference in charge–discharge curves is visible upon any plasma activation mode at low C–rates (C/5), while clear deviations are found especially during discharge at high C–rate (5C). The voltage profile deviates from reference behavior close to the lower cutoff voltage (most significant trends upon cathode activation), while only a small deviation of the charge voltage curves upon plasma activation are found during CC fast charge period close to the upper cutoff voltage.
For an improved understanding of the underlying effects, two cells of each examination point were also studied by EIS at several states of charge (SOC) during the 7th cycle. Nyquist data are shown in Figure 7 and 8.
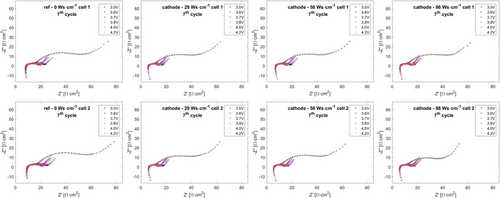
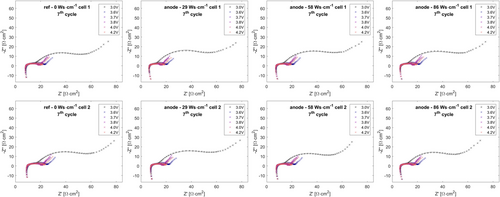
The EIS datasets were analyzed by equivalent circuit analysis using a well-established equivalent circuit model (see Figure 9) for the description of EIS response on layered–oxide–graphite pouch cells.[53-55]
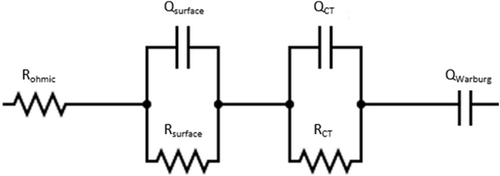
The equivalent circuit model contains ohmic resistance (ohmic setup background, cell contacts, electrolyte conductivity) as well as two R–CPE parallel elements representing surface resistance phenomena and CT resistance phenomena, as well as a final CPE element describing solid state diffusion phenomena. For the application of this fit model to the present EIS data, any datapoints with negative ordinate value were excluded, as arising from inductive influences on the setup background. Fit data are shown and discussed in the following (see Figure 12).
It is well accepted in the literature that both indicated R–CPE semicircles contain several contributions with high overlap. The surface resistance semicircle is typically composed of considerable contributions of anodic SEI[54, 56] as well as from the cathode–current collector interface.[57, 58] Latter can be expected in this case to have minimized extent due to the application of cathode calendering and lamination steps.[2, 3, 59]
CT semicircle represents overlapping contributions of anodic and cathodic CT reactions.[56, 58, 60, 61]
Due to these overlaps, expanding the equivalent circuit model with further R–CPE parallel elements typically results in overdeterminacy during fitting without further measures like temperature variation[56, 62-64] or the introduction of reference electrodes.[58, 60, 61]
As the chosen pouch cell format could only be studied by EIS in two–electrode format, while temperature variation was excluded to prevent cell damage previous to subsequent power test and lifetime test, equivalent circuit analysis cannot decouple these overlapping phenomena. Therefore, distribution of relaxation times (DRT) analysis (see Figure 10 and 11) is also performed for decoupling of the CT phenomena, using the novel approach as published by F. Ciucci and coworkers.[42-46] Pure inductive contributions (−Z’’ < 0) were also excluded from DRT analysis.
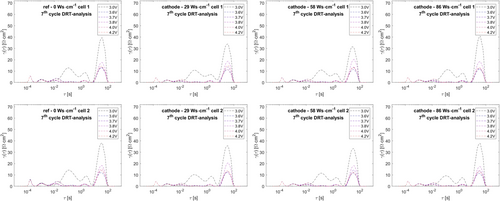
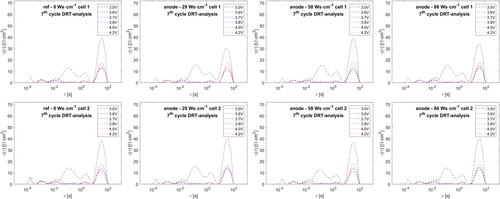
Clearly, the DRT analysis reveals six separate peaks for all EIS spectra in most cases. Exemplary peak maxima are shown in Table 3.
| peak no. | τ | lg(τ) | γ(τ) |
|---|---|---|---|
| #1 | 0.0002 | −3.7988 | 5.6972 |
| #2 | 0.0011 | −2.9745 | 2.5031 |
| #3 | 0.0089 | −2.0518 | 2.2042 |
| #4 | 0.1237 | −0.9077 | 0.5369 |
| #5 | 1.6752 | 0.2241 | 1.6273 |
| #6 | 33.7380 | 1.5281 | 12.9883 |
Along all DRT datasets, at the lowest SOC (discharge cutoff 3.0 V) during the 7th cycle, peak #3 does not exist. Phenomena at highest frequencies/lowest time constants are typically assigned to inductive setup influences, while lowest frequencies/highest time constants are typically considered to arise from diffusion characteristics.[62, 64] Therefore, peaks #1 and #6 are herein excluded from further analysis. Analogous to reports from T. P. Heins et al. for NMC111–graphite cells, four peaks remain in the medium frequency/medium time constant region.[62] By studying temperature dependencies and evaluation of activation energies from Arrhenius plots, T. P. Heins et al. pointed out that peaks at lower time constant arise from surface/interface contact phenomena, while peaks 3 and 4 within the medium time constant region can be clearly assigned to NMC CT reaction (peak 3) and graphite CT reaction (peak 4).[62] Analogously, in this study, we consider peaks #3 and #4 as a measure for the CT reactions of cathode and anode, respectively. Combining equivalent circuit analysis and DRT analysis of cathode and anode CT contributions led to the resulting plots shown in Figure 12.
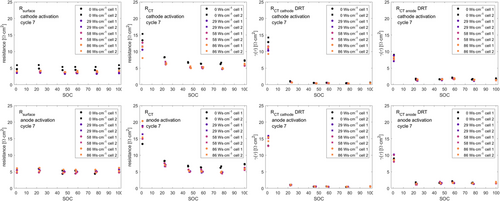
Obviously, none of the performed anode plasma activation modes has a significant influence on Rsurface, RCT anode or RCT cathode. The total RCT fit parameter reveals a systematic reduction of ≈8% at SOC20 – SOC100. In contrast, all chosen cathode plasma activation modes reduce Rsurface by ≈25% at all states of charge, also the total RCT appears systematically reduced by ≈22% at all states of charge.
These findings in reduced internal resistances will induce a clear reduction in ohmic overpotentials during LIB operation and correlate very well in scale with identified trends during discharge rate tests (see Figure 5).
In terms of electrode-specific RCT, as provided by DRT analysis, a clear reduction of ≈24% on RCT cathode at minimal SOC is found for all cells containing plasma-activated cathodes. This correlates well with the deviations of discharge voltage curves at cathode-activated cells (see Figure 6).
Reduction in surface resistance by cathode activation might indicate a change in the Solid Electrolyte Interphase. Though literature information on NMC CT resistances at very low states of charge (<SOC10) is rare, the general characteristic trend of RCT cathode vs SOC with its drastic increase at low SOC (high NMC lithiation grade) is a well–known phenomenon for layered oxide and phosphate cathodes.[55, 60, 65] This phenomenon was assigned to a general change in the CT reaction itself when the amount of lithium ions in the cathode crystal exceeds a certain level.[66] J. Kasnatscheew et al. also described a clear correlation of NMC 111 overpotential with the crystal lattice change, i.e., the c axis parameter of the NMC lattice ( space group), along lithiation/delithiation of the crystal,[67] arising from a direct correlation of Li+ crystal lattice diffusion processes with the lattice structure.
Therefore, the plasma activation of cathodes can be assumed to directly modify either the crystal structure change during cathode lithiation/delithiation or the Li+ diffusion characteristics, which might arise from influencing the ratio of the differently oriented monocrystal surfaces, as reported in a US patent for O2–plasma treatment of thin film LiCoO2 electrodes.[51, 52]
3.3 Cycling Stability
Cycling stability of the cells was checked by performing lifetime tests after the C–rate tests (see Figure 13).
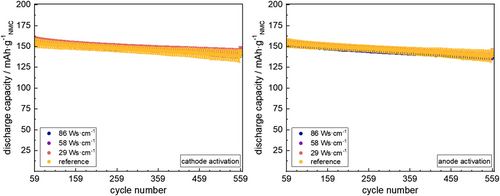
Clearly, the cycling stability of the cells remains widely unaffected by any of the chosen plasma activation modes. Analogously, no significant changes in EIS feedback comparing pristine/plasma activated electrodes are found for the cells during EIS analysis along the charging step of the 556th cycle (see Table 4).
| Plasma Modification | Mean Capacity @ Cycle 59 | Mean Capacity @ Cycle 559 | Capacity Fade |
|---|---|---|---|
| @ cathode | 159 ± 3 | 144 ± 4 | 10% |
| @ cathode | 157 ± 3 | 143 ± 3 | 9% |
| @ cathode | 156 ± 2 | 140 ± 4 | 10% |
| Nonactivated (reference) | 156 ± 6 | 144 ± 3 | 8% |
| @ anode | 156 ± 2 | 140 ± 4 | 11% |
| @ anode | 156 ± 2 | 139 ± 2 | 11% |
| @ anode | 153 ± 3 | 136 ± 2 | 11% |
4 Conclusion
We used scanning electron microscopy, XRD, wetting balance test, power tests, lifetime tests, EIS as well as DRT analysis to determine process–structure–property interdependencies of plasma activation of as–coated cathodes/anodes in LIB cells. While no topographic changes were found, XRD analysis indicates small influences of plasma activation on the NMC 622 crystal structure. Clear improvements in electrolyte uptake/wetting rate could be found by anode activation, while in case of cathode activation, improvements in wetting rate were only achieved in a limited window of plasma energy input. While the cycling stability stays unchanged by plasma modification of electrodes, significant improvements in C–rate capability were found especially for cathode activation, while for anode activation an upper limit in plasma energy input was identified. Changes in C–rate capability could be assigned to reduction of surface resistance (cathode activation) and CT resistance (cathode and anode activation), while DRT analysis highlighted considerable influences of cathode activation on cathode CT processes at lowest SOC (highest cathode lithiation grade). Summary of effects is provided in Table 5.
| Plasma Modification | Wetting Rate | C–Rate Capability | Cycling Stability |
|---|---|---|---|
| @ cathode | ⊠ declined | ☑ improved | Unaffected |
| @ cathode | ☑ improved | ☑ improved | Unaffected |
| @ cathode | ⊠ declined | ☑ improved | Unaffected |
| Nonactivated (reference) | – | – | – |
| @ anode | ☑ improved | ☑ improved | Unaffected |
| @ anode | ☑ improved | ☑ improved | Unaffected |
| @ anode | ☑ improved | (minor improvement) | Unaffected |
After all, there still remain some open questions on the fundamental nature of electrode surface modifications upon plasma treatment, and on the mechanisms of their interaction with the electrolyte during LIB operation. Further analysis of these fundamental relationships, e.g. X-ray photoelectron spectroscopy (XPS) or X-ray absorption near edge structure (XANES) should be part of our future studies.
Acknowledgements
This research was funded by the BMBF (Federal Ministry of Education and Research, Germany), grant numbers 03XP0241 (ÖkoTroP) and 03XP0237A (Cell–Fill) as part of the ProZell cluster. The authors gratefully acknowledge Stefan Roessler and Helmut Bruglachner (ZSW Laboratory for Battery Technology, Ulm, Germany) for providing reference electrodes.
Open Access funding enabled and organized by Projekt DEAL.
Conflict of Interest
The authors declare no conflict of interest.
Open Research
Data Availability Statement
The data that support the findings of this study are available from the corresponding author upon reasonable request.


