Anion Exchange Membrane Water Electrolysis from Catalyst Design to the Membrane Electrode Assembly
Abstract
Anion exchange membrane (AEM) electrolysis aims to combine the benefits of alkaline electrolysis, such as stability of the cheap catalyst and advantages of proton-exchange membrane systems, like the ability to operate at differential pressure, fast dynamic response, low energy losses, and higher current density. However, as of today, AEM electrolysis is limited by AEMs exhibiting insufficient ionic conductivity as well as lower catalyst activity and stability. Herein, recent developments and outlook of AEM electrolysis such as cost-efficient transition metal catalysts for hydrogen evolution reaction and oxygen evolution reaction, AEMs, ionomer, electrolytes, ionomer catalyst–electrolyte interaction, and membrane-electrode assembly performance and stability are described.
1 Introduction
The current annual production of hydrogen amounts to 90 million tons globally,[ 1 ] this hydrogen produced finds use in a range of applications such as semiconductor manufacture, refineries, methanol, and production of fertilizers.[ 2 ] Hydrogen is also highly relevant as a fuel for the green transition, provided hydrogen production can be turned away from the currently dominating fossil-based processes to processes that neither consume nonrenewable resources nor emit CO2.[ 2 ] In this context, the technology of water electrolysis, i.e., splitting of water by the application of electric power, becomes important as it appears as the only large-scale alternative available.[ 2 ]
Deployed on a large scale, water electrolysis technology will face challenges, primarily related to energy efficiency and the resources that will have to be committed for making the equipment. For the proton-exchange membrane water electrolysis (PEM water electrolysis) technology, resource issues related to scarce iridium being the only practical catalyst for the anode are well known,[ 3 ] but also the classical alkaline water electrolysis may face resource and cost issues as this technology is reliant on nickel for corrosion protection and catalysis of the hydrogen evolution reaction (HER) and oxygen- evolution reaction (OER); although considered,[ 4 ] nickel is an element much in demand for competing technologies such as in batteries and is also subject to some geopolitical pressure.[ 1 ] Improvements in the existing water-electrolysis technology, as well as new developments, are, therefore, critical to the security of supply and sustainability of the energy system.
In the relatively recent technology of anion-exchange membrane (AEM) water electrolysis, still in early-stage development,[ 1, 2 ] the diaphragm typically employed in the classical alkaline water-electrolysis technology is replaced by a membrane conducting hydroxide ions. This may reduce gas crossover and cell resistances as in the PEM technology, yet with the opportunity to employ the less costly and more abundant catalysts associated with the alkaline technology. The AEM water electrolysis thus aims to consolidate the low-cost materials of the alkaline system with the performance of PEM water electrolysis. The result would be an efficient and low-cost electrolyzer appropriate for storing energy from renewables in the form of hydrogen.[ 5, 6 ]
The AEM water electrolyzer consists of a membrane electrode assembly (MEA) consisting of an anode for OER, a cathode for HER, anode/cathode bipolar plates, and AEM].[ 7 ] Figure 1 shows the membrane electrode assembly and catalyst electrode layer in which the ionomer and catalyst are in contact. The catalyst conducts electrons while the ionomer, if present, may provide a hydroxide ion-conducting path as well.[ 7, 8 ]
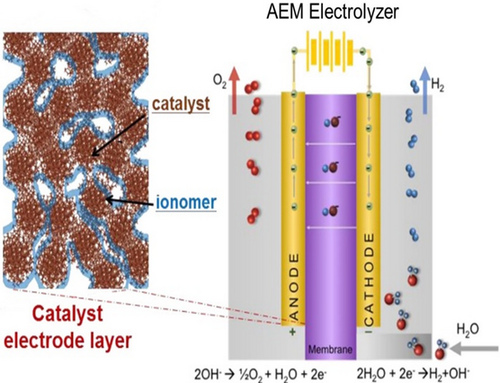
The HER and OER occur at electrochemically active sites, i.e., three-phase boundaries among the catalyst, the ionomer, and the pore. If an OH− conducting ionomer is present in the catalytic layer, this will (in principle) eliminate the need for a KOH or K2CO3 feed. This may come at a cost of lower activity.[ 9, 10 ] During water electrolysis using AEMs, the OH− ions are generated from the water reduction at the cathode.[ 10, 11 ]
The AEMs are formed when a cationic group is bonded to a polymer backbone as a side chain or as a part of the polymer backbone.[ 12, 13 ] However, the OH− ions tend to attack the cationic groups and reduce them. This represents a fundamental problem associated with hydroxide-exchange AEMs and is challenging for the membranes and ionomers in the catalyst layers.[ 14-16 ] When reacting with CO2 from the air, the AEMs in the hydroxide form tend to convert to the less conductive carbonate form.[ 12 ]
The development and research needs for AEM electrolyzers are significant.[ 17, 18 ] Catalyst–electrolyte–ionomer interactions, cost-efficient catalyst activity, and durability are of concern for AEM water electrolysis at an industrial applied scale.[ 19 ]
Fundamental electrocatalysis research efforts for AEM electrolysis have three main issues: 1) The catalyst activity is tested in liquid alkaline electrolytes, neglecting any effects of anion exchange ionomers. 2) Contamination of alkaline electrolytes with transition metals. These impurities may lead to confusing results in catalysts’ development.[ 20-23 ] 3) The use of counter electrodes for HER, such as Pt, dissolves into the electrolyte solution and deposits on the working electrode.[ 24, 25 ]
The development of cheap transition metal catalysts for HER and OER is essential to minimizing AEM water electrolysis costs. The challenges are associated with optimizing chemical composition, stability, ionomer–electrolyte–catalyst interaction, and mass activity compared with noble metals. In the following sections, we describe recent developments in AEM electrolysis such as (HER and OER catalysts, AEMs, ionomer, electrolytes, ionomer catalyst–electrolyte interaction, and membrane–electrode assembly performance and stability).
2 HER
The HER in alkaline electrolytes is commonly assumed to proceed through a multistep electrochemical reaction that involves the electrode surface electrocatalytically, i.e., through adsorption–desorption steps. These steps are illustrated in Figure 2 and are frequently referred to as the Volmer reaction, the Tafel reaction, and the Heyrovsky reaction as indicated in Figure 2 for alkaline conditions. In the Volmer, step water is oxidized to adsorbed hydrogen, which may then combine chemically with molecular hydrogen in the Tafel step or with hydrogen emerging from another water oxidation step (Heyrovský reaction).[ 26 ]
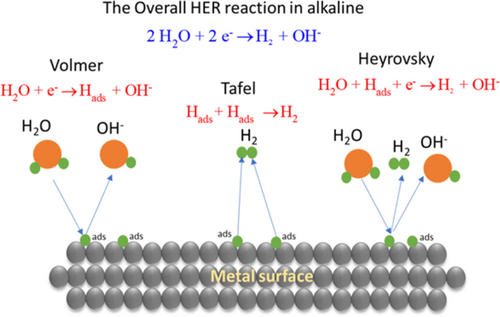
Since the Volmer step involves the electrochemical reduction of H2O into OH− and adsorbed hydrogen (Hads) in alkaline solutions, the hydrogen–oxygen bond in the water molecule needs to be cleaved and replaced by another bond formed between hydrogen and the substrate (electrocatalyst).[ 27, 28 ] The Heyrovsky and Tafel reactions both involve desorption of hydrogen, electrochemically in the Heyrovský reaction and chemically in the Tafel reaction. The overall reaction may thus proceed via a Volmer–Tafel scheme, a Volmer–Heyrovský scheme, or a combination of these.[ 27, 28 ]
Since the HER involves both adsorption and desorption steps, one expects the activity of metal for the HER to depend on the binding energy of hydrogen to the metal This may give rise to a peaked, volcano-shaped curve, often rationalized regarding the (Sabatier) principle that the maximum reaction rate for a given metal or catalyst expresses an optimum balance between too loosely bound adsorbates (and concomitant low adsorption rates) and too strongly bound adsorbates (and desorption blocking the surface and slowing the reaction).[ 29, 30 ]
| Mechanism | Rate-determining step | Overpotential range | Tafel slope, [mV dec−1] | Reaction order | Ref. | |
|---|---|---|---|---|---|---|
| Alkaline | Volmer- Tafel or Volmer–Heyrovsky | Volmer | All | 120 | 0 | [33] |
| Volmer–Heyrovsky | Heyrovsky |
Low High |
40 120 |
−1 0 |
||
| Volmer–Tafel | Tafel |
Low High |
30 Limiting current |
−2 0 |
||
| Acid | Volmer–Tafel or Volmer Heyrovsky | Volmer | All | 120 | 1 | [32, 34] |
| Volmer–Heyrovsky | Heyrovsky |
Low High |
40 120 |
2 1 |
||
| Volmer– Tafel | Tafel | Low | 30 | 2 |
Several theories attempt to describe the HER process in alkaline electrolytes and used it in catalyst design taking into account the fact that the reaction is significantly slower at Pt in alkaline solutions than in acidic.[ 35 ] Some important theories are briefly summarized below.
2.1 Hydrogen Binding Theory
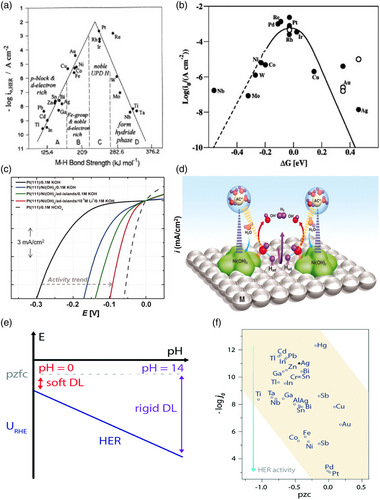
The exchange current densities for various metals were measured by Trasatti,[ 36 ] who found a linear relationship between the metal work function and the exchange current density of metals during HER. Comparing the exchange current density on metals with the hydrogen binding energy (HBE), a typical volcano shape was established (Figure 3a), indicating that the Sabatier principle does apply to the HER; an ideal HER catalyst should not bind hydrogen too strong nor too weak to both adsorb Had rapidly in the Volmer step and desorb Hads necessary to evolve H2 either through the Heyrovsky or the Tafel step rapidly.[ 36 ] A more recent finding underpinning the hydrogen binding energy hypothesis is the results of Sheng et al.[ 37 ] Theoretically, the hydrogen-binding has been related to electronic structure through the d-band theory by Nørskov and co-workers. Nørskov et al. computed the free energy of formation (ΔGHad) for the Had intermediate on several metallic surfaces using density-functional theory (DFT) and obtained a volcano curve similar to those obtained experimentally (Figure 3b), indicating that the HBE is indeed a good physical descriptor for the HER. Furthermore, DFT calculations indicate that the chemisorption energy, dissociation energy, and activation barrier are directly related to the d-band center of gravity of the metal.[ 38 ] The d-band theory portrays Had orbital interaction with the metal d-orbitals in terms of the degree to which bonding and anti-bonding state are empty or filled, upon which the M-H bonding strength depends.[ 37-39 ]
2.2 Bifunctional Mechanism
Markovic et al. have proposed the HER activity in alkaline media is limited by the water dissociation barrier which generates the Had,[ 41, 44, 45 ] and that OHad competes for the same surface sites with reactive Hads intermediates and that this, therefore, slows down the generation of H2. By providing oxophilic sites that can host OHad and thereby facilitate water dissociation the Had generation can be enhanced, the Volmer step kinetics improves and the overall HER rate is enhanced as in Figure 3c,d).[ 41, 44 ] Markovic et al. demonstrated that adding Ni(OH)2 onto metal surfaces including Ni leads to a 3–5-fold enhancement in the HER rate.[ 41, 44, 45 ]
2.3 The Potential of Zero Free Charge Theory
The potential of zero free charge (pzfc) theory attempts to rationalize differences in the activity of the HER in alkaline and acid electrolytes in terms of the water structure at the electrode–electrolyte interface.[ 46, 47 ] (For a thorough-going discussion of differences in the pH-dependence of the HER at different metals, see Ref. [48] The pzfc is the potential at which the electronic charge in the electrode is zero, and the electrode potential with respect to the pzfc determines this water structure near the electrode surface. The rigidity of this water structure has been suggested to have consequences for the HER, the rates of which therefore have been suggested to be related to the pzfc.[ 46, 47 ] Based on the assessment of the pzfc through laser-jump experiments. the Koper group has suggested that the sluggish activity of platinum in the alkaline electrolyte is related to the pzfc relative to the potential of the HER in acid and alkaline. The pzfc is approximately independent of pH on the scale of the standard hydrogen electrode. On the scale of the reversible hydrogen electrode, the pzfc, therefore, increases by several hundred millivolts from acidic to strongly alkaline solutions. The onset of the HER is therefore close to the pzfc in acidic media, but much lower than the pzfc in alkaline solutions (Figure 3e). This implies a strong electric field in the double layer in alkaline solutions relative to that in acid, and that water in the double-layer is less free to reorient in alkaline solutions than in acidic solutions. This, in turn, implies that the transfer of reactants and products to and from the electrode surface is more restricted in alkaline solutions.[ 47 ]
The addition of Ni(OH)2 to platinum lowers the pzfc, and so decreases the interfacial electric field at the HER operating potential. Thus, the double-layer becomes more flexible which facilitates OH− transport.[ 47 ] This explanation goes against the initial observations made by Trasatti[ 42, 43 ] and Zeradjanin et al.[ 49 ] who observed an increase in HER activity with the catalyst work function (Figure 3f).[ 26, 42, 43 ]
2.4 2B Theory
Jia et al. found that changing the identity and concentration of alkali metal (AM+) cations change the HER of PtNi/C, Pt/C, and Ni/C.[ 50, 51 ] This effect can be rationalized by writing the Volmer reaction as two substeps of which the first is chemical and involves the formation of OHads−(H2O) x −AM+ adducts from water and AM+ forming. The next step is the cleavage of the OHads bond to the surface, leading to the formation of OH−−(H2O) x −AM+ adducts. Since AM+ is a Lewis hard acid, OHads a Lewis soft base, OH− a Lewis hard base, and hard acids bind strongly to hard bases but weakly to soft bases, this changes the free energy of the products and reactants of the step and therefore the rate of the reaction.[ 41 ] Effectively, the AM+ propels OHads from the surface and into the solution, increasing the rate of the Volmer step and also the overall rate of the reaction (if the Volmer step is rate-determining). The HER activity can therefore be improved by changing the type and amount of AM+ in the vicinity of the electrode.[ 50 ] Combining the idea behind the 2B theory and the pzfc theory, the cation may play a key role in HER kinetics in alkaline media by influencing OH− transfer in the double layer region.[ 50 ] The presence of AM+ may negatively shift the pzfc to cause the HER pH-dependence as AM+ helps to remove OHads and thus increases HER activity.[ 50 ]
In summary, the HBE theory only depends on the inherent catalyst properties while the bifunctional mechanism considers the Hads and OHads intermediate interaction on surfaces. The pzfc theory considers the transfer of interfacial OHads intermediates, and the 2B theory considers cation effects in the interfacial double layer region.
2.5 Approaches to HER Catalyst Design
Although a high pH allows for transition metal catalysts like Ni without significant durability issues, Pt is still more active for HER.[ 52, 53 ] For transition metal electrocatalysts, the exchange current densities are lower (by 1–2 orders of magnitude) than those of Pt in alkaline media.[ 52, 54, 55 ] Cheap transition metal electrocatalysts have poor kinetics compared with platinum group metal (PGM) catalysts, but a higher surface area and loading may compensate for the performance difference with cost-saving.[ 54, 56, 57 ] From the viewpoint of materials design, Figure 3 summarizes some promising strategies in the literature to tailor and develop HER electrocatalysts with lower overpotential and overcome the fundamental limitation of low HER activity in alkaline electrolytes. The strategies pursued to increase activity will depend on the theoretical description adopted (see Section 2) including the following: 1) Optimizing the hydrogen binding energy (HBE): This approach utilizes the fact that the HER activity of transition metals in alkaline media exhibits a volcano trend and consequently that catalyst should be designed to approach the apex of the volcano plot. The HBE can be tailored by alloying transition metals which changes the d-band electron filling, Fermi level, and interatomic spacing.[ 22, 49 ] HER activity for Ni can be improved by alloying Ni[ 27, 58 ] with transition metals such as NiMo, NiAl, NiCr, NiSn, NiCo, NiW, and NiAlMo.[ 53, 58, 59 ] 2) Exploiting the bifunctional mechanism: This approach assumes that the HER can be sped up by introducing adjacent metal oxide sites with oxide or hydroxide surfaces, beneficial for splitting water, and metal sites beneficial for adsorbing hydrogen to form H2.[ 41, 44, 45, 55 ] New catalysts have been designed by combining metals and hydroxides to promote the HER, such as Ni–Ni(OH)2, Pt–Ni(OH)2, Ni–NiO–Cr2O3, Ni–NiO–Fe2O3.[ 19, 60, 61 ] Note that the ability of the bifunctional theory to describe some experimental results has been questioned.[ 48 ] 3) Metal carbides, phosphides, borides, and dichalcogenides offer advantages such as low cost, good electrical conductivity, electrocatalytic activity, and stability. Among them, Mo2C, CoP, NiB, and MoS2 are the most promising HER electrocatalysts.[ 59, 62-64 ] 4) Exploit electronic coupling between the conductive support and catalyst. The HER activity and durability can be improved using supports such as carbon black, carbon nanotubes (CNTs), graphene, or reduced graphene oxide (RGO) where the support ensures the electrical transport pathway and reduces the physical delamination/dissolution of the catalyst layer.[ 59, 65, 66 ]
3 OER
Several mechanistic schemes were proposed by Bockris and Otagawa,[ 70 ] Krasilshchikov[ 71 ] Kobussen and Broers, Willems et al.[ 72 ] and O’Grady et al.[ 73 ] A summary of Tafel slopes and reaction orders for a number of proposed reactions was provided by Bockris.[ 74 ] In these early mechanistic schemes, the OER was interpreted in terms of an initial discharge of hydroxide ions at a catalytically active surface site (S) leading to the formation of discrete adsorbed hydroxide MOH intermediates followed by the formation of other intermediates.[ 75 ]
The reaction schemes in Figure 4 provide an overview of possible monomolecular pathways, i.e., pathways that only involve one surface site (“S”) in each step and thus exclude reactions such as the last step of the electrochemical oxide path.
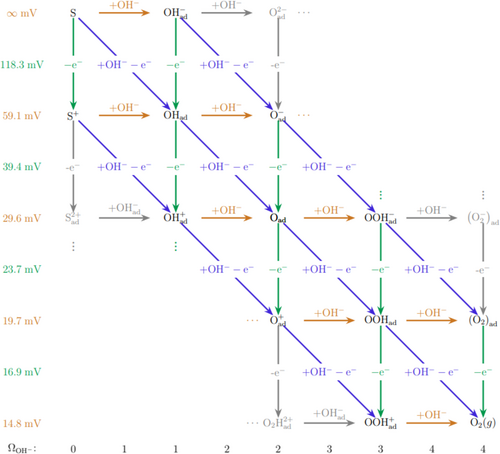
Vertical lines represent electron transfer, horizontal lines chemical steps, and sloped lines concerted reactions in which both hydroxyl ions and electrons participate. Tafel slopes are given to the far left of the scheme for the case that any of the steps to their right is rate-determining, assuming all symmetry factors to be 0.5. (These Tafel slopes and reaction orders represent the case in which there are no saturation effects in terms of adsorbate coverage and thus the low overpotential situation.) In other words, if any of the steps in the fourth line from the top of the Scheme in Figure 4 is rate-determining, the Tafel slope will be 39.4 mV, etc. Likewise, the reaction orders with respect to OH− are the same for all steps in the same horizontal position in the diagrams and are given at the bottom.
For monomolecular reactions, the scheme in Figure 4 is quite flexible. For example, Lyons et al. have suggested that the formation of hydrated non-stoichiometric oxy-hydroxide surfaces would increase OER activity on bulk metallic electrodes.[ 76-78 ] The active sites are referred to as surfaquo, MO x (OH) y ” groups. If the surface site (S) in Figure 4 is associated with SOH, the scheme proposed by Lyon et al. can easily be accommodated.[ 76-78 ] A complication in interpreting data for the OER is that lattice oxygen from the catalyst itself may also take part in the reaction.[ 75 ] DFT and 18O isotope labeling studies show that some perovskite materials prefer the adsorbate evolution mechanism while other materials prefer a lattice oxygen participation mechanism.[ 75 ]
The OER mechanism can to some extent be determined from Tafel slope-sup to and including the rate-determining step. However, as is apparent from Figure 4, several rate-determining steps may have the same Tafel slope[ 79 ] owing to the larger number of intermediates involved as compared to the HER.[ 75 ] However, supporting the Tafel slope with measurements of reaction order and other measurements will narrow down significantly the number of possible rate-determining steps.[ 79 ]
3.1 Rationalizing OER Catalytic Activity
The importance of both redox reversibility and acid-base properties of the oxy-hydroxide structure[ 76-78 ] are implied by the OER mechanisms in Section 3. The horizontal lines in the diagram correspond to an acid–base reaction and are thus related to the acid–base properties of the catalyst, the vertical processes represent a change in the oxidation state of the catalyst surface and are thus related to the redox properties of the catalyst, and the diagonals are related to both. Tseung et al.[ 80-84 ] thus correlated the activity for the OER with the oxidation state of the cation in oxide catalysts. Trasatti used acid–base properties for rationalizing and explaining trends in the catalytic activity of OER catalysts (alkaline and PEM).[ 85 ] Potentials of redox switching off the catalyst have also been correlated with OER activity,[ 86 ] as well as binding energies of the metal to hydroxyl ions,[ 86 ] binding energies of the metal to oxygen, to the number of d-electrons,[ 70, 87 ] and geometrical factors. For metal oxides, Trasatti[ 85 ] suggested replacing the correlation between the overpotential and the binding energies of oxygen or hydroxyl with the enthalpy for the transition MO x to MO1+x , referred to as the lower to higher oxide transition” and in which MO x and MO1+x are two forms of the oxide that differ in the number oxygens per metal (1:x to 1:1 + x), resulting in a volcano-shaped curve for several oxides.
Since one electron is transferred in each of the steps in these mechanisms, each step will have its change in free energy decreased by the same amount for any given change in the electrode potential. The free energy of the reaction products of the reaction (12) will, therefore, be changed by −eΔE (in which e is the elementary charge and usually stated in eV) for a change ΔE in the electrode potential (in V) relative to the reactants of this step, i.e., relative to the reactants of the OER. However, the reaction products of the reaction (13), being the result of two electron transfers, will have their free energy changed by −2eΔE for the same change in electrode potential, relative to the reactants of the OER. The third and fourth steps will suffer from the corresponding changes in the free energy of −3eΔE and −4eΔE, respectively, relative to the reactants of the OER. This is illustrated in Figure 5a, which gives an example of free energy distribution for the reaction steps (8) through (11) for three different electrode potentials E1 through E3 for two different distributions of free energy changes. (E0 in the figure is the null potential for the OER).
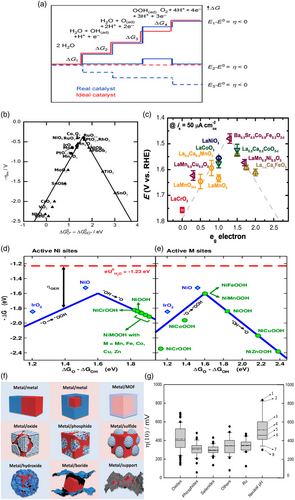
If the total free energy of 4 × 1.23 eV required to transfer all four electrons are evenly distributed over all steps in the reaction mechanism, as illustrated by the red curve in Figure 5a,[ 70 ] the free energy change for all steps becomes zero at the same electrode potential, i.e., at 1:23 V. At electrode potentials higher than this, they all become negative and the reaction becomes thermodynamically feasible. If the free energy changes are unevenly distributed, as illustrated by the blue curve in Figure 5a, it follows that not all steps will acquire negative free energy changes at 1:23 V. The potential at which all the free energy changes for all steps become negative is the minimum electrode potential required to make the reaction proceed, and its value relative to the null potential may be considered a “thermodynamic overpotential.” In other words, a step that has a free energy change larger than 1.23 eV will need an overpotential larger than 0 V to have its change in free energy become negative. The last step for which the free energy change becomes negative is referred to as the potential-determining step (PDS).
The highest OER catalyst activity is thus achieved when the free energies for the different reaction steps are all equal (1.23 eV). In calculations not involving an explicit mapping of the reaction surface, the PDS is calculated rather than the rate-determining step and in some ways plays the role of the latter. In this picture, the role of the catalyst is to provide the best possible distribution of free-energy steps for the OER. However, a prominent finding from the theoretical work is that the energies for the adsorbates at catalyst surfaces are subject to so-called scaling relations, i.e., the binding energies of the S-Oad, S-OHad, and S-OOHad are linearly related.[ 88 ] This implies that the free energy changes associated with the various steps in the mechanism cannot be varied independently. As a consequence, the scaling relations suggest that the OER activity is correlated with a single descriptor. The descriptor can be an experimental parameter or a computed property, such as the calculated binding energy of adsorbed oxygen S-Oad.[ 88 ]
Since the free energy ΔG0 HOO* of the S-OOHad level (the free energy of the products of the reaction (8)) was found to be larger than that of the S-OHad level, ΔG0 OH* (the free energy of the products of the reaction (10)) by a constant value (of 3.2 eV) for a large number of oxide surfaces, this leads to the conclusion that the PDS is either step (9) or (10). As argued in Ref. Equation (8),[ 91 ] this implies that ΔG0 O*−ΔG0 OH*, in which ΔG0 O* is the free energy of the Oad level, is a unique descriptor for the OER activity. An illustration of the correlation between activity and this descriptor is given in Figure 5b).
While the scaling relations have the advantage that they simplify the rationalization and may narrow down the search space for new catalysts, they also have a consequence that they limit catalyst efficiency. This has led to efforts aimed at designing catalysts that break the scaling relations. Since the adsorbates are the same in the two preceding reaction schemes for acid and alkaline solutions, one would expect the energetics and hence the PDS computed from the mechanisms in acid solutions to be somehow relevant also for the alkaline case. This has been shown explicitly by Liang et al.[ 95 ] the free energy for each step calculated at 0 V versus SHE for the acid solution is the same as the free energy that would be calculated for each step at 0 V versus the reversible hydrogen electrode (RHE). The implication is that the PDS of reactions (12) through (15) can be inferred from corresponding calculations in acid solutions.
While theoretical calculations used to rationalize and optimize catalytic activity for the OER are immensely useful, it is sometimes desirable to translate these into more simply accessible descriptors. A particularly appealing example is the descriptor based on the number of e.g., electrons in metal oxides,[ 68 ] Figure 5c); the number of these electrons directly determines the balance of bonding to antibonding states for adsorbates at the oxide surface as explained by Vojvodic and Nørskov.[ 96 ] A volcano plot of Ni-based double hydroxides (DHs) with a series of dopants for OER in alkaline media was proposed by Koper and Calle-Vallejo[ 93 ] in Figure 5d,e where Fe and Mn have nearly optimum binding energy and thus decrease the OER overpotential compared to pure NiOOH.[ 93 ] Taking an entirely different approach, Hong et al.[ 97 ] analyzed trends in the catalytic activity of 51 perovskites statistically and in terms of 14 descriptors. While single descriptors were found to perform poorly, the number of d-electrons was still found to be an important factor for determining catalytic activity along with the charge-transfer energy (the difference in transition-metal and oxygen electronegativities) in the oxide.
3.2 Approaches to OER Catalyst Design
The promising strategies to develop OER electrocatalysts are summarized as follows: 1) Doping: doping other elements into the OER electrocatalysts structure can optimize the binding strength of OER intermediates and hence the activity. For example, doping Ni with Fe tunes the OER intermediate binding strength and enhances the OER performance.[ 89 ] 2) Transition metal oxides (TMO), sulfides (TMS), nitrides (TMN), phosphides(TMP), and borides (TMBs) as in Figure 5f)[ 28, 98 ] have shown also good activity toward the OER.[ 89, 99 ] For TMBs, the presence of boron with nickel affects Ni–Ni atomic order and interatomic distances (strain effect) which reduces the activation energy for oxygen evolution and enhances OER activity.[ 100 ] The performance of oxides, phosphides, and selenides has been summarized by Plevová et al,[ 95 ] see Figure 5g. 3) Placing catalyst on conductive support: the conductive support expedites charge transfer.[ 66, 101 ] NiFe layered double hydroxide supported on carbon nanotubes shows significant OER activity enhancement compared to bare NiFe layered double hydroxide.[ 102 ] Carbon is not recommended as OER support as it is susceptible to degradation through corrosion by oxidation at the high applied potentials relevant to the anode or nucleophilic OH− ions in alkaline media.[ 103, 104 ]
4 Electrochemistry of Nickel
Nickel-based catalysts are widely studied as catalysts for HER and OER in alkaline and AEM electrolysis, so an understanding of the electrochemistry basis of nickel is essential for proper analysis of the results and challenges of these electrolysis systems. We will divide the discussion of nickel electrochemistry to three potential regions in Figure 5: low potential region [E < 0 V], intermediate potential region [0 < E ≤ 0.5], and high potential region [0.5 < E ≤ 1.55].
4.1 Low Potential Region [E < 0 V]
Hall et al. showed that at negative HER potentials, NiO x and α-Ni(OH)2 get reduced to Ni, while β-Ni(OH)2 formed at more positive potentials can be reduced at more negative overpotentials.[ 106 ] Voltammograms recorded at the Ni electrode and their activity for the HER depend on the degree to which the surface is covered with NiO or β-Ni(OH)2.[ 107 ] Oxide and hydroxide species at nickel surfaces can form through thermal, chemical, and electrochemical oxidation.[ 44, 107, 108 ]
4.2 Intermediate Potential Region [0 < E ≤ 0.5]
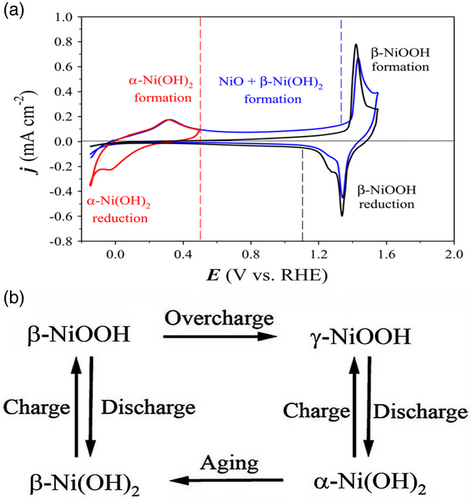
The existence of the Ni-OHad intermediate existence may be inferred from cyclic voltammograms for nickel.[ 109 ] Ni(OH)2 may also form in the air; in the presence of humid air, Ni will be oxidized with the formation of a thin atomic layer of NiO. The air-formed oxide NiO may be transformed further to Ni(OH)2 in the presence of humidity forming a multilayer Ni/NiO/Ni(OH)2.[ 110, 111 ]
4.3 High Potential Region [0.5 < E ≤ 1.55]
The transformation of Ni(OH)2 to NiOOH can be followed by in situ Raman spectroscopy.[ 116 ] Above 1.5 V, the OER will dominate.
5 Evaluation of Catalytic Activity
Catalytic activity may be evaluated either by the electrode potential at which the reaction commences (the onset potential) or the electrode potential required to achieve a certain current density. The onset potential can be defined as the potential at which the cathodic currents exceed a certain magnitude, either in terms of an absolute value or in terms of the relative increase above the double layer current.[ 117 ] In practice, the onset potential is difficult to define, and most published works employ the current at a certain potential to define electrocatalytic activity. The overpotential at 10 mA cm−2 current density (which corresponds to the current density of a solar water-splitting device with 12.3% efficiency) is emerging as a standard current density at which most catalysts are compared, Figure 7a.[ 27, 28 ] The usage of such benchmarking merits for HER and OER electrocatalysts provides an identification method of catalyst performance trends.[ 118 ]
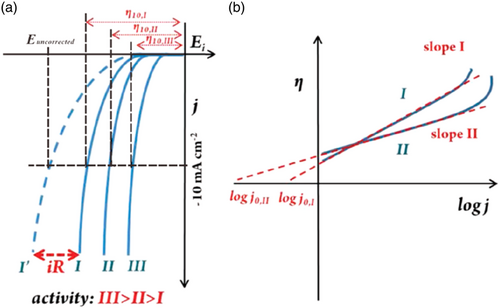
In addition to the performance at a given current density, the increase in electrode potential required for a given rise in current is an important parameter and is expressed by the Tafel slope as defined in Equation (2). Tafel slopes can be obtained by the following four methods: 1) From polarization curves; plots of potential versus the logarithm, usually to the base 10, of the current density (Tafel plots).[ 27, 28 ] The Tafel slope is determined by fits of Equation (2). to any straight region in the plot as in Figure 7b. At high potentials, problems related to bubble formation and gas blanketing or uncompensated resistance may cause deviations from a straight line.[ 27 ] but may also be the result of the reaction mechanism itself. The discrimination between these causes upward bending is discussed in Reksten et al.[ 79 ] 2) From fitting the data to more complete expressions for the potential–current relation than Equation (2) and extracting the Tafel slopes from the limiting forms of the expressions, see, for example, Reksten et al.[ 79 ] 3) From the Tafel slopes calculated from electrochemical impedance spectroscopy through fitting plots of the logarithm of the inverse of the charge transfer resistance R ct, i.e., 1/R ct, versus electrode potential.[ 27, 28 ] 4) From the Tafel impedance, defined as the impedance multiplied with the steady-state current density at which the impedance was recorded.[ 119 ] The Tafel slope for the reaction can be found from the diameter of the impedance arc.[ 120 ]
The Tafel slope is an intensive parameter and does not depend on the surface area of the catalyst, unless issues relating to porosity are involved, in which case the apparent slope may be affected by a non-uniform current distribution in the electrode.[ 121 ] In recent literature, the current range over which the data comply with Equation (2) is often not required to be extensive. Frequently one finds Tafel plots extending over merely a fraction of a decade, and even on this scale not being convincingly straight. The authors of this review do not recommend such a practice. For an excellent example of evaluation of a Tafel slope, see A. Damjanovic et al.[ 122 ]
Unless the catalytic activity is assessed through the potential at a given current density (for example 10 mA cm−2) as explained above, the exchange current density (j) is required for a complete assessment of the catalytic activity and depends on catalyst composition, surface state, electrolyte composition, and temperature. When j 0 is large, a small change in η leads to a large variation of the current indicating little or no activation barrier to the reaction. When j 0 is very small, a large η is required to alter the current indicating a high activation barrier and low electrode process rate.[ 36 ] The exchange current density can be estimated by extrapolating the linear section of Tafel plots to the x-axis at which η (η = E−E 0) is zero, and the intercept gives the exchange current density, j 0.[ 36 ] The j 0 corresponds to the electrochemically active surface area and the large J 0 indicates more exposed active sites and faster HER kinetics.[ 27 ]
5.1 Overview of HER and OER Catalyst Performance
The activity of the most successful examples of non-PGM HER catalysts, some of which are listed in Table 2 , appears to be due to a combination of hydrogen binding energy or bifunctional mechanisms such as NiMo and Ni–Ni(OH)2.[ 54, 57 ] However, the bifunctional mechanism has been criticized on various grounds[ 50, 52 ] whereas it is quite clear from DFT calculations[ 123 ] and experimental results[ 107 ] that the Gibbs free energy for hydrogen binding to the surface increases for oxidized Ni surfaces.
| Catalyst | Electrolyte | Overpotential (η) required to achieve a current density of 10 mA cm−2, [mV] | Reference |
|---|---|---|---|
| NiMo | 1 M KOH | 185 | [124] |
| CoP/CC | 1 M KOH | 250 | [125] |
| NiS2 NSs/graphite | 1 M NaOH | 190 | [126] |
| NiFe LDH/NF | 1 M NaOH | 210 | [127] |
| Ni3S2/NF | 1 M KOH | 223 | [128] |
| Ni/NiS | 1 M KOH | 230 | [129] |
| Co2B-500/NG | 1 M KOH | 230 | [130] |
| Co NPs@N-CNTs | 1 M KOH | 370 | [131] |
| Ni2P | 1 M KOH | 220 | [132] |
| NiCoFe LTHs/CFC | 1 M KOH | 200 | [133] |
| MoB | 1 M KOH | 225 | [134] |
| MnNi/C | 1 M KOH | 360 | [135] |
| CoO x @CN | 1 M KOH | 230 | [136] |
| Ni0.9Fe0.1/NC | 1 M KOH | 230 | [137] |
| MoNiNC | 0.1 M KOH | 110 | [138] |
| NiFe/NiCo2O4/NF | 1 M KOH | 105 | [139] |
| Mo2C | 1 M KOH | 250 | [140] |
| Graphite-MoP | 1 M KOH | 260 | [141] |
| MoP | 1 M KOH | 246 | [142] |
| Ni3S2 nanorod/NF | 1 M KOH | 200 | [143] |
| Ni(OH)2/NF | 1 M KOH | 298 | [144] |
| Ni/NiO(OH)/NC | 1 M KOH | 190 | [145] |
| NiFe-NCs/CFP | 1 M KOH | 197 | [146] |
| MoNi4/MoO2/NF | 1 M KOH | 15 | [147] |
For OER, the catalytic activity depends on composition, electronic configuration, oxidation states, intermediate bond strength in the elementary steps, and stability of the oxides/hydroxides under alkaline pH conditions,[ 75 ] which are of course interrelated. Ir oxide is considered the state-of-the-art OER electrocatalysts and is often used as a basis for comparison. For example, IrO x has an overpotential of 320 mV at a current density of 10 mA cm−2 in 1 M NaOH.[ 89 ] Transition metal catalysts show good stability and activity in the alkaline media (pH = 14) and high anodic potential as in Table 3 .[ 28, 148 ] However, more investigation of the OER catalyst activity and stability under AEM conditions is warranted, especially for Ni-based catalysts.
| Catalyst | Electrolyte | Overpotential (η) required to achieve a current density of 10 mA cm−2, [mV] | Reference |
|---|---|---|---|
| NiFe-LDH | 0.1 M KOH | 350 | [149] |
| Fe-doped Co3O4 | 1 M KOH | 380 | [150] |
| FeO x /CFC | 1 M KOH | 416 | [151] |
| Ni-10 at% CoO x | 1 M NaOH | 325 | [152] |
| NiCo2O4 nanowire | 1 M NaOH | 320 | [153] |
| Fe-doped NiO x | 1 M KOH | 310 | [154] |
| NiFe2O4 QDs | 1 M KOH | 262 | [155] |
| NiFe-OH/NiFeP | 1 M KOH | 270 | [156] |
| Ni–P nanoplate | 1 M KOH | 300 | [157] |
| NiCo LDH | 1 M KOH | 367 | [158] |
| NiFe-LDH-CNTs | 1 M KOH | 250 | [102] |
| NiFeCu | 1 M KOH | 180 | [159] |
| p-Cu(3−x)nNi(3−y) | 1 M KOH | 280 | [160] |
| IrNix | 0.1 M KOH | 290 | [161] |
| CoP nanorods/C | 1 M KOH | 320 | [162] |
| NF@Ni/C-600C | 1 M KOH | 265 | [163] |
| NiRu-LDHs | 0.1 M KOH | 210 | [164] |
| Fe-Ni3S2/NF | 1 M KOH | 310 | [165] |
| 3D-NiCoP-CC | 1 M KOH | 242 | [166] |
| NiCoP/NF | 1 M KOH | 280 | [167] |
| Cu2O-Cu-foam | 1 M KOH | 350 | [168] |
| NiFe-Se | 1 M KOH | 240 | [169] |
| Ni shaped | 1 M KOH | 383 | [170] |
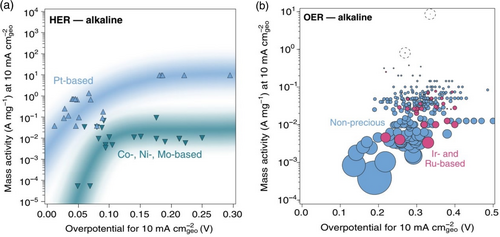
To evaluate and compare the catalytic activity of OER and HER and the potential for scalability, catalyst stability and activity per unit mass should be considered. The mass activity concept shows that some catalysts may approach the activity of PGM catalysts measured per geometric area at the expense of a high catalyst loading, which severely lowers the mass activity. Also, some high active catalyst is more prone to degradation but this needs more investigation.[ 171 ] Figure 8 shows a comparison of mass activity and overpotential for HER and OER in alkaline electrolysis.[ 172 ]
6 Surface Area Determination
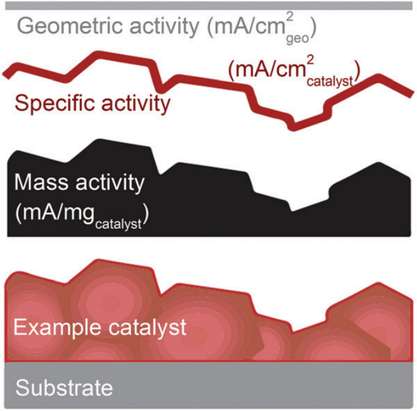
For comparing different catalysts, some normalization is desirable. Catalyst activity may be normalized with respect to geometric surface area, catalyst mass, and, in some sense, the actual catalyst surface area. The current normalized to geometrical surface area is widely used. However, the utility of normalizing with respect to the geometric area is ultimately limited since, from a cost perspective, the sheer amount of a cheap and inactive catalyst that would be required to compensate for its low activity might ultimately absorb the profit of using it in the first place.[ 172 ] Also, due to nonuniform reaction rates electrode,[ 121 ] one might expect diminishing returns of squeezing ever more catalyst into the catalytic layers, leading to practical problems of achieving the required loading to achieve desired performance per geometric area. This perspective may, therefore, favor employing an activity normalization based on mass. However, for catalyst development, the activity per real surface area (and thus the turnover frequency) is desirable. The definitions of geometric, specific, and mass activity are illustrated in Figure 9 .[ 173 ]
Normalizing the current by assessing the real (“microscopic”) surface area is thus very useful in electrocatalyst research.[ 112 ] Available methods are the Brunauer–Emmett–Teller (BET) surface-area determination or the electrochemical surface area (ECSA).[ 118, 174 ] The difference between ECSA and BET is that all of the sites in the BET surface area determined by gas adsorption and desorption may not be electrocatalytically active, and differences will occur if, for example, part of the catalyst is not electrically connected.[ 175 ] The ECSA-normalized data may thus be taken as a better representation of the intrinsic surface area of the catalyst in contact with the electrolyte.[ 118, 174, 176 ]
Several authors have pointed out a relation between stability and activity;[ 29, 30 ] Binninger et al.[ 30 ] have shown that if lattice oxygen is involved in the OER, then the bulk metal-oxide may not be stable at the potentials of the OER.
7 Approaches for Determining the Surface Area
7.1 Surface Redox Reaction
The cyclic voltammetry (CV) peaks of oxidation/reduction of metal oxides/hydroxide are used frequently to quantify the ECSA assuming that the Coulombic charge of metal (hydro) oxide oxidation/reduction corresponds to the electrochemically active surface sites.[ 173 ]
Several hydroxides such as cobalt,[ 179 ] iron,[ 180 ] and copper[ 181 ] hydroxide charge have also been used in combination with Ni(OH)2 to evaluate ECSA of bimetallic Ni-based catalysts. ECSA determination using CV combined with XPS to determine the total surface area of nickel (metallic and oxidized).[ 182 ] The disadvantages of evaluating the ECSA based on integrating voltammograms include: 1) correction for the charge from background currents from double-layer charging is necessary, 2) correcting for the presence of metals other than Ni is difficult, 3) contributions from subsurface atoms to the measured charges would lead to an overestimate of the surface area, 4) any significant coverages of oxygenated species may lead to erroneous values of the surface area, and 5) the assumption of monolayer formation may break down. The latter difficulty has been circumvented in the oxalate-based method of Hall et al.[ 183 ] in which additions of oxalate to the solution limit the formation of only one monolayer.
7.2 Double-Layer Capacitance
Computing the surface area based on the double-layer capacitance represents the probably most popular method for the determination of the catalyst ECSA. CVs are carried out in N2 or Ar-saturated KOH electrolytes at various scan rates (for example, 10, 20, 50, 100, and 200–400 mV sec−1) in a non-Faradaic potential window. The double-layer capacitive current (Ic) is plotted against the scan rate υ, giving a straight line The double-layer capacitance Cdl can be found from the slope of this straight line, and is converted to ECSA via a specific capacitance.[ 173 ] The double-layer capacitance can be measured also by electrochemical impedance spectroscopy (EIS) within the same non-Faradaic region. The C dl values measured by EIS and CV typically agree to within 15%. A large double-layer capacitance indicates a large number of active sites.[ 173 ] The double-layer method cannot deduce whether the capacitance is purely due to double-layer charging or due to the adsorption of charged species. Values for specific capacitances of various bi and trimetallic combinations are lacking, and there is also significant uncertainty in the reported values.[ 121, 173 ]
7.3 Atomic Force Microscopy
Atomic force microscopy (AFM) can be used to evaluate surface roughness, but is in practice limited to the surface areas of thin metal oxides with fairly well-defined surfaces and low roughness.[ 173 ] The surface area can be estimated from the roughness factor determined by AFM and the geometric surface area of the sample.
7.4 Electron Microscopy
7.5 BET
BET surface area is an alternative to estimate the specific activity of catalyst powders. The BET method uses the isothermal gas physical adsorption on a solid surface to measure the material-specific surface area.[ 173 ]
As can be seen from the above, every method for surface area determination has advantages and drawbacks, and no unique, general method appears to exist. However, comparing surface areas and trends in these observed by employing different methods in combination may instill some confidence in the results. It has, for example, been observed for some catalysts that the BET surface area follows the same trend as the Coulombic charge under the redox peak and the CDL. Hence, it's recommended to report both ECSA and BET so surface areas and specific activity can be considered.[ 118, 174, 176 ]
8 Catalyst Stability
For practical applications and commercial use, the assessment of catalyst long-term stability is essential. The catalyst activity may deteriorate through catalyst dissolution, particle coalescence (catalyst agglomeration), Ostwald ripening,[ 184 ] support corrosion, adsorption of ionomer moieties, and chemical degradation of the ionomer.[ 185 ] The stability can be assessed using CV, potential–time chronoamperometry curve, or current–time chronopotentiometry curve. The stability assessments using cyclic voltammetry have been carried out by comparing the polarization curves before and after continuously cycling the catalyst for 500–10 000 cycles. The durability of the catalyst is assessed from the shift of the potential at a constant current density (commonly 10 mA cm−2).[ 27, 28, 186 ] At industrial water electrolyzers’ higher current density (0.5–2 A cm−2) is also considered and the change in stack voltage is used as an indicator for stack stability for several thousands of hours before being deployed in commercial products. chronoamperometry and chronopotentiometry, less change in voltage or current during testing time indicate better stability. The stability measurements can be coupled online to an inductively coupled plasma mass spectrometer (ICP-MS) to measure the metal dissolution rate directly.[ 187, 188 ] Yang et al. found that Ni-based crystalline OER catalysts, surface degradation depends on the pH and is greater than the rate for surface reconstruction, while amorphous Ni oxyhydroxide catalyst is more stable and pH-independent.[ 149 ] Several authors have pointed out a relation between stability and activity;[ 189, 190 ] Binninger et al.[ 189 ] have shown that if lattice oxygen is involved in the OER, then the bulk metal-oxide may not be stable at the potentials of the OER.
9 Membranes
The AEM, consisting of an anion exchange cationic group and in or attached to a polymer backbone, is a major component that determines the AEM electrolyzer performance and durability.[ 13, 191 ] We assume here that in the application of AEM water electrolysis the membrane is in a form that primarily conducts OH−, although membranes conducting other anions are generally included in the concept.[ 14 ] In the current context, the AEMs are polymer electrolytes that transport (OH−) anions, moving through the membrane and being electrostatically compensated by cationic groups.[ 13, 191 ]
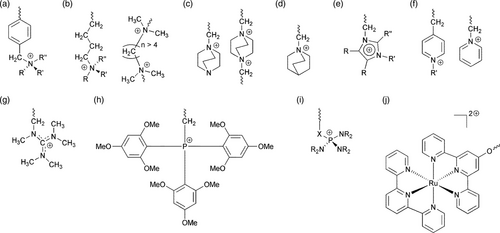
The mechanical and thermal stability depends primarily on polymer backbone chemistry, while the ion exchange capacity, ionic conductivity, and transport depend on the cationic functional groups. The chemical stability of AEMs depends on both the polymer backbone and the functional groups. The polymer backbone is usually a polysulfone, crosslinked polystyrene with divinyl benzene (DVB), or polyaromatics. The cationic functional (ion exchange) groups are generally quaternary ammonium (QA) or imidazolium (IM). Figure 10 shows some AEM cationic head-groups in AEM electrolysis. Table 4 summarizes the AEM properties of selected commercial membranes.[ 16, 192 ]
| Membrane | Polymer backbone | Cationic groups | Ionic exchange capacity (IEC), [mmol g−1] | Conductivity, [mS cm−1] |
|---|---|---|---|---|
| A-201 Tokyama | Linear hydrocarbon | Quaternary ammonium (QA) | 1.7 | 42 |
| FAA-3-PK-130 | Polyaromatic | 1.1–1.4 | 4–8 | |
| FAA-3-PE-30 (this work) | Polyaromatic | 1.4–1.6 | 1.5–2.0 | |
| qPVB/OH− | Polystyrene | – | 16 | |
| xQAPS | Crosslinked polysulfone | 1.3 | 15 | |
| PSF-TMA/OH− | Polysulfone | 1.8 | 8 |
10 Ionomer
Anion exchange ionomers (AEIs) are polymers that conduct anions (OH−) through positively charged cationic groups covalently bonded to a polymer backbone.[ 13 ] The ionomer in catalyst inks acts as a stabilizing and binding agent to boost ink uniformity and coating quality.[ 192, 193 ]AEIs are therefore binders that create OH− conductive transport pathways within the catalyst layer.[ 191 ] The ionomer ionic conductivity is improved by increasing the number of ion-exchange groups which in turn increases the water uptake and causes ionomer dissolution at higher temperatures.[ 191 ] The ionomer should have good OH− conductivity, chemical stability, a low swelling ratio, be water-insoluble, and have a high solubility and dispersibility in solvents.[ 192, 193 ] Table 5 summarizes the AEI properties used in the literature.
| Ionomer | Backbone | Functional groups | Ionic exchange capacity (IEC), [mmol g−1] | Conductivity, [mS cm−1] |
|---|---|---|---|---|
| AS-4 | Linear hydrocarbon | Quaternary ammonium (QA) | 1.4 | 13 |
| Fumion FAA-3 | Polyaromatic | 1.4 | 8 | |
| qPVB/OH− | Polystyrene | – | 16 | |
| xQAPS | Crosslinked polysulfone | 1.3 | 15 | |
| PSF-TMA/OH− | Polysulfone | 1.8 | 8 |
AEMs should possess a high OH− conductivity and be stable under alkaline, oxidative conditions, display good thermal stability, have good mechanical properties, and have low gas permeability, which is challenging to achieve.[ 192, 194, 195 ] The AEMs tend to have lower ionic conductivity than PEMs of similar ion-exchange capacity (IEC) due to hydroxide mobility being approximately one-half of that of protons.[ 192, 195 ]
AEMs thus employ polymers with higher ion-exchange groups to increase their ionic, in this context, hydroxyl, conductivity. A high ion exchange capacity leads to a high water uptake, which reduces mechanical properties such as strength and stability and resulted in a high swelling ratio.[ 12, 18, 196 ]
The hydroxide ions themselves pose a problem for the chemical stability of AEMs during electrolyzer operation at high potential and pH, crucial to maintaining the system performance.[ 197, 198 ] Hydroxide ions and free radicals may attack both the cationic group and polymer backbone and lead to unstable AEMs.[ 197, 198 ] Quarternary ammonium ions are susceptible to attack by strong bases such as hydroxide ions, resulting in an elimination reaction (Hoffmann elimination) and the formation of amines and alkenes.
Hydroxide ions may also engage in a nucleophilic attack on α-carbon through an SN2 mechanism, and lead to amine and alcohol formation. Finally, degradation through ylide formation involves in α-hydrogen abstraction leads to amine and water formation.[ 197, 198 ] Other degradation mechanisms have also been recently identified such as the electrochemical oxidation of the adsorbed phenyl group (in the polymeric ionomer) on oxygen evolution catalysts.[ 199 ]
The stability of a membrane in AEM electrolyzers is demonstrated by maintaining a constant current density for a certain time while monitoring the cell voltage. The voltage increase will indicate membrane instability due to the degradation of the polymer backbone or the ion exchange groups.[ 194, 195, 200 ] Parrondo et al. reported on the stability of AEMs with imidazolium and quaternary benzyl ammonium groups and reported that the degradation could be from the polymer backbone or cationic groups loss.[ 191, 201, 202 ]
The OER and HER Ni-based catalyst–ionomer interaction, the oxidative and thermal stability of AEIs, and the degradation mechanisms in the presence of supporting electrolyte (KOH) are essential for reaching high-performance AEM electrolyzers.[ 18 ]
11 Anion Ionomer Catalyst Interaction
For HER, the adsorption of the anion ionomer significantly impacts the catalyst activity under high pH conditions. Catalyst ionomer interaction has been widely studied for Pt catalyst HER activity. The quaternary ammonium (QA) functional group responsible for OH− ion-exchange transport in AEMs poisons platinum surface via specific and/or covalent interaction and inhibits catalyst activity.[ 19 ] The blocking of surface sites becomes more significant as the alkyl chain length of organic electrolyte increases (tetramethyl < tetraethyl << benzyltrimethyl).[ 203 ] Benzyltrimethylammonium shows the greatest site-blocking effect due to the strong interaction of the benzyl group with the electrode surface.[ 203, 204 ]
In general, two specific adsorption processes are proposed for catalyst ionomer interaction, i.e., i) cumulative cation-hydroxide-water co-adsorption with a much higher concentration of the hydroxide molecules compared to water[ 205-208 ] and ii) noncumulative phenyl group physisorbed blocking the active sites of the catalyst.[ 209-211 ] Figure 11 shows the orientation of adsorbed ionomer components on the Pt surface.[ 209 ]

Bates et al. are the first to report the anion exchange ionomer effect on nickel-based HER catalysts,[ 19 ] However, there is a lack of literature on other studies dealing with this topic.
Nafion ionomer is frequently used to optimize catalyst inks for optimum activity as the alkaline electrolyte and the Nafion role is to promote ink uniformity and coating quality. The Nafion ionomer frequently resulted in electrodes with higher HER performance compared to AEIs such as Tokuyama AS-4.[ 19, 252 ] However, this depends on the catalyst, and Bates et al.[ 19 ] found that for Ni–Cr/C catalysts an AEI binder increased the performance as compared to Nafion.
The presence of the ionomer helps to distribute the electrochemical reactions more uniformly across the catalytic layer through increased OH− ionic conductivity and minimizing mass-transport limitations related to the diffusion of the ionic species.[ 193 ] For PEM water electrolysis the optimum Nafion ionomer content in the catalytic layer is ≈20 wt% of catalyst loading on a weight basis.[ 213 ] Recently, many studies have been carried out to explore the effect of anion exchange ionomer optimization on nickel or transition metal catalyst layers.[ 214 ]
For the OER, the decrease in activity upon exposure to anion-exchange ionomers can be rationalized considering the ionomer chemistry.[ 215, 216 ] This happens through adsorption of the phenyl group of the polymer backbone on the electrode and it further oxidized at the anodic potentials required for the OER to an acidic oxidation product (phenol group). The phenol group is located at the catalyst–ionomer interface, and cannot be easily removed from the interface. Finally, the phenol neutralizes ammonium hydroxide and reduces the local pH as in Figure 12 , and decreases the catalyst OER activity which is detrimental to the OER activity of Pt, IrO2, and perovskite catalysts.[ 177, 199 ] However, it should be noted that the OER itself will reduce the pH, see Equation (8) through (15).
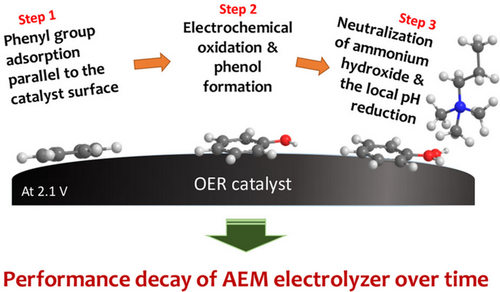
For electrolyzer anode catalyst layers, the ionomer content in the catalyst inks needs to be optimized to maximize activity through the establishment of efficient pathways for OH−, electron, and O2 transport.[ 215, 217 ] Further ionomer catalyst interaction and phenyl oxidation studies on OER activity in transition metal catalysts like nickel-based catalysts are of great interest for improving the activity and durability of AEM electrolyzers.
12 The Role of Aqueous Electrolyte
The AEM electrolysis performance depends on the electrolyte (KOH, NaOH, and K2CO3).[ 17, 18 ] Feeding the AEM electrolyzer with water only leads to inferior performance, presumably through inefficient OH− pathways in the catalytic layer.[ 17, 18, 218, 219 ] The best performance of 450 mA cm−2 at 1.8 V using water, platinum group metal catalysts, and higher operating temperatures.[ 5 ] KOH is commonly used as the electrolyte in AEM electrolysis although it is more expensive than NaOH, as KOH is more conductive (about 1.3 times) and chemically less aggressive than NaOH.[ 220 ] The KOH temperature and concentration are the major factors of cell and membrane conductivity.[ 221, 222 ]
Electrolysis performance enhances with increasing hydroxide electrolyte concentration due to the polarization resistance decreasing linearly with increasing electrolyte concentration.[ 218, 219, 223 ] The higher hydroxide concentration leads to a high corrosion rate and reduces the lifetime of electrolyzer components. Therefore, electrolyzer operation with lower KOH concentration and temperatures is an advantage. At low KOH concentrations, the cell resistance can be affected by the CO2 contamination of the KOH solution. (Bi)carbonate ions contaminate the AEM and decrease the ionic conductivity.[ 224, 225 ] The membrane resistance thus tends to be always higher in carbonate form than in hydroxide liquid solutions.[ 224 ]
Although using water as an electrolyte is desirable to make AEM electrolysis competitive. it brings significant new challenges because Ni has a negligible HER and OER activity in deionized (DI) water and since the AEM ionomer must preserve mechanical stability and ionic conductivity within the catalyst layer without poisoning and inhibiting catalyst activity.[ 199, 226 ]
Also, KOH electrolyte contaminations may affect the activity of Ni-based catalysts. The dramatic OER activity increase of aged Ni(OH)2/NiOOH is due to Fe impurities absorption and has disproven the theory that β-NiOOH is intrinsically more OER active than γ- NiOOH.[ 22 ] The adsorption energies for OER intermediates are optimized through the incorporation of Fe3+ into a NiOOH lattice and improve the kinetics for OER.[ 20, 22, 23 ] For Ni–Co catalyst, the OER activity increase in Fe contaminated compared to Fe-free KOH solutions[ 227, 228 ] and the Fe is incorporated into Ni(Co)O x H y affects the redox behavior of the Ni-Co cations.[ 229 ] NiO x H y films incorporate more Fe from the KOH solution than CoO x H y due to the higher tendency of NiO x H y to dynamically rearrange under OER conditions and allow more uniform Fe incorporation.[ 229 ] NiFeOxHy catalysts are 100-fold more active than NiO x H y .[ 231 ] The overpotential of the Fe-containing alloy is slightly affected by the purification procedure which shows that the Fe content in the catalyst bulk is beneficial for the OER activity when Fe solution impurities are absent.[ 23 ]
Boettcher et al.[ 22 ] found that Fe impurities in the KOH solution play an essential role in the activity enhancement of Ni-based OER catalysts. In situ Raman spectroscopy shows that Fe modifies the structure of the active phase (NiOOH) and promotes the transformation of Ni(OH)2 to NiOOH,[ 231 ] however Ni(OH)2 transformation to NiOOH is not directly relevant to the potential range of the HER. The presence of impurities in KOH electrolytes such as Fe has been reported to increase OER activity but no reports for the same effect for HER activity are available. A direct proof of the absence of the effects of iron on the HER linear sweep voltammetry (LSVs) comes from the fact that there is no noticeable change in HER activity in Fe-free KOH solution compared to non-purified KOH as showed by Shalom et al.[ 232 ]
13 Membrane Electrode Assembly Fabrication and Performance
The membrane electrode assembly (MEA) is a core component of the AEM water electrolyzer and is decisive for the electrolyzer's performance.[ 17, 18 ] The MEA specifications characteristics determine electrolyzer efficiency and catalyst utilization. The AEM electrolyzer performance, cost, and durability needed for scaling up and commercial implementation depend on the quality of the MEA.[ 9, 11 ]
For the electrochemical reactions to take place, water, hydroxyl ions, and electrons need to meet at the same location, for a water-fed MEA therefore involving three phases, viz. water, catalyst, and ionomer. The quality and stability of the ionic contact of the three-phase boundary (TPB) region of the electrode are vital to increasing the maturity of AEM electrolysis. The ionic contact is especially important when moving towards lower concentrated electrolytes and DI-water systems. The ionomer in the electrode acts both as a mechanical binder for the catalyst particles and as an ionic contact between the catalyst and the membrane. If ionic pathways in the TPBs are not designed properly, either due to the lack of suitable ionomers or due to non-ideal catalyst ink formulations, the area-specific resistance (ASR) will be too high, and the performance will be inferior.[ 233 ]
The MEAs are fabricated either via the catalyst-coated membrane (CCM) method or the catalyst-coated substrate (CCS) method, as shown in Figure 13 .
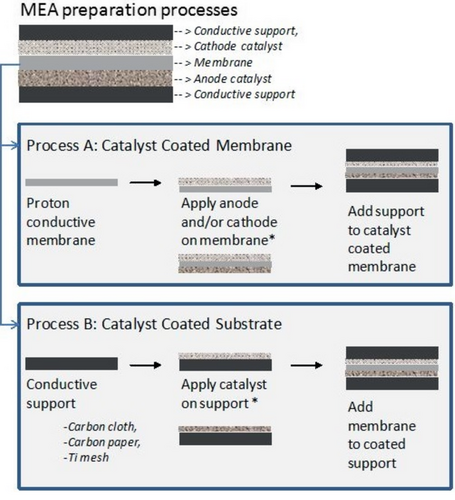
In the CCM process, the HER/OER catalyst ink [the catalyst mixed with solvents (water, organic solvents), and ionomer binder] is coated onto AEM sides of the AEM using spray or coating techniques.[ 15, 213, 234, 235 ] Assembling the CCM in the cell hardware with the Ti/Ni felt anode PTL, membrane, and carbon paper cathode GDL to form a full MEA.[ 9, 11 ]
The advantages of the CCM include catalyst contact with AEM, efficient catalyst utilization, improved ionic conductivity, and process efficiency.[ 236, 237 ] In contrast, the electrical contact between the current collectors and MEA is worse.[ 236, 237 ] Finding a suitable anion ionomer is a key step to scale up the CCM approach in AEM electrolysis.[ 236, 237 ] The degradation of CCM-based MEA in the literature is related to the delamination of the catalyst layer, membrane, ionomer degradation, and corrosion of anode components at cell voltage above 2 V.
In the CCS method, the anode and cathode catalyst ink is coated onto the surface of the anode porous transport layer (PTL) and cathode GDL, respectively.[ 7, 9, 11 ] The anode and cathode CCS and the AEM, and are assembled in the cell hardware to obtain a full MEA. The advantage of CCS includes the stability of the catalyst layer, efficient electron transfer, and removal of gaseous products.[ 7, 9, 11 ] Several substrate materials such as Ti felts, stainless steel felt, or Ni foam/felt can be used as anode substrate. Carbon cloth or paper, as well as Ni, are reported as cathode substrates.[ 7, 9, 11 ] Ni and Ti materials are considered stable anode support in alkaline water electrolysis.[ 7, 9, 11, 17 ]
Table 6 summarizes the MEA performances and corresponding MEA specifications reported in the literature. The performance of AEM water electrolyzers depends on the MEA fabrication method, ink constituents, catalyst loading, AEM, and ionomer type and content. Although the CCM enables more efficient catalyst utilization, the CCS is the main MEA production process for AEM water electrolysis. Research in the literature reported high performance of alkaline electrolyzers obtained using very high mass loading (50 ± 10 mg cm−2) of Ni catalysts[ 238 ] however, maintaining the superior activity of these systems is questionable.[ 238 ] Promising results of 1 A cm−2 at 1.9 V for non-PGM performance in 1M KOH at 60 °C using NiCoFe/NiFe2O4 were achieved by Dioxide Materials Inc.[ 219, 239 ] The MEA applications have demonstrated that non-PGM catalysts can bring the HER activity within 100 mV of PGM catalysts at equivalent current densities (102−104).[ 18 ] Ionomer interaction in Ni-based electrodes during HER and OER reactions is crucial to developing a stable and active cathode/anode electrocatalyst for AEM water electrolysis.
| Activity | Electrolyte | Membrane | Ionomer | Anode | Cathode | Ref | ||
|---|---|---|---|---|---|---|---|---|
| Material | PTL | Catalyst | PTL | Catalyst | ||||
| 1.4 A cm−2 at 1.9 V | 1 M KOH at 25 °C | n/a | none | Stainless steel (SS) mesh | Cu0.7Co2O4 | Stainless steel mesh | 20 wt% Pt/C | [240] |
| 1.9 A cm−2 at 2.3 V | 4 M NaOH at 60 °C | ITM Power membrane | – | SS mesh |
Ni/Fe 9:1 oxide |
SS mesh | Pt | [241] |
| 0.9 A cm−2 at 2 V | 1 M KOH at 50 °C | Tokuyama A201 | Tokuyama AS-4 | Ti foam | IrO2 | Toray CP (H-120) | Pt black | [237] |
| 0.6 A cm−2 at 2 V | 1 M KOH at 70 °C | LDPE-PEG- PPG-ANEX | qPPO | Nickel foam (NF) | NiCo2O4 | NF | Pt/C | [224] |
| 2 A cm−2 at 1.7 V | 1 M KOH at 60 °C | Sustainion X37- 50 | Nafion | Sigracet 39 | IrO2 | Sigracet GDL (39BC) | Pt | [239] |
| 1.15 A cm−2 at 2.25 V | 1 M NaOH at 20 °C | LDPE-g-VBC- TMA | PSEBS-CM- TMA | Ti fiber felt | NiCo2O4 | Carbon GDL + MPL | 20 wt% Pt/C | [242] |
| 0.2 A cm−2 at 2 V | Water at 25 °C | n/a | none | SS mesh | Cu0.7Co2.3O4 | SS mesh | 20 wt% Pt/C | [240] |
| 0.8 A cm−2 at 2 V | Water at 50 °C | Tokuyama A201 | Tokuyama AS-4 | Ti foam | IrO2 | Toray CP (H-120) | Pt black | [237] |
| 0.3 A cm−2 at 2.2 V | Water at 40 °C | LDPE-g-VBC | n/a | Toray CP (H-090) | CuMnCo O4 | Toray CP (H-090) | 50 wt% Pt/C | [234] |
| 0.65 A cm−2 at 2.2 V | Water at 50 °C | PSF-TMA | PSF- TMA | Porous electrode | Pb2Ru2O6.5 | Sigracet CP (10BC) | Pt black | [201] |
| 0.1 A cm−2 at 2 V | 0.5 M Na2CO3 at 70 °C | LDPE-PEG- PPG-ANEX | qPPO | NF | NiCo2O4 | NF | Pt/C | [224] |
| 0.5 A cm−2 at 2 V | Water at 50 °C | Tokuyama A201 | Tokuyama AS-4 | GDE | Platinum group metals | GDE | Platinum group metals | [15] |
| 1 A cm−2 at 2 V | 0.1 M NaOH at 60 °C | LDPE-g-VBC- TMA | PSEBS-CM- TMA | Ti fiber felt | NiCo2O4 | Carbon GDL + MPL | 20 wt% Pt/C | [242] |
| 0.7 A cm−2 at 1.95 V | Water at 70 °C | xQAPS | xQAPS | Ni infiltrated NF | Electroplated Ni/Fe | SS fiber felt | Ni/Mo | [5] |
| 0.3 A cm−2 at 2.3 V | Water at 50 °C | mm-qPVBz/Cl- | qPVB/Cl- | SS mesh & CFP | Cu0.7Co2.3O4 | SS mesh & CFP | Ni | [243] |
| 0.6 A cm−2 at 2.4 V | Water at 22 °C | “Cranfield membrane” | QPDTB | SS mesh | Cu0.7Co2.3O4 | SS mesh | Ni | [244] |
| 0.6 A cm−2 at 2.2 V | 1 wt% K2CO3 at 45 °C | LDPE-g-VBC- DABCO | Tokuyama AS-4 | Sigracet CP (25BC) |
ACTA SpA catalyst |
Sigracet CP (25BC) |
ACTA SpA catalyst |
[245] |
| 0.3 A cm−2 at 2.1 V | Water at 45 °C | Cranfield membrane | QPDTB-OH− | SS mesh | Li0.21Co2.79O4 | SS mesh | Ni | [235] |
| 0.6 A cm−2 at 2 V | 1 wt% K2CO3 at 55 °C | Tokuyama A201 | 10 wt% PTFE | NF | CuCoOx (ACTA 3030) | Cetech CC + MPL | CeO2-La2O3/C (ACTA 4030) | [246] |
| 0.65 A cm−2 at 1.85 V | 1 M KOH at 43 °C | Tokuyama A201 | 10 wt% PTFE | NF | CuCoO x (ACTA 3030) | Cetech CC + MPL | CeO2-La2O3/C (ACTA 4030) | [246] |
| 0.3 A cm−2 at 1.88 V | 1 M KOH at 70 °C | Tokuyama A201 | – | CP | Electroplated Ni | CP | Electroplated Ni | [247] |
| 0.2 A cm−2 at 2 V | 10 wt% KOH at 50 °C | PSU-DABCO | 20 wt% PTFE | NF | NiCo2O4 | NF | – | [248] |
| 2 A cm−2 at 2 V | 1 M KOH at 60 °C | Sustainion X37- 50 | Nafion | SS fiber felt | NiFe2O4 | Carbon GDL | NiFeCo | [239] |
| 0.15 A cm−2 at 2 V | 15 wt% KOH at 40 °C | PSEBS-CM- DABCO | PSEBS- CM-DABCO | NF | NiCo2O4 | NF | NiFe2O4 | [223] |
| 0.5 A cm−2 at 1.95 V | 1% K2CO3 at 60 °C | A-201 membrane | Octa ionomer | NF | CuCoOx | microporous carbon paper | (Ni/(CeO2 −La2O3)/C | [218] |
| 1.5 A m−2 at 1.9 V | 1M KOH at 50 °C | FAA-3-50 | Titanium-based (Ti-GDL, | IrO2 | carbon-based (C-GDL) | Pt/C | [249] | |
| 0.5 A cm−2 at 2.29 V | 1M KOH at 50 °C | nonreinforced FAA-3 membranes |
A Pt-coated titanium frit |
IrO x | Carbon paper (Toray 090 | Platinum black | [250] | |
| 0.5 A cm−2 at 2.05 V | 1% K2CO3 at 50 °C | Tokuyama-A201 | Nafion and Tokuyama ionomer | Ti mesh | NiFe/Raney | Toray paper | NiCr/c | [251] |
| 1.7 A cm−2 at 1.8 V | 24 wt% KOH at 80 °C | polybenzimidazole membranes | – | perforated Ni sheets. | Ni-Al | perforated Ni sheets | Ni-Al-Mo | [252] |
| 0.9 A cm−2 at 2 V | 1 M KOH at 60 °C | Sustanion membranes | Nafion ionomer | nickel fiber paper | NiFe2O4 | Stainless steel fiber paper | NiFeCo | [219] |
| 2 A cm−2 at 1.8 V | 1M KOH | AF1-HNN8-50, Ionomer Inc | Au-coated Ti felt | Ir black | Toray carbon paper | Pt/C | [253] | |
| 1 A cm−2 at 1.9 V | 1 M KOH at 50 °C | Fuma FAA 3-PE-30 | Fumion FAA-3 | Ti felt | Ir black | Ti felt | NiMo/X72 | [254] |
| 1 A cm−2 at 1.8 V | 1 M KOH at 50 °C | Fuma FAA 3-PE-30 | Fumion FAA-3 | Ti felt | Ir black | Ti felt | Pt/C | [254] |
| 2 A cm−2 at 2 V | 1 M KOH at 50 °C | Fuma FAA 3-PE-30 | Fumion FAA-3 | Au-coated Ti felt | Ir black | Toray carbon paper | Pt/C | [254] |
| 1.85 A cm−2 at 2 V | 1 M KOH at 50 °C | Fuma FAA 3-PE-30 | Fumion FAA-3 | Au-coated Ti felt | Ir black | Toray carbon paper | NiCu MMO | [255] |
| 1.5 A cm−2 at 2 V | 1 M KOH at 50 °C | Fuma FAA 3-PE-30 | Fumion FAA-3 | Au-coated Ti felt | Ni0.6Co0.2Fe0.2 | Toray carbon paper | Pt/C | [256] |
| 2.65 A cm−2 at 2 V | 1 M KOH at 50 °C | Fuma FAA 3-PE-30 | Fumion FAA3/Nafion 117 | Au-coated Ti felt | Ir black | Toray carbon paper | Pt/C | [257] |
| 1.15 A cm−2 at 2 V | 1 M KOH at 50 °C | Fuma FAA 3-PE-30 | Fumion FAA3/Nafion 117 | Au-coated Ti felt | Ni0.6Co0.2Fe0.2 | Toray carbon paper | Ni-MoO2 | [257] |
| 2.7 A cm−2 at 1.8 V | DI water | HTMA-DAPP | HTMA-DAPP | platinized titanium | NiFe | Carbon paper, SGL 29 BC | PtRu/C | [258] |
| 1 A cm−2 at 1.85 V | 1 M KOH | Sustainion X37-50 | Nafion 117 | stainless-steel gas diffusion layer | NiFe2O4 | nickel fiber paper | Raney nickel | [259] |
14 Long-Term Stability
The long-term stability of AEM water electrolyzer devices published has a very large range of experimental parameters as some experiments last from a few hours to thousands of hours as shown in Table 7 . The CCS approach is widely used for MEAs tested for long-term durability.[ 239 ] Dioxide Materials Inc. has demonstrated the performance of an electrolyzer of 1 A cm−2 at 1.9 V in 1M KOH at 60 °C for 1600 h with a 5 μV h−1 degradation rate.[ 239, 260 ] The dioxide materials electrolyzer used a NiFe2O4 catalyst at the anode and a FeNiCo catalyst at the cathode.[ 239, 260 ] Recently, the Sustainion membrane and dioxide materials electrolyzer maintained the best stability in literature for up to 10 000 h at 1 A cm−2 with PGM-free catalysts (60 °C and 1 M KOH).[ 259 ]
| Catalyst (HER/OER) | Membrane | Electrolyte | Durability | Ref. |
|---|---|---|---|---|
| Acta 4030 (Ni/(CeO2eLa2O3)/C)/Acta 3030 (CuCoO x ) | A-201, Tokuyama Corp., Japan | 1% K2CO3, 60 °C | 200 h at 500 mA cm−2 at 2 V | [218] |
| Acta 4030 (Ni/(CeO2eLa2O3)/C)/Acta 3030 (CuCoO x ) | A-901, Tokuyama Corp., Japan | 1% K2CO3, 50 °C | 200 h at 500 mA cm−2 at 2 V | [261] |
| NiAlMo/ NiAlMo | HMT-PMBI AEM | 1 M KOH, 60 °C | 12 h at 1 A cm−2 at 1.9-2 V | [238] |
| NiNx/C/NiFe/Raney | PPO membranes | 1% K2CO3, 50 °C | 1000 h at 500 mA cm−2 at 2.15 V | [251] |
| NiFeCo/NiFe2O4 | Sustainion Membranes, Dioxide Materials | 1 M KOH, 60 °C | 1600 h at 1 A cm−2 at 1.9 V | [239] |
| Ni-MoO2/Ni0.6Co0.2Fe0.2 | FAA-3-PE-30 | 0.1 M KOH, 50 °C | 65 h at 0.5 A cm−2 at 1.95 V | [257] |
| Raney nickel/NiFe2O4 | Sustainion X37-50 | 1M KOH, 60 °C | 10 000 h at 1.85 V at 1 A cm−2 | [259] |
| PtRu/C/NiFe | HTMA-DAPP | DI water, 60 °C | 160 h, 2 V at 200 mA cm−2 | [258] |
15 Conclusion
The AEM electrolysis needs to pursue several new and innovative concepts at the material, component, stack, and system levels. Cathode catalysts represent the main bottleneck for improving the AEM electrolysis performance and durability compared to state of art platinum catalysts. Cathode catalyst based on transition metal catalyst has lower activity compared to Pt and requires very high thick electrode to be comparable with platinum which reduced the economic advantages of it and increases the supply for emerging materials like Ni, Co, and Mo. Anode catalysts such as Ni and NiFe can deliver state of the art performance and stability similar to iridium catalysts in alkaline electrolytes with major cost benefits. Catalyst synthesis scalability to industrial scale is an important parameter to commercializing non-PGM catalysts for AEM water electrolysis.
Anion exchange ionomer and membranes need to be compatible with cost-efficient transition metal catalyst, providing conductive in low concentrations of KOH electrolytes and DI water, in addition to lower poisoning of active sites due to solvents or organic groups. Screening of catalysts, ionomers, and membranes should be carried out in membrane electrode assemblies and single-cell electrolyzer level (AEM electrolyzer short stack) to test the catalyst in a real electrolyzer environment and avoid under or upper estimation of activity when tested in rotating disk-three electrode setup. Non-PGM catalytic ink optimization, maximizing three-phase boundaries (TPB), catalyst ionomer interactions, and manufacturing robust electrode structures is essential to reach AEM electrolyzers with performance and durability similar to well-established technologies of alkaline and PEM electrolysis and avoid mass transport and gas removal issues. Accordingly, all stack components (porous transport layers (PTLs), meshes, bi-polar plates, seals, etc.) will require design optimization. Testing and benchmarking of the AEM electrolyzer's performance should be carried out under steady-state conditions to be able to compare various lab results. The long-term durability of AEM electrolysis is to be carried at industrially relevant current densities for several thousands of hours. Testing protocols and standardized components and testing cells should be introduced to the AEM electrolysis research community similar to PEM electrolysis. Knowledge transfer from the existing knowledge of basic and applied research in PEM and alkaline electrolysis can help accelerate the technology development and increase the technology readiness level in a short time to help the society to transfer to green hydrogen and sustainable fuels. The development of a roadmap for AEM electrolyzer components is needed for systematic development, integration, technology validation, and commercialization of AEM systems.
Conflict of Interest
The authors declare no conflict of interest.
Acknowledgements
This work was performed within HAPEEL project “Hydrogen Production by Alkaline Polymer Electrolyte Electrolysis” financially supported by the Research Council of Norway-ENERGIX program contract number 268019.
Biographies

Alaa Y. Faid obtained his Ph.D. in materials science and engineering from the Norwegian University of Science and Technology in 2020. Dr. Faid specialized in electrolysis systems, catalyst fabrication, and in situ spectroelectrochemistry. Dr. Faid supervised 5 bachelor's and master's students and has published more than 15 peer-reviewed articles and 20 conference participation.

Svein Sunde obtained his Ph.D. in electrochemistry from the Norwegian Institute of Technology in 1991, and the degree of Dr. Techn. in chemistry at the Norwegian University of Science and Technology (NTNU) in 2000. Sunde served for 4 years as a research scientist/group leader in SINTEF (Norway), 1 year as visiting scientist at Risø National Laboratories in Denmark, and 8 years as a research scientist at the Institute for Energy Technology/OECD Halden Reactor Project. He is a full professor of electrochemistry at NTNU since 2005 and supervised more than 50 Ph.D., M.Sc., students, and postdocs.


