Influence of the Mixing and Dispersing Process on the Slurry Properties and the Microstructure and Performance of Ultrathick Cathodes for Lithium-Ion Batteries
Abstract
The influence of industrial-suited mixing and dispersing processes on the processability, structure, and properties of suspensions and electrodes for lithium-ion batteries is investigated for the case of ultrathick NCM 622 cathodes (50 mg cm−2). Performed with a 10 dm3 planetary mixer, two different process strategies for the preparation of the suspensions are compared in which 1) all powders are mixed initially and the solvent is added stepwise so that the process starts with very high shear stress or 2) the powders are added stepwise to a binder solution so that lower shear stress is exerted. It is shown that the process strategy and within this, the level of solid content throughout the process as a measure of shear stress strongly affects the properties of the suspensions and the microstructure, mechanical quality, and electrochemical performance of the resulting electrodes. Compared with the more unfavorable processes following strategy: 1) the most beneficial process following strategy 2) leads to a strongly enhanced elasticity of ultrathick electrodes making them suitable for roll-to-roll processing and furthermore to a drastic increase of their rate capability expanding their range of outperforming state-of-the-art electrodes regarding energy density to higher current densities.
1 Introduction
Today, the lithium-ion battery (LIB) is regarded as the most promising technology to power battery electric vehicles.[1] For its breakthrough, reduced production costs and increased safety and charging performance are demanded. Especially, an increase of their energy density to facilitate cruising ranges comparable with those of conventional vehicles is regarded as essentially important.[2-4] The energy density of LIBs can be increased by drastically increasing the areal mass loading of the electrodes and thus strongly reducing the share of passive materials like current collectors and separator in the cell stack. This study is focused on ultrathick cathodes that can be applied for this concept.
Several studies on cathodes with high and ultrahigh mass loading based on experiments and simulation have already been conducted.[5-20] However, increasing the thickness of electrodes is accompanied by a decreasing mechanical quality that manifests itself in crack formation and reduced adhesion force.[5, 11, 21, 22] Furthermore, a drastically reduced rate capability is observed with increasing thickness, commonly attributed to hindered lithium-ion diffusion within the pore structure of the cathode, which is especially pronounced at high charge and discharge rates.[5, 6, 8, 10, 16]
The mechanical quality, electrical conductivity, and diffusion kinetics of lithium ions within the electrode composite are strongly determined by the electrode microstructure formed by the framework of active material (AM) particles, the porous structure left by the AM particles, and the composition, particle properties, distribution, and arrangement of the passive material within the pores. A manufacturing step that has a strong impact on the electrode microstructure is the mixing and dispersing process applied to prepare the suspensions used to produce the composite electrodes.[18, 20, 21, 23-36] Cathode suspensions usually consist of AM, conductive additives such as carbon black (CB) and graphite (G), a polymeric binder (B), and the organic solvent N-methyl-2-pyrrolidone (NMP). During the mixing and dispersing procedure, the insoluble solid components AM, CB, and G are distributed homogenously (distributive mixing) on the one hand and dispersed, accompanied by the reduction of the size of agglomerates and aggregates (dispersive mixing), on the other hand. In principle, a homogenous distribution of all components is desirable. Several studies attach importance to the deagglomeration of CB.[25, 27, 30, 34, 35, 37, 38] The more or less deagglomerated conductive additives form a so-called carbon binder domain (CBD) together with B. The structure of this CBD is fundamentally defining both the mechanical (attributed to B) and the electronic connection (attributed to CB and G) of the AM particles with each other and with the current collector.[39-41] It also determines the porous microstructure of the electrode composite, which influences the diffusion kinetics of the lithium ions. The porous microstructure is mainly described by the porosity providing the volume and cross sections for the access of lithium ions from the electrolyte to the AM particles and by tortuosity.
According to a model of Liu et al., in the mixing and dispersion process, the CB and AM particles compete for an interaction with the binder molecules to form fixed polymer layers on their surfaces.[39] Deagglomeration as an intended effect in this process directly influences the available surface area and can thus be expected to strongly affect the structure of the CBD. Dominko et al. demonstrated lower polarization by a uniform distribution of CB around each AM particle compared with nonuniform distribution.[40] However, a CBD surrounding the AM particles can also block active surfaces, and a very dense CBD located at the contact points of AM particles can block pores and lead to a low conductivity and low rate capability of the electrode.[41] Furthermore, for good electronic transport, a percolation threshold has to be exceeded.[42] The corresponding long-range electronic pathways may be impeded, if CB aggregates become too small in the course of dispersion.
Different processes for mixing and dispersing have been investigated in previous work varying in terms of the applied tools, the scale, the total solid content (TSC), the mixing time, or the sequence of addition. Particular attention has been paid to the study of the mixing sequence,[23, 24, 26, 32, 36, 43] wet and dry mixing steps,[18, 25, 27-29, 31, 36, 44, 45] high-intensive mixing,[21, 25, 27, 31, 33] and extrusion.[28, 34, 38]
In lab-scale experiments, it was shown that wet mixing of untreated LiCoO2 as an AM and G in a binder solution results in a less effective dispersion of the powders and lower cycling stability of the resulting electrode compared with a process in which AM and G are dry mixed prior to being stirred into a binder solution.[43] Lee et al. found that a multistep process in which binder solution and additional solvent are added stepwise to dry-mixed LiCoO2 and CB resulted in a more suitable suspension for electrode preparation with more fluid-like behavior and less agglomeration and in a higher rate capability and cycling stability of the electrodes made from them compared with a process in which the binder solution is added in only one step.[24] Based on these findings, various studies analyzed intensive dry mixing of AM and CB prior to mixing them with a binder solution as a process to generate an advantageous highly conductive carbon shell on AM particles.[21, 25, 27, 31, 36] All of them revealed a strong fragmentation of CB which covered the AM particle surfaces together with the polymeric B as a compact layer that may block ionic transport. A long-range electronic network throughout the electrode composite was missing. The corresponding electrodes suffered from high resistance and low rate capability in the uncalendered state.[31] Suspensions based on intensive dry mixing of CB and AM show a liquid-like behavior prone to sedimentation,[27, 36] yet the corresponding electrodes show an increased adhesion force compared with a complete wet mixing process.[31, 36]
Recently, a study combining experiments and simulations of a mixing process in a pilot-scale planetary mixer related the tip speed and duration during the mixing procedure to the resulting particle sizes.[35] After dry mixing and kneading of all powders (AM, carbon additives, and B), the solvent was added in one single step followed by further kneading in the same mixer. The particle size was shown to follow a power law function of time and to converge to a minimum size which depends on the shear stress during dispersion. In most of the range of particle sizes, from 28 down to 23 μm, the 5 C rate capability of the corresponding electrodes increased while toward smaller particle sizes, it decreased. However, no comparison with a complete wet process is considered in this study and only few electrochemical data are given. Also, the impact of the mixing process on ultrathick electrodes cannot be assessed.
Thus, although many aspects of cathode slurry preparation are elucidated, research on the effect of an industry-suited mixing procedure on the microstructure, quality, and performance of ultrathick electrodes is still insufficient. Also the sequential addition of ingredients providing the opportunity to adjust the consistency of the suspensions in the respective phases of dispersion has still received little exploration.
In a previous work of our group, first results on the impact of the dispersion procedure on the properties and performance of ultrathick cathodes based on experiments and simulation were reported.[18] Two mixing and dispersing processes were compared, both using only a pilot-scale planetary mixer. The first process (HSM—high shear mixing) started with the dry mixing procedure of all powders, which in contrast to most of the studies described earlier was very short and moderate and included also the polymeric B and continued by a sequential addition of NMP and kneading at very high TSC. In the second process (LSM—low shear mixing), the carbon additives and AM were added sequentially to a binder solution. The HSM process led to a compact layer of passive material on the AM particles while the LSM process resulted in a more porous structure of the CBD. The ultrathick cathode prepared from the LSM process showed a drastically increased rate capability compared with the HSM process.
In this study, we complement those findings by further investigations. It is explored what overall influence the mixing and dispersing processes have on the properties of the suspensions and on the mechanical properties of ultrathick cathodes produced by them. These properties are assessed with regard to industrial processability. An additional process is considered to elucidate what results are generated by moderated conditions within the strategy of HSM.
NCM 622 cathodes with a mass loading of 50 mg cm−2 which exceeds the state of the art approximately by a factor of three were prepared in pilot scale. Each batch for slurry preparation contained a total mass of 6 kg of AM to ensure that the mixing concepts discussed in this contribution are highly relevant to industrial processes. Three mixing and dispersing processes based on sequential addition procedures are compared.
2 Results and Discussion
The viscosity inter alia correlates positively to the TSC while the shear rate is increased by a higher circumferential speed of the mixing tools and a smaller shearing gap.
Thus, the effectivity of the dispersing process—including destructive effects at its extreme—can be increased by increasing the TSC of the suspensions. In the following text, the designation “disintegration” will cover both deagglomeration of CB clusters and fragmentation of CB aggregates as an effect of the dispersing process.
In this work, we investigated industrial-suited mixing and dispersing procedures operated with an opposite progression of the TSC, ending up with a comparable viscosity of the resulting suspensions. The latter condition is important to ensure comparable behavior in the subsequent coating process.
Based on previous work, we compare a process starting with high TSC and consequently high shear stress which we name “HS1” in this work to another process starting with low TSC and correspondingly low shear stress which we designate as “LS” here.[18] In addition, we include a modified mixing and dispersing process “HS2,” where reduced high shear stress is applied by conducting it with a lower TSC compared with HS1 without changing the principle of the process. The experimental details are described in the Experimental Section.
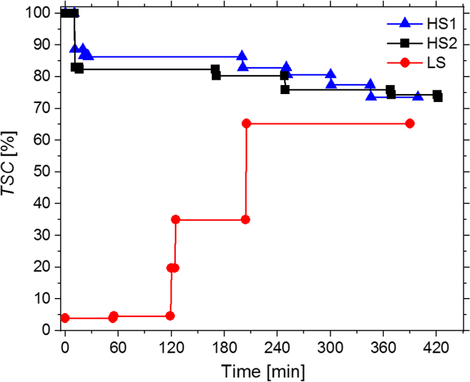
Figure 1 shows the progression of TSC of the suspensions in the course of the mixing and dispersing process. After the dry mixing, HS1 and HS2 start with a TSC of 88.6% and 83.0%. As the most stressful long-time condition, the TSC was 86.4% for 175 min in HS1 and 82.4% for 154 min in HS2. As shown, the TSC of the suspension prepared with LS (TSC = 65.2%) is much lower than the one received by HS1 and HS2 (TSC = 73.5% and TSC = 73.4%, respectively). As a consequence, by applying process LS, more energy for drying will be required in the subsequent production step of coating and drying compared with HS1 and HS2.
2.1 Rheological Properties of the Suspension
After the mixing and dispersing process, the suspensions were finally adjusted by very slight dilution with NMP to meet the adequate viscosity for the coating process. Due to the large thickness of the wet films necessary to produce the ultrathick electrodes in this study, in the subsequent coating process, comparably low belt velocities between 0.5 and 1.1 m min−1 were applied to completely evaporate the solvent. The shear rates resulting from these conditions according to Equation (2) ranged from = 20 to = 50 s−1. The most important properties of the final suspensions are given in Table 1.
| Procedure | HS1 | HS2 | LS |
|---|---|---|---|
| TSC [%] | 73.5 | 73.1 | 65.0 |
| Density [g cm−3] | 2.27 | 2.28 | 2.14 |
| Shear rate of application [s−1] | 47.6 | 49.0 | 20.7 |
| Viscosity at shear rate of application [Pa s] | 12.0 | 15.6 | 11.2 |
The dependence of the viscosity of the suspensions prepared by HS1, HS2, and LS on the shear rate is shown in Figure 2. All samples show a shear thinning behavior, commonly explained by an alignment of the polymer chains in the suspension due to shear stress, reducing the entanglement between individual polymer chains.[46]
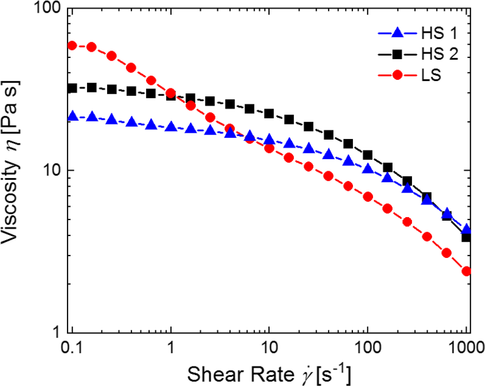
For the suspension prepared with LS, the initial viscosity is significantly higher compared with the values obtained by HS1 and HS2. In addition, in the range of low and medium shear rates (from 0.1 to 100 s−1), the slope of the viscosity curve is more negative in the case of LS compared with HS1 and HS2. In contrast, the application of the processes HS1 and HS2 leads to an almost constant viscosity in this range of shear rate (see Figure 2). This different behavior can be explained by different amounts of free binder. All suspensions reported herein have a polymer content of 4 wt% related to the solid electrode composite. However, the amount of free polymeric binder is influenced by the number and sizes of CB aggregates generated during the mixing and dispersing process.
The shape of the viscosity curve in the case of LS can be explained by more free binder in the suspension, which can be assigned to less disintegration of CB aggregates. Due to entanglement of the free polymer chains, higher viscosity is observed at low shear rates, followed by a faster drop in viscosity at medium-to-high shear rates when the polymer molecules are oriented more parallelly. In contrast, the less shear thinning behavior of the suspensions produced by the procedures HS1 and HS2 can be explained by a higher number of small CB aggregates, immobilizing more binder compared with the procedure LS.
Viscosity is generally known to increase with TSC due to an interaction between the particles and the polymeric binder.[46] Even though the suspensions resulting from HS1 and HS2 have nearly the same TSC, they show clearly different characteristics of viscosity. Up to a shear rate of ≈300 s−1, the viscosity of the suspension obtained by HS1 is lower and the negative slope in the medium range of shear rate is smaller compared with process HS2. This hints at stronger disintegration of CB agglomerates in the case of HS1, where higher shear stress was applied for a longer period of time than in the case of process HS2.
Notably, the initial viscosity of the suspension prepared from LS is higher although the TSC is lower by more than 11% compared with the suspensions prepared by the processes HS1 and HS2. This further supports our suggestion that less disintegration of CB by the process LS is the reason for the observed behavior. This is in principal agreement with the results by Bockholt et al. for an intensive dry and wet mixing process.[25]
Further rheological measurements were performed in oscillation mode. The storage modulus (G′) describes the deformation energy stored inside the suspension (elastic or solid-like behavior), while the loss modulus (G″) is a measure of the energy loss while shear stress is applied (viscous or liquid-like behavior). The dependence of G′ and G″ on shear stress for the suspensions obtained with the processes HS1, HS2, and LS is shown in Figure 3a.
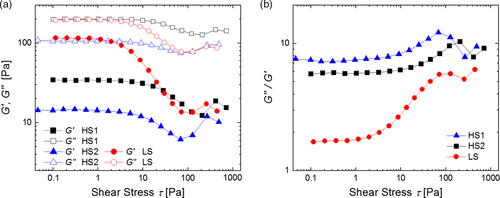
For all three suspensions, G″ is larger than G′, indicating liquid-like behavior. In the case of HS1 and HS2, the linear viscoelastic regime in which the suspension withstands structural breakdown extends to larger shear stress compared with the process LS. Due to their fluid-like character, all three suspensions may be prone to sedimentation. However, we did not observe sedimentation during our experiments. In industrial processes, it is easily prevented by keeping the suspensions in motion by slight stirring. As an advantage, liquid-like suspensions tend to allow for leveling of minor inhomogeneities which can occur during the coating process. Nevertheless, a high stability of suspensions is desirable.
The ratio G″/G′ of the suspensions obtained from the different processes increases in the order LS < HS2 < HS1 (see Figure 3b). For example, at very low shear stress of 0.1 Pa, the corresponding values are G″/G′ = 1.7, 5.8, and 7.4, respectively. This indicates that the suspension from process LS is the most stable one as it is more gel like compared with those obtained from HS2 and HS1. In contrast, the suspension from process HS1 shows the lowest stability.
The shear stress exerted in the different processes increases in the same order LS < HS2 < HS1 as the ratio G″/G′. Consequently, an increasing disintegration of CB can be expected in this order. Larger CB aggregates and a larger amount of nonimmobilized polymeric binder lead to a larger degree of entanglement between individual polymer chains and consequently to a more elastic behavior of the suspension.
Thus, the more gel-like behavior of the suspension prepared by the process LS can be explained by less disintegration of CB. A stabilizing effect of larger CB aggregates was also reported in other works.[27, 36] The increasingly liquid-like behavior of the suspensions obtained from the processes from HS2 to HS1, on the other hand, can be explained by the stronger disintegration of CB, leading to an increasing amount of CB and polymeric binder attached to the NCM particles and reduced interactions between the solid aggregates.
2.2 Morphology of the Electrode Composite
From the suspensions obtained by HS1, HS2, and LS, ultrathick electrodes were prepared as described in the Experimental Section. Scanning electron microscopy (SEM) images of the electrode surfaces are shown in Figure 4a–c and micrographs of electrode cross sections in Figure 4d–f. In all three electrodes, the distribution of the NCM particles is comparable, whereas the distribution of the passive materials differs strongly.

In the electrodes obtained from HS1 (Figure 4a,d), CB, G, and B form an evenly distributed, thick, and compact layer enwrapping the AM particles, while the pores between the NCM 622 particles remain partly empty. Compared with that, the passive material structure of the electrode produced from HS2 appears slightly more porous and pore filling (Figure 4b,e). In both cases, the dense CBD seems to block some small pores. In contrast, in the electrode obtained by LS, the AM particles are connected by a highly porous, sponge-like and space-consuming CBD, while the surface of the electrode is partially uncovered by passive material. These features of the microstructure suggest an increasingly facilitated lithium-ion diffusion in the order HS1 < HS2 < LS.
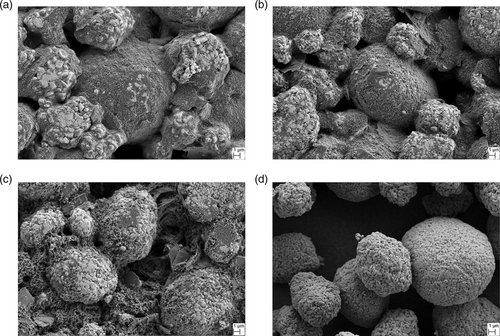
SEM images in Figure 5a–c offer a more precise view on the electrode surface and the microstructure obtained by the three different processes, respectively. Pristine particles of the AM NCM 622 are displayed for comparison in Figure 5d. In the electrodes obtained by HS1 and HS2, the inactive material is predominantly bound to the surface of the AM particles, whereas in the electrode prepared by LS, the inactive compounds occupy a large volume in the gaps between the AM particles. In the electrode produced by HS1, a large fraction of the AM particle surface is homogeneously covered with a very thick and dense CBD, consisting of small CB aggregates and ground G and B (Figure 5a). In the case of process HS2, the CBD layer appears thinner and a higher number of intact particles of G can be observed (Figure 5b). Figure 5c shows that in the electrode from LS, the size of the G particles and CB aggregates is significantly larger, covering a lower extent of the AM particle surface with a higher elongation into the pore space. It can be deduced that by the process LS, less binder is immobilized on the surface of the AM particles compared with the processes HS1 and HS2. Consequently, more free binder is available to form the highly porous 3D structure observed in Figure 4f.
In Figure 6, the elemental fluorine distribution obtained by energy-dispersive X-ray (EDX) analysis on cross sections of the different electrodes is shown. Fluorine is a tracing element for the presence of B. The electrode based on HS1 shows a strong binder gradient with an enrichment of B near the surface of the electrode. A more homogeneous distribution with less enrichment of B toward the electrode surface can be seen in the electrode from LS. In previous work, this distribution was confirmed by image processing.[41] In contrast, the electrode from HS2 shows a very homogenous distribution of B.

The different distributions of B in the three-electrode composites can be explained by binder migration.[47] The extent of binder migration is affected by the mixing and dispersing process as well as the evaporation rate of the solvent in the drying process after application. As the previous results have suggested, the CBD is strongly disintegrated by the processes HS1 and HS2 than by the process LS. In case of process HS1, the highest shear stress was applied and thus the fragmentation of the CBD was driven to an extreme (see Figure 4a,d and 5a), making the suspension least stable and most prone to sedimentation of AM and binder migration to the surface of the electrode (see Figure 3b). This can explain the increased enrichment of B toward the surface of the electrode based on HS1 compared with the electrode based on LS.
The much more homogeneous distribution of B in the electrode based on HS2 compared with HS1 and LS can be explained as follows. The stability of the suspension was higher compared with HS1 (see Figure 3b). However, additionally, a lower belt speed was applied during the coating and drying process of the electrode based on HS2 compared with the electrodes based on HS1 and LS (see Experimental Section). As a result, the evaporation rate of the solvent was lower for the electrode from HS2, which counteracted binder migration.
2.3 Mechanical Properties
Adhesion of the electrode composite to the current collector and cohesion inside the composite layer are particularly important for the processability of electrodes during production, handling, and cell assembly. The dependence of the tensile strength of electrodes based on HS1, HS2, and LS on their areal mass loading is shown in Figure 7.
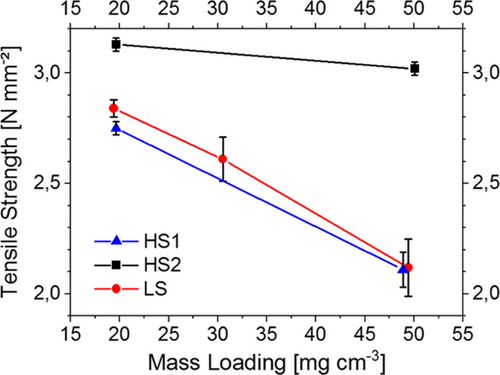
While for moderate mass loading corresponding to the state of the art, the tensile strength of all electrodes is comparable, it decreases drastically with increasing mass loading in the cases of HS1 and LS. A low tensile strength is a known impairment of very thick electrodes.[21, 22] The tensile strength of the electrode cast from the suspension prepared by HS2 is considerably higher compared with electrodes based on HS1 and LS already for moderate mass loading and is nearly not compromised by high mass loading. For a mass loading about 50 mg cm−2, tensile strength was 40% higher for electrodes from HS2 compared with those from HS1 and LS (Figure 7).
This is consistent with the apparent absence of a binder gradient in the electrode composite Figure 6b). In addition, the more homogeneous and compact structure of the CBD in the electrode from HS2 increases the contact area to the AM particles and therefore beneficially influences the tensile strength of the whole composite compared with the less homogenous distribution generated by the process LS, where a highly porous CBD with less contact points was observed in the SEM images (Figure 4b,e).
It should be noted that the possible enhancement of binder migration by a faster drying process in the case of HS1 compared with HS2 does not question the preceding interpretations regarding the effect of the mixing and dispersing process. The differences in the properties of the suspensions (Figure 2 and 3) and the fragmentation observed in the SEM images (Figure 4 and 5) cannot be caused by different drying times. Instead, the strongly increased tensile strength of the electrode from HS2 compared to the electrode from HS1 shows that it is possible to produce ultrathick electrodes with very high tensile strength with a mixing and dispersing process in which high shear stress is applied by 1) conducting the mixing and dispersing process with a customized TSC in the course of the process and 2) reducing the evaporation rate in the coating and drying process.
The type of mechanical failure was identified by optical assessment of the samples after the adhesion test. In the case of HS1, adhesive failure occurred between the current collector and the electrode composite, which indicates a low binder content in this region and is in line with the observed fluorine distribution (Figure 6). In case of the HS2, the adhesive tape was stripped off before a rupture of the sample occurred, indicating an even higher tensile strength than the measured value. In contrast to these results, cohesive failure inside of the composite layer was observed for the electrode obtained from LS, which may be attributed to a less homogeneous distribution of the binder and less contact points between the CBD and the AM. However, all three samples show sufficient adhesion for processing in typical production and handling procedures.
In our experiments, the electrodes were produced with a roll-to-roll process applying a core diameter of 80 mm. This is also common in industrial production. Photographs of the coiled electrodes are shown in Figure 8. As both electrodes prepared by HS1 and HS2 showed the same appearance, only the electrode based on HS2 is shown representatively. The pictures show the qualitative influence of the mixing and dispersing process on the bending flexibility. The electrodes fabricated from suspensions prepared by procedures HS1 and HS2 exhibit cracks orthogonal to the direction of casting, ranging over the whole width of the electrode and reaching down to the current collector. The distance between the cracks that formed during bending is lower than 2 cm. In the case of the electrode prepared from procedure LS, no cracks were observed under the same experimental conditions, which makes it suitable for industrial processing.

Concluding from this, two different binding mechanisms need to be considered. On the one hand, short-range contacts established by a thin layer of CBD on the AM particles that can withstand binder migration during the drying process enhance the tensile strength of the electrode. On the other hand, long-range connections by a microporous CBD structure are more flexible than the aforementioned configuration, resulting in a significantly enhanced bending flexibility of the electrode. With the process LS, a suitable compromise between these configurations is reached to make the electrodes industrially processable.
2.4 Microstructural Properties
The porous structure of the electrode composites of the ultrathick electrodes produced by the processes HS1, HS2, and LS was analyzed by mercury intrusion porosimetry (MIP). The theoretical porosity was deduced from the experimental density of each electrode composite and is compared with the porosity value gained by MIP in Table 2.
| HS1 | HS2 | LS | |
|---|---|---|---|
| Specific density [g cm−3] | 3.09 | 3.10 | 3.05 |
| Porosity from MIP | 28.0 | 28.5 | 28.3 |
| Porosity calculated | 28.2 | 28.0 | 29.0 |
Notably, calculated and experimental values are in good agreement. In Figure 9, the pore size distribution within the electrodes based on HS1, HS2, and LS is shown. Pore sizes larger than 10 μm are not considered for discussion, as the pore size of the microstructure is expected to be ≈2–4 times smaller than the particle size.[48]
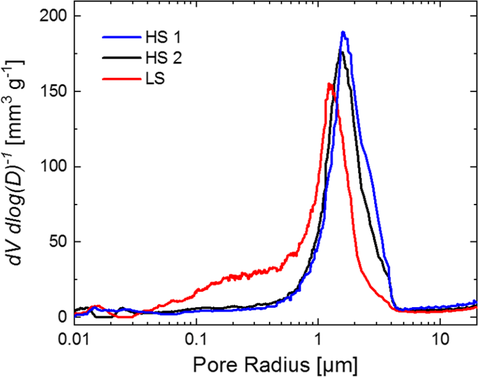
In the case of HS1, a relatively narrow and symmetrical pore size distribution with a sharp maximum at a pore radius of 1.6 μm is observed, while the pore radii cover a range of 0.6–4.5 μm. No significant pore volume was observed below a pore radius of 0.6 μm.
For the sample prepared from process HS2, the maximum in pore radius is shifted to a slightly smaller value of 1.5 μm, while the width of the peak is marginally increased. For both the electrode composites prepared by the processes with high shear stress, almost no small pores are found.
Although experimental densities and porosities of the electrodes from the processes HS1, HS2, and LS are very similar (see Table 2), a significantly broader pore size distribution and a higher fraction of smaller pore sizes are generated by LS compared with HS1 and HS2. According to literature, this can be explained by a stronger disintegration of CB in the processes HS1 and HS2 and consequently a more extensive interaction of CB and B in the CBD so that a larger fraction of the CBD is immobilized on the surface of the NCM particles, while a large part of the voids between the AM particles remains unfilled.[25] In contrast to that, our results suggest that a significantly larger amount of the porous passive material network was generated by the process LS.
In order to determine the ionic mobility of lithium ions inside the electrode composites, electrochemical impedance spectroscopy (EIS) measurements were conducted in symmetrical coin-type cells. In these cells, two disks punched from the same electrode are combined directly after electrode manufacturing, respectively. Because the electrode samples were not combined with a counter electrode before, their SOC should amount to 0% so that blocking conditions can be regarded as fulfilled. To the best of our knowledge, no investigations on the influence of the mixing and dispersing steps in the manufacturing process of ultrathick electrodes on the tortuosity have been reported in literature so far. Nyquist plots of the impedance of ultrathick electrodes prepared by HS1, HS2, and LS are shown in Figure 10. For all measurements, no charge transfer resistance is observed because the blocking conditions realized in our experimental setup provide the absence of faradaic charge transfer reactions.[49] In the high-frequency region, ohmic contacts and the electrolyte resistance are detected. For electrodes from HS1, HS2, and LS, values for the ohmic resistance, derived from EIS measurements, of 3.1, 3.4, and 2.8 Ω are observed, respectively. It shall be noted that EIS measurements react very sensitively to external influences, for example, the external connection of the cell or compression. This restricts the explanatory power of these values. Due to their susceptibility to external experimental influences, values for electrical conductivity were not given, especially as the values of ohmic resistance that can be derived from EIS measurements are in a comparable range for the given samples.
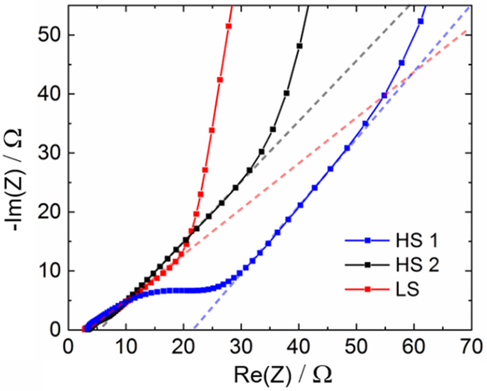
In the region of high-to-medium frequencies, the contact of the composite to the current collector and the porous structure of the electrode affect the measured impedance. In the case of HS1, an additional resistor is observed, most probably due to insufficient contact of the composite with the current collector. The samples prepared from HS2 and LS do not show this behavior, pointing out an improved mechanical contact both inside the composite and with the current collector.
The impedance response of the system at medium frequencies represents the morphology of the pores. Theoretically, a slope of 1 is expected due to a linearly increasing contribution of smaller pores to the measurement signal with decreasing excitation frequency.[50]
For the electrode based on HS1, the slope is slightly higher than 1, and for the electrode based on HS2, it is very close to the theoretical value of 1. In the case of LS, the slope is lower which can be assigned to the presence of bottleneck pores.[51]
For very low frequencies, the impedance is dominated by capacitive effects due to charging of the double layer, which is represented as a vertical straight line in an ideal case. All three samples in our study deviate from this ideal behavior, which can be ascribed to inhomogeneities inside the electrode structure.[52, 53]
Herein, the ionic resistivity Ri, also called “pore resistance,” representing the restriction of lithium-ion diffusion inside the porous network, is considered. A represents the area, κ the ionic conductivity of the electrolyte, ε the porosity, and d the thickness of the electrode composite. For the calculation of τ based on this equation, we used the experimental values of ε (Table 2) and determined Ri from EIS results by extrapolation of the low- and high-frequency branches in the Nyquist diagram (Figure 10) to the x-axis as described in literature.[58]
As a result, Ri was found to be 100.8, 84.8, and 45.5 Ω and τ was found to be 12.5, 9.9, and 5.5 for the electrodes produced by HS1, HS2, and LS, respectively. Hence, with decreasing shear stress applied in the mixing and dispersing process, a decreasing tortuosity was generated in the electrode composites, which means that the pathways for lithium-ion diffusion through the electrode between separator and current collector became shorter and thus more effective in the order HS1 < HS2 < LS.
2.5 Electrochemical Performance
Voltage curves of electrodes based on the processes HS1, HS2, and LS obtained in half cells at three different discharge current densities are compared in Figure 11. Obviously, the mixing and dispersing process has a strong impact on the electrochemical performance. While the electrode fabricated from the suspension prepared by HS1 suffers from a strong IR drop, the two electrodes prepared from HS2 and LS both show only little ohmic polarization. At a low current density of 1 mA cm−2, electrodes prepared by LS show the highest areal capacity followed by the electrodes prepared by HS2 and—at larger distance—HS1. At a current density of 3 mA cm−2, the process LS entails a significantly higher areal capacity than HS1 and HS2. At a current density of 8 mA cm−2 (≈1 C), the areal capacity of the electrode prepared by LS is 40% and 67% higher than the value achieved by the electrodes from HS2 and HS1, respectively.
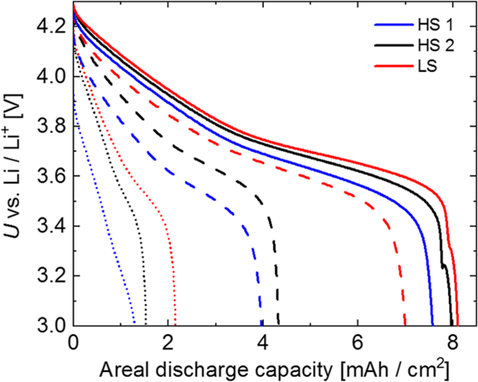
These strong differences in the rate capability can be explained by the differences in the individual electrode microstructures discussed before. The generation of a more dense and pore-blocking CBD promoted by increasing shear stress in the mixing and dispersing processes in the order LS < HS2 < HS1 results in a more hindered electrolyte diffusion and therefore a stronger lithium-ion gradient in the electrodes prepared from them. For this reason, in the same order, the utilization of AM close to the current collector, where lithium-ion depletion can occur at higher current densities, decreases. The highly porous percolation network generated by the process LS allows for the fastest diffusion of the electrolyte, which is confirmed by the lowest tortuosity of the corresponding electrode (see Section 2.4) and leads to an improved utilization of AM at higher current densities.
The composite prepared by HS1 shows a strong binder gradient with an enrichment of B at the surface of the electrode near the separator (see Figure 6). As the PVdF binder has a very low conductivity, this configuration explains the increased resistance and reduced rate capability of the corresponding electrode.[18, 41, 59]
The discharge energy densities of electrodes with ultrahigh (≈50 mg cm−2) and conventional (≈20 mg cm−2) mass loading produced from the processes HS1, HS2, and LS are shown in Figure 12 for current densities between 1 and 8 mA cm−2. As expected and explained in the introduction, at low current densities, the ultrathick electrodes show considerably higher energy densities than the thinner electrodes. However, with increasing current density, the capacity retention of the ultrathick electrodes becomes smaller and the relations are reversed.
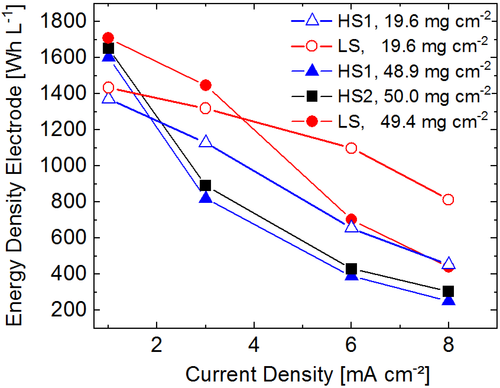
Obviously, the mixing and dispersing procedure has a strong impact on the course of the energy density with increasing current density both for conventionally thick and for ultrathick electrodes. In both cases, the energy density of the electrodes based on dispersion processes with high shear stress is lowest already at a low current density of 1 mA cm−2 and shows the strongest decrease with increasing current density. Ultrathick electrodes prepared from HS1 and HS2 show a very similar energy density throughout the whole range of current densities where the values obtained by HS2 are slightly higher. When HS1 is applied, the superior energy density of ultrathick electrodes over conventionally thick electrodes does not even persist up to a current density of 3 mA cm−2. Starting from a similar value at low current density, the energy density of the electrodes produced from LS is significantly higher at higher current densities.
Compared with the electrodes with conventional thickness, the maximum increase of energy density gained by the mixing and dispersing process is shifted to lower current densities for the ultrathick electrodes. This shows that for ultrathick electrodes, beneficial production processes are more important to enable their applicability than for conventional electrodes. For the ultra-thick electrode produced by LS, the gain of energy density is 77% and 62% at a current density of 3 mA cm−2 and 81% and 63% at a current density of 6 mA cm−2 compared with HS1 and HS2, respectively. The energy density of the ultrathick electrode based on LS is higher than the energy density of the corresponding electrode with conventional thickness up to a current density of at least 3 mA cm−2. It outperforms the conventionally thick electrode obtained from HS1 up to a current density of at least 6 mA cm−2.
3 Conclusion
In this study, three different industrial-suited mixing and dispersing processes for the preparation of suspensions for casting ultrathick LIB cathodes were investigated. A strategy starting from dry components and continuing by adding solvent stepwise while mixing and dispersing under high and decreasing shear stress in the so-called kneading phase was included in the form of a process HS1 involving very high shear stress implemented by a very high TSC during the preparation of the suspension and a moderated process HS2 working with a less high solid content. As a second strategy, the suspension was prepared starting from dissolved polymeric binder followed by stepwise addition and dispersion of the solid components under low and increasing shear stress (LS). Based on the course of the TSC during the process, the shear stress exerted on the suspensions increased in the order LS < HS2 < HS1. From all three suspensions, ultrathick electrodes were prepared with pilot-scale equipment.
The influence of the three different processes on the properties of the resulting suspensions on the one hand and on the morphology and mechanical, microstructural, and electrochemical properties of the resulting electrodes on the other hand was comprehensively analyzed and compared. The findings are assessed with regard to their impact on industrial processability. In detail, the suspensions and electrodes based on the different processes showed the following characteristics.
Although the final suspensions exhibited a comparable viscosity at the shear rate of application, they strongly differed in their TSC and their rheological properties. Process LS resulted in the lowest TSC which implies an increased expenditure for the electrode drying process. Nonetheless, it was shown that this process is beneficial compared with HS1 and HS2 with regard to almost all other aspects analyzed in this study.
While the suspensions prepared by HS1 and HS2 show low dependency of their viscosity on shear rate, a clear shear thinning behavior which is beneficial for slot die coating was shown by the suspension from LS. All processes lead to a liquid-like behavior of the suspensions. However, the gel-like character standing for stability of the suspensions increased in the order of decreasing shear stress applied in the mixing and dispersing process and was largest for the suspension from process LS.
In the order of increasing shear stress the suspensions experienced, the CBD of the electrodes prepared from them changed from a sponge-like and highly porous long-range structure to an increasingly dense layer covering the AM particles with a tendency to block pores. All electrodes showed a tensile strength that is sufficient to withstand typical production steps.
A highly superior tensile strength obtained with HS2 can partly be attributed to a more moderate drying procedure performed with this electrode. Only the electrode obtained from LS remained crack free after winding on a core typically used in industrial roll-to-roll processes.
The electrodes from HS1 and HS2 showed larger pores with a more narrow pore size distribution and a lack of small pores compared with the electrode from LS. The latter in total shows smaller pores with a high share of very small pores with radii lower than 1 μm.
This microstructure of the electrode based on LS resulted in the lowest electrode tortuosity determined in this study followed by the electrode from HS2. This is reflected in a drastically higher rate capability of the electrode from LS compared with HS2 and even more compared with HS1. The electrode from LS also shows a higher energy density than the electrodes from HS1 and HS2, especially for elevated c-rates. By process LS, the superior energy density of electrodes reached by ultrahigh mass loading is extended to considerably higher current densities. The effect is even enhanced when compared with conventionally thick electrodes produced by the less beneficial process HS1.
The results can consistently be explained by the following effect. The shear stress applied to the suspensions increased in the order LS < HS2 < HS1. In the same order, the disintegration of CB within the corresponding suspensions increases. This leads to an increasing immobilization of the binder in the form of a more compact CBD with an increasing tendency to enwrap the AM particles. As a result, the long-range percolation network is increasingly insufficient. Consequently, the electrode prepared from the most moderate process LS shows the most beneficial structure in form of a highly porous and flexible passive material network and good long-range connectivity due to the increased amount of nonimmobilized polymeric binder and conductive additives.
This effect was also reported by previous work on other processes. Bockholt et al. demonstrated this correlation for the case of a dry mixing process.[31] However, a highly intensive dry mixing device was used for the more stressful process in their study, whereas in the processes HS1 and HS2 of our study, only moderate treatment was applied to the dry powders with a planetary mixer. The fact that different results are found with processes HS1 and HS2 even though the dry mixing procedure was the same shows that the extent of disintegration caused by these processes cannot be explained by the dry mixing step. Instead, in HS1 and HS2, high shear stress was applied in the following phase of kneading with high TSC. Our results suggest that this treatment in principle leads to similar disintegration of CB due to the highly intensive dry mixing.
Furthermore, our study shows that the electrode obtained with process HS2 was superior to the one obtained by HS1 with regard to all investigated properties. This shows that without changing the basic strategy of the mixing and dispersing process with high shear stress, by accommodated conditions in the production process, the properties of the electrodes can be significantly improved compared with process HS1. However, although the electrode based on HS2 showed an even excellent tensile strength, crack formation by winding on a coil could not be avoided by the milder production conditions. In addition, except for the tensile strength, all other properties of the suspensions and electrodes based on process HS2 still remained inferior to those obtained by the process LS.
The moderate shear stress exerted in process LS, implemented by a stepwise addition of the solid components to a binder solution, leads to the most beneficial structure of the suspension and the resulting electrode. As a consequence, compared with process HS2, ultrathick electrodes prepared by process LS show significantly higher electrochemical performance, showing up in a 60% higher energy density at an elevated current density of 6 mA cm−2.
This work reveals the fundamental effect of the mixing and dispersing step on the quality and performance of ultrathick NCM 622 cathodes. The authors believe that it is an important contribution toward a profound understanding of the correlation between the production process, the structures generated with it, and the resulting performance of the electrodes for high-performance LIBs.
4 Experimental Section
Electrodes Preparation
Commercially available LiNi0.6Co0.2Mn0.2O2 (NCM 622, BASF) was used as AM. CB (SuperP, Imerys) and G (SFG6L, Imerys) were used as conductive additives and polyvinylidene fluoride (PVdF, Solvay Solexis) was used as B in a mass ratio of 93:2:1:4 in the dry mass of the electrode composite, respectively. N-methyl-2-pyrrolidone (NMP, Sigma Aldrich) was used as a solvent. All materials were utilized as delivered without further treatment. The cathode suspensions were prepared using a 10 dm3 planetary mixer (Netzsch, Germany) equipped with two agitators. A crossbar stirrer (CS) and an axially double butterfly stirrer (BS) were used at low and high speeds, respectively. Transport of the components into the mixing zone was ensured by a wall scraper rotating at slow speed. The processes HS1 and HS2 for preparation of the suspensions under application of high shear stress are shown schematically on the left side of Figure 13, whereas process LS is sketched on the right side.
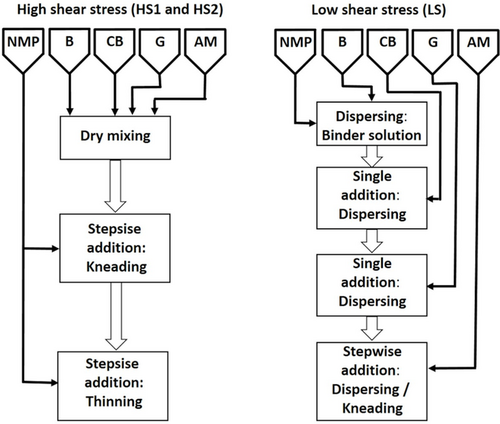
For HS1 and HS2, all solid components were added in dry state and homogenized in the planetary mixer setup with a rotation speed of the CS and BS of 20 and 200 rpm for 10 min, respectively. In the subsequent “kneading phase,” solvent was added stepwise and the mixture was knead at very high viscosity with rotation speeds of the CS and BS of 70 and 700 rpm before in the “thinning phase.” Further NMP was added stepwise under kneading with the intention to reach the target viscosity required for application. The distinction between these two phases is common in practical application without becoming obvious from the specified processing parameters. It is given here as an additional information. HS1 was conducted with a higher solid content in the kneading phase compared with HS2 (see Figure 1). In Table S1, Supporting Information, an overview of the process parameters is given.
For LS, the suspension was prepared starting from a binder solution (see Figure 13, right side). 7 wt% of PVdF was dissolved in NMP at room temperature. CB was added to the binder solution in one portion and was dispersed for 55 min. G was added in one portion and dispersed for 65 min before the AM was added stepwise and subdivided into three portions under further stirring. The rotation speeds of the CS and BS during the mixing and dispersion process were 50 and 500 rpm. The parameters of preparation are summarized in Table S2, Supporting Information.
During the additions in all three processes, the rotation speeds of the CS and BS were reduced to 20 and 200 rpm for a few minutes, respectively. Instead of predefining the masses of the portions and the times for the stepwise addition, these parameters were decided during operation based on optical assessment to ensure a reasonable proceeding. The resulting course of the TSC of the three suspensions can be seen in Figure 1.
From the suspensions, ultrathick electrodes were produced using a pilot line coating machine (LACOM, Germany). Application of the suspension was performed onto Al foil with a width of 150 mm and a thickness of 20 μm (Korff, Switzerland). A drying oven with a total length of 8 m, separated into four drying stages, independently adjustable in temperature, was used for evaporation of the solvent. For all prepared ultrathick electrodes, the drying stages 1–4 were heated to 50, 70, 90, and 110 °C, respectively. Coating and drying of these electrodes was performed at a belt speed of 1.1, 0.5, and 0.8 m min−1 for HS1, HS2, and LS, respectively. Coating speeds were varied to both consider the different TSC of the suspensions and yield homogeneous coatings without any defects. The times for evaporation per areal mass of NMP provided by the different processes were 0.40, 0.87, and 0.37 min cm2 mg−1 for HS1, HS2, and LS, respectively. The mass loading of the ultrathick electrodes was 49–50 mg cm2. After drying, the electrodes were collected on a coil with a diameter of 80 mm and calendered to a density of ≈ 3.0 g cm−3 using a pilot line calender (KKA, Germany). The roll temperature was 100 °C. For the evaluations in Figure 7 and 12, thinner electrodes also prepared from the suspensions from HS1, HS2, and LS were included in the comparison. The main properties of all electrodes can be seen in Table S3, Supporting Information.
Rheological Characterization of the Suspension
After finishing the mixing procedure, the rheological properties of the suspensions were investigated after deaerating under vacuum in the planetary mixer for 5 min, while stirring with the combination CS/BS at rotation speeds of 20/200 rpm. The cathode suspensions were analyzed using a cone/plate (diameter: 50 mm, angle: 1°) configuration rheometer (Anton Paar, Germany) at a temperature of 23 °C. Viscoelastic properties of the suspensions were determined by measuring the viscosity as a function of the applied shear rate and by collecting oscillation measurements (amplitude sweeps, ω = 10 rad s−1) to determine G’ and G“ of the suspensions.
SEM Investigations
Cross section of electrodes were prepared perpendicular to the electrode surface by a broad Ar+-ion beam-milling device (Hitachi IM4000Plus) at an accelerating voltage of 5 kV for 2–3 h depending on electrode thickness. Analysis of the electrode microstructure was conducted with SEM using a LEO1530VP (Zeiss) equipped with a thermal field-emission gun. Images were taken with a secondary-electron detector at 2 and 5 kV. To determine the locally resolved elemental distribution of fluorine, EDX (X-Max50, Aztec Advanced Software, Oxford Instruments) was used. Characteristic X-rays of fluorine were used as a qualitative measure for the distribution of polymer B within the electrode microstructure.
Characterization of Mechanical Properties
Adhesion force of the electrodes was determined using a commercial peeling machine (ZwickRoell, Germany). Samples with an area of 6.45 cm2 were fixed between two stainless steel jaws in parallel orientation using double-sided adhesive tape. During the measuring procedure, the samples were compressed for 120 s with a force of 2.5 kN, followed by a peeling stress perpendicular to the surface, generated by a movement of the sample holder (1000 mm min−1). Tensile force was measured as a function of distance by a load cell. Adhesive or cohesive failure was correlated to the test results by optical evaluation of the samples after the test procedure.
Characterization of Bending Flexibility
Qualitative determination of bending flexibility and crack formation was performed by wrapping the electrode around a standard core with a diameter of 80 mm, which is typically used in roll-to-roll processes. The visual shape and distribution of the cracks regarding their number, length, distance, and depth profile served as an evaluation criterion.
Mercury Intrusion Porosimetry
The pore size distribution within the composite of the NCM622 cathodes was determined via MIP using a Pascal 140/440 porometer (Porotec, Germany). Measurements were carried out in a pressure range of 0.01–375 MPa, and analysis of the pore radius was performed in the range of 1 nm–100 μm. Details on the procedure are given in literature.[60]
Preparation of Symmetrical Coin Cells and Electrochemical Impedance Spectroscopy Measurements
For EIS measurement, the cathodes were mechanically cut into discs (diameter 12 and 16 mm) which were dried under vacuum at <10−2 mbar for 15 h. Symmetrical 2032-type coin cells were assembled using the disks with a diameter of 12 mm as a working electrode and the disks with a diameter of 16 mm as counter electrode to ensure reproducible alignment. Two layers of the micro-glass fiber (Whatman, UK) served as a separator. The assembly process was conducted inside a glove box filled with dry argon. A 1.0 m solution of LiPF6 in ethylene carbonate and ethylmethyl carbonate in a weight ratio of 3:7 with 2 wt% of vinylene carbonate as an additive (BASF, Germany) was used as the electrolyte. EIS spectra of freshly prepared symmetrical coin cells were collected at room temperature in potentiostatic mode (VMP3, Bio-Logic Science Instruments, France). The cells were kept at OCV while one spectrum was recorded every 60 min over a period of 24 h, applying an amplitude of 10 mV in the frequency range of 500 kHz–10 mHz.
Cell Preparation and Electrochemical Characterization
For electrochemical measurements, 2032-type coin cells were assembled like that described in the previous section, with the only difference that lithium foil (Pi-Kem, UK) of adequate size was used as a counter electrode. After assembly, electrochemical cells were connected to a battery testing system (BaSyTec GmbH, Germany) and were paused for soaking at open-circuit voltage for 24 h. After performing three symmetric consecutive cycles between 3 and 4.3 V in galvanostatic mode at a rate of C/10, a rate capability test was performed, consisting of three consecutive cycles with the same current densities applied successively (1, 3, 6, 8, 10, 12 mA cm−2). Starting from a current density of 6 mA cm−2, one cycle was included at a current density of 1 mA cm−2 to visualize capacity retention.
Acknowledgements
A.H. and E.A.H. contributed equally to this work. The authors thank Lea Kremer for contributing data concerning the processes HS1 and LS and Sonja Radloff for conducting the mercury intrusion porosimetry measurements. The presented work was financially supported by the German Ministry “Bundesministerium für Bildung und Forschung” within the projects HighEnergy, HiStructures, and PRODUKT under the reference numbers 03XP0073C, 03XP0243A, and 03XP0028E within the framework of the program “Vom Material zur Innovation.” All responsibility for the content of this publication is assumed by the authors.
Conflict of Interest
The authors declare no conflict of interest.
Open Research
Data Availability Statement
The data that support the findings of this study are available in the supplementary material of this article.


