Improved Proton Adsorption and Charge Separation on Cadmium Sulfides for Photocatalytic Hydrogen Production
Abstract
Cadmium sulfide has attracted wide attention in photocatalytic hydrogen production, due to its appropriate bandgap and band positions. However, high-rate photogenerated electron–hole recombination and few active sites on CdS lead to its low photocatalytic activity. Herein, a PANI/NCPP/CdS (PANI/NiCoP/NiCoPi/CdS) hybrid as a noble metal-free visible light-driven photocatalyst is reported, with metal phosphides, metal phosphates, and polyaniline (PANI) as reduction and oxidation cocatalysts, respectively. This hybrid not only facilitates the charge separation and transfer owing to the formation of heterojunction, but also improves the local concentration of H+ on the surface of catalysts due to the formation of the protonated amine groups on PANI, beneficial to hydrogen evolution reaction. As a result, the as-prepared photocatalyst could show a high hydrogen evolution rate of 170.3 mmol g−1 h−1 and an apparent quantum efficiency of 41.37% at 420 nm, representing one of the best performances of all-CdS-based photocatalysts.
1 Introduction
Photocatalytic water splitting, as an important approach to convert solar energy into clean hydrogen energy from water, has been considered as a promising strategy to the relief of current energy and environmental crisis.[ 1-3 ] Many types and forms of semiconductor photocatalysts have been explored for solar H2 production in recent years.[ 4-9 ] Among them, 1D cadmium sulfide (CdS) nanorods, with a narrow forbidden band (2.42 eV) and a relative negative conduction band (CB) edge, have been widely studied as a photocatalyst for visible light-responsive H2 production.[ 10-16 ] However, inherent high-rate photogenerated electron–hole recombination and inadequate active sites of CdS lead to its low photocatalytic activity.
So far, to reduce charge recombination of CdS, several approaches have been investigated, including morphology control and tuning, heterojunction construction, and cocatalyst loading.[ 12-14, 17 ] Noble metals (e.g., Pt, Pd) have been commonly used as cocatalysts to facilitate hydrogen generation, while the high cost and scarcity restrict their large-scale applications.[ 18, 19 ] Therefore, researchers have been working on low-cost, Earth-rich alternatives to noble metal cocatalysts. Especially, phosphorus-based materials, including metal phosphides and phosphates, have received great interest owing to their abundant reserves and excellent catalytic properties.[ 11, 20-37 ] For metal phosphides (MPs), their metalloid characteristic and good electrical conductivity endow them with good catalytic performance in hydrogen evolution reaction (HER),[ 11, 21-32 ] while metal phosphates (MPi) have been considered as highly active catalysts for oxygen evolution reaction (OER) due to its open framework structure with large channels and cavities.[ 33-37 ] In our previous work, we explored a synthetic approach to coloading MP and MPi nanoparticles on CdS to enhance its hydrogen evolution activity. The MP and MPi act as reduction and oxidation cocatalysts, respectively, dramatically improving photogenerated carrier separation.[ 38 ] To compare the promoting effect from cocatalysts on enhancing H2 evolution of CdS, some famous CdS-based photocatalyst systems for H2 production are summarized in Table S1, Supporting Information.
H+ adsorption at the active sites of catalysts is another key factor to influence photocatalytic hydrogen evolution. Recently, it was reported that surface hydroxylation endowed carbon nitride (C3N4) with striking capacity of H+ adsorption, which resulted in five times of increase in photocatalytic H2 evolution activity.[ 39 ] However, there have been few studies on enhancing H+ adsorption on CdS-based photocatalysts. Due to the abundant lone electrons on nitrogen atoms, the amine groups in polyaniline (PANI) can capture H+ from hydronium ions via protonated amine groups, and therefore PANI could be introduced to improve the accumulation of H+ on the surface of catalysts.[ 40 ] What's more, PANI is a conductive polymer, and has been used in hybrid photocatalysts to suppress the recombination of electron–hole pairs, because it is a typical delocalized conjugated material.[ 41-44 ]
In this work, we introduce PANI onto previously prepared NiCoP/NiCoPi/CdS (NCPP/CdS) systems.[ 38 ] Loading PANI facilitates the adsorption of H+ on the surface of the catalyst. Therefore, the surface-absorbed H+ can easily receive electrons from CdS for hydrogen evolution. Through the introduction of reduction and oxidation cocatalysts, NCPP leads to 202 times enhancement in photocatalytic H2 evolution activity, compared with that of pure CdS. Furthermore, after loading PANI, H2 evolution rate could even be increased by 426 times. The experiment results indicate that PANI not only improves the accumulation of proton surrounding the photocatalyst/cocatalyst, but also works together with NCPP to facilitate photogenerated electron–hole separation.
2 Results and Discussion
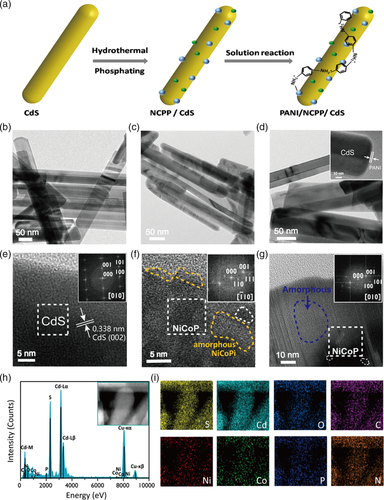
Figure 1 shows the brief synthesis process for PANI/NCPP/CdS and TEM images of the products from each step. As shown in Figure 1a, NCPP (NiCoP/NiCoPi) was first deposited on CdS by a hydrothermal reaction and a phosphating reaction. In the next step, the precursor was coated by PANI through solution polymerization to form PANI/NCPP/CdS. Figure 1b–d shows the TEM images of pure CdS, NCPP/CdS, and PANI/NCPP/CdS, respectively. As shown in Figure 1b, the uniform CdS nanorods with diameters of 30–50 nm and lengths of several hundred nanometers were synthesized. Notably, Figure 1c shows that the surface of CdS nanorods became rough after the phosphating reaction, indicating the successful deposition of NCPP on CdS. However, after loading PANI, the nanorod morphology had no significant change (Figure 1d), but a uniform nanoscale PANI layer was formed on the surface of CdS nanorods (top inset in Figure 1d).[ 45 ] Figure 1e–g shows the high resolution transmission electron microscope (HRTEM) images of pure CdS, NCPP/CdS, and PANI/NCPP/CdS, respectively. As shown in Figure 1e, the interplanar spacing of 0.38 nm observed in HRTEM can be indexed to the d-spacing of (002) planes of hexagonal CdS, indicating that the CdS nanorod grew along the [001] direction. The fast-Fourier transform (FFT) pattern (the inset in Figure 1e) obtained from the nanorod further confirms that the as-synthesized nanorod is hexagonal CdS. In addition, the HRTEM image of NCPP/CdS (Figure 1f) shows some extracrystalline and amorphous phases, compared with pristine CdS. The crystalline phase can be ascribed to NiCoP, confirmed by the FFT pattern shown in the inset of Figure 1f. The amorphous phase may correspond to NiCoPi, and FTIR confirms their existence later. Similarly, in the HRTEM image of PANI/NCPP/CdS (Figure 1g), we could also observe the corresponding crystalline phases of NiCoP and amorphous phase of NiCoPi. This is due to the incomplete coverage of PANI. Moreover, the energy-dispersive X-ray (EDX) spectrum and mappings (Figure 1h,i) show the presence of Cd, S, Ni, Co, P, C, and N elements in the sample, indicating that the CdS-based photocatalyst was constituent of CdS, NCPP, and PANI.
The crystal structure and phase purity of the as-prepared samples were examined by XRD, as shown in Figure 2a. For pure CdS, the characteristic diffraction peaks located at 24.8°, 26.5°, 28.2°,36.7°, 43.7°, 47.9°, 50.9°, 51.9°, 52.9°, and 58.4° correspond to the (100), (002), (101), (102), (110), (103), (200), (112), (201), and (202) planes of a hexagonal CdS (JCPDS card no. 41-1049), respectively. No impurity peak is found. Also, it can be seen that either single- or binary (NCPP and PANI)-loaded CdS exhibits similar XRD patterns to pristine CdS. The absence of signals corresponding to NCPP and PANI in the XRD patterns of the compounds is probably due to its low content or amorphous phase.
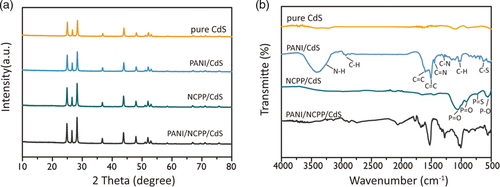
As shown in Figure 2b, the FTIR spectra of CdS, NCPP/CdS, PANI/CdS, and PANI/NCPP/CdS were compared to analyze the bond change after loading of cocatalysts and PANI. There is no obvious characteristic response in the spectrum of pure CdS. However, after loading NCPP, the FTIR spectra of NCPP/CdS and PANI/NCPP/CdS show some extra absorption. Specifically, in the spectrum of NCPP/CdS, the bands at 1050 and 907 cm−1 are due to PO stretching vibration. The broad absorption band in the range of 700–800 cm−1 is the feature of PS stretching vibration. The peak at 570 cm−1 is attributed to P–O bending vibration. All of these absorptions can be ascribed to phosphate, confirming the presence of phosphate. Meanwhile, after loading PANI, the FTIR spectra of PANI/CdS and PANI/NCPP/CdS composites show most of the characteristic bands of PANI. Specifically, the broad absorption band at 3420 cm−1 is attributed to the N–H stretching vibration of PANI, while a series of characteristic peaks around 3000 cm−1 are attributed to C–H stretching. The peaks at 1509 and 1602 cm−1 are due to the CC stretching vibrations of benzenoid and quinoid rings, respectively, and the peak at 1448 cm−1 corresponds to the CN stretching vibration. The peaks at 1293 and 1014 cm−1 are assigned to the C–N and C–H stretching modes, respectively. The band at 697 cm−1 is a distinctive characteristic of C–S stretching vibration. All the characteristic peaks belonging to phosphate and PANI described above can be seen in the spectrum of PANI/NiCoP/CdS, confirming the successful loading of NiCoPi and PANI on CdS. In addition, we also tested the FTIR of PANI/NCPP/CdS photocatalyst before and after the reaction to evaluate the stability of PANI. As shown in Figure S1, Supporting Information, characteristic peaks attributed to PANI were still clear before and after testing, indicating that PANI was not decomposed.
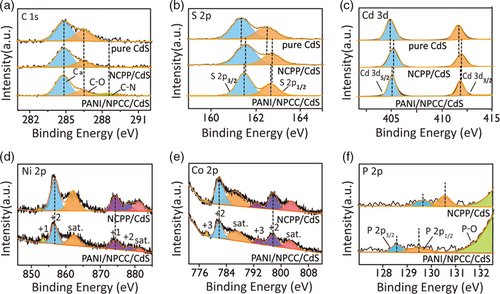
XPS analysis was performed to gain further insight into the chemical states and electron distribution of photocatalysts. Full spectra of pure CdS, NCPP/CdS, and PANI/NCPP/CdS samples are displayed in Figure S2, Supporting Information, for comparison. As shown in Figure 3a, the C 1s spectra of CdS and NCPP/CdS show physically adsorbed carbon species (284.8 eV) on the samples along with a small amount of carbon belonging to C–O or C–S binding (286.69 eV). However, after the loading of PANI, in addition to those two peaks, the peak of the CN bond was also observed at 288.52 eV, indicating that PANI has been decorated on the surface of CdS nanorods. As shown in Figure 3b,c, the S 2p XPS spectrum of CdS reveals two peaks at 161.70 and 162.89 eV belonging to S 2p 3/2 and S 2p 1/2, respectively, and the Cd 3d spectrum shows two peaks at 405.18 and 411.92 eV corresponding to Cd 3d 5/2 and Cd 3d 3/2, respectively.[ 46, 47 ] After loading NCPP, the binding energies of both S 2p and Cd 3d of NCPP/CdS are positively shifted, compared with those in CdS, implying that partial electrons are transferred from CdS to NCPP through the electronic interactions. However, after further loading PANI, the binding energies of both S 2p and Cd 3d of PANI/NCPP/CdS are negatively shifted again, compared with those in NCPP/CdS, indicating the electron movement from PANI to NCPP/CdS through electron delocalization. As shown in Figure 3d, the Ni 2p 1/2 region shows two peaks at 874.29 and 878.63 eV, corresponding to the binding energies of Ni1+ and Ni2+, respectively. The peaks for Ni 2p 3/2 are located at 856.83 and 856.64 eV, which are attributed to Ni1+ and Ni2+, respectively. For Co 2p spectra (Figure 3e), a pair of binding energies at 781.87 and 797.56 eV is attributed to Co2+, and the other pair at 777.93 and 789.92 eV is characteristic of Co3+.[ 48, 49 ] As shown in Figure 3f, for PANI/NCPP/CdS, P 2p 1/2 and P 2p 3/2 of P3− are located at 128.55 and 129.47 eV, respectively, and the peak at 133.51 eV is ascribed to P-O (P+5). The binding energies for both P3− and P5+ of PANI/NCPP/CdS are negatively shifted, compared with those in NCPP/CdS, implying that partial electrons are transferred from PANI to NCPP. Such shifting indicates the close interaction between PANI, NCPP, and CdS, beneficial to electron transport during HER. In a word, the above XPS results confirm the successful loading of PANI and NCPP and their interactions. In addition, we also tested XPS for the used samples after three consecutive cycles (as shown in Figure S3, Supporting Information). According to the atomic ratio from XPS before and after the reaction (Table S4, Supporting Information), the relative content of N or C–N is basically unchanged after the reaction, indicating the chemical stability of PANI during reaction.
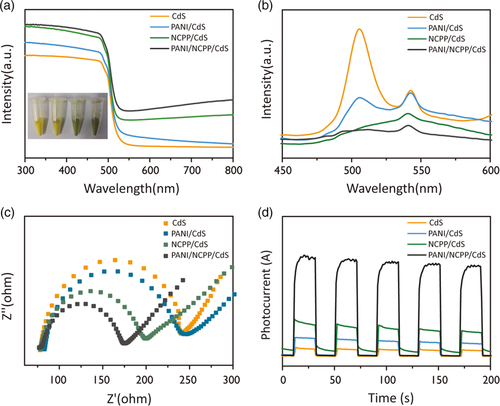
UV-vis diffuse reflectance spectra (DRS) of the obtained samples were measured to evaluate their light absorption capability. As shown in Figure 4a, all the photocatalysts exhibit the same absorption edge around 500 nm, associated with the bandgap of CdS. According to the Tauc plots (Figure S4, Supporting Information), the as-prepared CdS, PANI/CdS, NCPP/CdS, and PANI/NCPP/CdS have similar bandgaps around 2.42 eV. No significant shifts in the absorption edge and band gap are observed, indicating that Ni, Co, P, C, N elements were not doped into the crystal structure of CdS. However, the PANI/CdS, NCPP/CdS, and PANI/NCPP/CdS hybrids exhibit higher absorbance than bare CdS in the visible light range from 500 to 800 nm, along with the color change from light yellow to greenish (inset in Figure 4a). This result indicates that the target compound PANI/NCPP/CdS exhibits potential capability of harvesting solar light. The separation and migration of electron–hole pairs is one of the main factors affecting the performance of photocatalysts.[ 50, 51 ] In order to study this, PL emission spectroscopy, photocurrent response, and EIS were analyzed for prepared samples. Figure 4b shows the PL spectra of CdS, PANI/CdS, NCPP/CdS, and PANI/NCPP/CdS, measured at an excitation wavelength of 420 nm. All the samples exhibit two emission bands at 503 nm and 542 nm, corresponding to the band-edge emission and shallow trap state-related luminescence of CdS, respectively. Interestingly, PANI/CdS, NCPP/CdS, and PANI/NCPP/CdS exhibit decreased PL intensity, compared to pure CdS, and the emission of PANI/NCPP/CdS nearly vanishes, indicating that the loading of NiCoP and PANI both have a promoting effect on the separation of photogenerated electron–hole pairs (i.e., recombination inhabitation) in CdS. The charge carrier transfer was further investigated by EIS measurement,[ 52-54 ] shown in Figure 4c. It is clear that PANI/NCPP/CdS exhibited the smallest arc diameter in EIS Nyquist plots for all these materials, confirming that NCPP/PANI has a superior capability to transfer charge carriers. Figure 4d compares the on–off transient photocurrent responses for these four samples. The order of photocurrent is CdS < PANI/CdS < NCPP/CdS < PANI/NCPP/CdS. The photocurrent of PANI/NCPP/CdS is even higher than the sum of those of PANI/CdS and NCPP/CdS, indicating that the synergistic effects from NCPP and PANI result in the highest photoelectric conversion efficiency.
We tested the performance of hydrogen production by the prepared photocatalysts using 10% sacrificial agents. In our previous work, we adjusted the content of NCPP to optimize the acitivity of NCPP/CdS photocatalyst.[ 38 ] Based on that, we prepared PANI/NCPP/CdS photocatalyst in this work, and focused on the effect of PANI content on hydrogen production. As shown in Figure 5a, the hydrogen evolution by the composite catalysts presented a normal distribution with the loading amount of PANI. At the PANI loading content of 2%, the hydrogen production reached 170.3 mmol g−1 h−1 when using lactic acid as sacrificial agent, which is 2.1 times higher than that of 5% NCPP/CdS (80.8 mmol g−1 h−1) and 426 times higher than that of pure CdS (0.4 mmol g−1 h−1). A comparison of hydrogen evolution rates by different samples is shown in Figure 5b. The results indicate that an appropriate amount of PANI and NCPP can work synergistically to inhibit the recombination of photogenerated electrons and holes, thereby increasing photocatalytic activity. However, excessive loading of PANI can block the light absorption by CdS and the catalytic active sites on the surface, leading to decreased photocatalytic activity. Meanwhile, the apparent quantum yield (AQY) of PANI/NCPP/CdS under different wavelengths of light was measured. As shown in Figure 5c, the as-prepared photocatalyst exhibited highest AQY (49%) at the irradiation of λ = 420 nm.
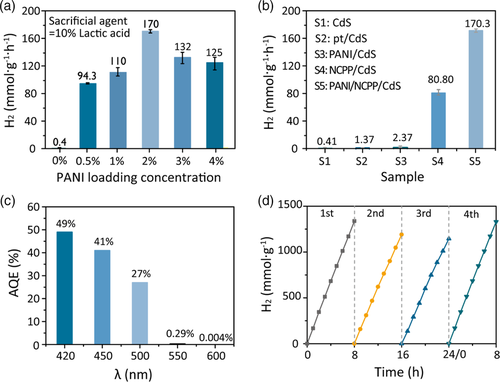
Photocatalyst recycling was carried out to assess the catalytic stability of PANI/NCPP/CdS nanohybrids. As shown in Figure 5d, PANI/NCPP/CdS was subjected to 3 consecutive cycles of photocatalytic reactions and each cycle lasted for 8 h with identical experimental conditions. Overall, the photocatalyst showed long-term catalytic stability until 24 h, although there was a slight decline in the last cycle, mainly owing to the consumption of the scavenge lactic acid. After three cycles, the photocatalyst was washed out and new lactic acid was added for another cycle of measurement (fourth cycle). The hydrogen evolution rate was recovered in the new cycle, similar to the first cycle. These tests show that the photocatalyst had good stability during hydrogen production. For long-term stability, the catalyst was tested stable for hydrogen production up to 96 h, as shown in Figure S5, Supporting Information.
Proton (H+) adsorption at the active sites is another key factor for photocatalytic hydrogen evolution. PANI shows tunable conductivity due to varied doping states at different pH values. As shown in Figure 6a, PANI can transform between undoped and doped states by adjusting pH values of the solution. For example, under acidic solution, HCl interacts with PANI to form proton-doped PANI, a p-type semiconductor with higher conductivity,[ 55 ] while under alkaline condition, hydroxyl neutralizes the protons to form undoped PANI with lower conductivity. Absorption spectra can demonstrate the switch of PANI between doped and undoped states in the range of pH = 1–14 (Figure 6b).[ 56 ] To demonstrate that PANI has the ability of capturing H+ from hydronium ions, the zeta potential of NCPP/CdS and PANI/CPP/CdS photocatalysts soaking in a catalytic reaction environment for 5 h was tested. As shown in Figure 6c, the zeta potential of NCPP/CdS and PANI/CPP/CdS was −10.22 and 3.68 mV, respectively. This suggests that the amine groups on polyaniline (PANI) captured H+ from hydronium ions and converted it into protonated amine groups, leading to a high H+ concentration on the surfaces of PANI/CPP/CdS. Meanwhile, FTIR of PANI/NCPP/CdS photocatalyst before and after the reaction further provided evidence of H+ doping of PANI. For example, compared with before testing, the peaks at 1509 cm−1 belonging to the CC stretching vibrations of benzenoid became stronger, while the CC peak at 1602 cm−1 typical of quinone became weaker, and the N–H peak became more obvious after testing. This suggests that the amine groups on polyaniline (PANI) captured H+ from hydronium ions and converted it into protonated amine groups, leading to a higher H+ concentration on the surfaces of PANI/CPP/CdS. What's more, we also tested photocatalytic hydrogen evolution by PANI/NCPP/CdS in different pH solutions, using methanol as sacrificial agent. Figure S6a, Supporting Information, shows that hydrogen production activity increases dramatically with the concentration of HCl used. This indicates that both high H+ concentration and high conductivity of PANI caused benefit to hydrogen production. Since different sacrificial agents provide different pH values in solution and ability to consume holes, and photocatalytic H2 production by PANI/NCPP/CdS using different sacrificial agents was also tested. As shown in Figure S6b, Supporting Information, PANI/NCPP/CdS shows the highest hydrogen production efficiency (170 mmol g−1 h−1) in the system using lactic acid as sacrificial agent.

Based on the above analysis, the mechanism of visible light-driven hydrogen evolution using PANI/NCPP/CdS as photocatalyst is proposed and shown in Figure 7 . In previous work, we confirmed the enhanced photocatalytic activity of CdS with uniformly dispersed metal phosphorus-based compounds (i.e., NCPP/CdS). Here, the photocatalytic activity was found to be further improved after loading an appropriate amount of PANI. The TEM and FTIR studies of the composite showed that PANI formed a uniformly dispersed, thin layer on the surface of CdS nanorods. Therefore, we focus on the multiple effects from PANI (Figure 7a). First of all, the zeta potential test of the PANI/NCPP/CdS composite proved that PANI has the ability to capture H+ from hydronium ions to promote hydrogen evolution, which was also confirmed by the activity tests at different pH conditions. In addition, Kong et al. studied the band structure of PANI and discussed the bandgap of protonated PANI (PANI-ES). They found that the π* orbital and π orbital edge potentials of PANI-ES were determined at −1.73 and 0.92 V versus Ag/Ag+ with relatively small bandgaps.[ 55 ] Therefore, the introduction of PANI will further expand the light absorption range of the photocatalyst, which was confirmed by DRS test. Furthermore, PANI can play an important role in the separation of photogenerated charge carriers, due to its energy-level matching with CdS and direct contact with NCPP. As shown in Figure 7b, the electrons (e−) in the valence band (VB) (1.7 V vs. Ag/Ag+ or 1.9 V vs. normal hydrogen electrode (NHE)) of the CdS semiconductor are excited to the CB (−0.72 V vs. Ag/Ag+ or −0.52 V vs. NHE) under visible light irradiation.[ 38 ] At the same time, the PANI can also absorb the photons, and the electrons on the highest occupied molecular orbital (HOMO) jump into the lowest unoccupied molecular orbital (LUMO). Due to the potential difference, the excited electrons in the LUMO of PANI can be injected into the CB of CdS. Then, due to the lower reduction potential of NiCoP (ø = 0.36 V vs. NHE),[ 38 ] the electrons are transferred from CdS to NiCoP to react with the enriched hydrogen protons. Simultaneously, due to the relatively low oxidation potential, the photogenerated holes can easily flow from the VB of CdS to the HOMO of PANI or NiCoPi (ø = 0.94 V vs. NHE),[ 38 ] effectively inhibiting the photocorrosion of CdS. In a word, the introduction of conductive APNI can effectively improve the photocatalytic hydrogen production through expanding the light absorption range, increasing the adsorption of hydrogen ions, enhancing the separation of photogenerated charge carriers, and inhibiting photocorrosion.

3 Conclusion
In summary, we designed and synthesized a hybrid photocatalyst comodified by oxidation and reduction cocatalysts together with a thin PANI layer. The optimized PANI/NCPP/CdS photocatalyst showed a hydrogen evolution rate of 170.3 mmol g−1 h−1 and an AQY of 49 % under the irradiation at 420 nm wavelength, which is 426 times higher than that of pure CdS (0.4 mmol g−1 h−1). The photocatalysts also exhibited remarkable photostability for four consecutive cycles of photocatalytic test with a total reaction time of 32 h. The increased activity of CdS can be attributed to the synergistic effect of NCPP and PANI. Due to the formation of double heterojunctions, photogenerated electrons and holes can be captured by the NiCoP and NiCoPi nanoparticles, respectively. Moreover, the formation of the protonated amine groups on PANI improves the accumulation of H+ on the catalyst surface, benefiting hydrogen evolution. PANI itself can be excited under visible light and form a type II composite with CdS, improving the light absorption and the separation of photogenerated charge carriers. Here, the concept of promoting the proton binding and charge transportation by coating an ultrathin layer PANI demonstrates a new strategy to utilizing multifunction conductive polymers in efficient photocatalysis for hydrogen production.
4 Experimental Section
Materials and Chemicals
All chemicals were of analytical grade, obtained from commercial suppliers and used without further purification. Cobalt (II) nitrate hexahy-drate (Co(NO3)2·6H2O), nickel(II) nitrate hexahydrate (Ni(NO3)2·6H2O), urea (H2NCONH2), ammonium fluoride (NH4F) aniline, ethylenediamine (C2H8N2), thiourea (NH2CSNH2), and potassium persulfate (K2S2O8) were purchased from Sinopharm Chemical Reagent Co., Ltd (China). Lactic acid, cadmium chloride hemi-penhydrate (CdCl2·2.5H2O), and NaH2PO2 were purchased from Aladdin. FTO glass was purchased from Wu Han Jinge Solar Energy Technology Co., Ltd (China).
Preparation of CdS Photocatalysts
The CdS nanorods were prepared via a solvothermal method.[ 46 ] In a typical procedure, 4.624 g Cd(NO3)2·4H2O and 4.624 g NH2CSNH2 were added into a 100 mL Teflon-lined stainless steel autoclave filled with 60 mL of ethylenediamine. The autoclave was then sealed and heated in an oven at 160 °C for 48 h. After cooling down to room temperature, the precipitates were collected by centrifugation and rinsed with ethanol and deionized water. The bright yellow powder of CdS nanorods was obtained after being dried at 60 °C for 24 h.
Preparation of NiCoP/NiCoPi (NCPP)/CdS Precursor
First, NiCo(OH) x was deposited onto CdS via a hydrothermal process. Then, NCPP/CdS hybrid was obtained via a phosphating reaction. Specifically, 500 mg of as-obtained CdS nanorods was added into a flask filled with 60 mL of deionized water. Varied amounts of Co(NO3)2·6H2O (48.965 mg), Ni(NO3)2·6H2O (48.925 mg), H2NCONH2 (101.050 mg), and NH4F (31.160 mg) with a molar ratio of 1:1:10:5 were added into the solution under strong stirring. After further stirring for 1 h, the solution was transferred into a 100 mL Teflon-lined autoclave and heated at 120 °C for 10 h. The product was collected, washed with water, and then dried at 60 °C for 24 h. The as-obtained CdS/NiCo(OH)x and an appropriate amount NaH2PO2 (296.050 mg) were placed separately in two porcelain boats and heated in a tube furnace at 300 °C for 2 h in N2 atmosphere. After cooling down to room temperature, the product was washed with water and ethanol and dried at 60 °C. The content of NCPP could be easily varied by the amount of nickel and cobalt source. A series of NCPP/CdS hybrids with different NCPP loading amounts was prepared.
Preparation of PANI/NCPP/CdS Photocatalysts
PANI was decorated on NCPP/CdS hybrid via solution polymerization. Specially, 200 mg of as-prepared NCPP/CdS hybrid was added into a flask filled with 60 mL of water. Varied amounts of aniline were added into the solution, which was stirred for 30 min to uniformly dissolve the aniline in the solution. Then, an amount of K2S2O8 with a 1:1 molar ratio of K2S2O8/aniline was added. After 12 h of polymerization, the product was washed with water and ethanol and dried at 60 °C. By changing the amount of aniline, a series of PANI/NCPP/CdS hybrids with different PANI contents of 1, 3, 5, 7, and 9 wt% was prepared.
Catalyst Characterization
The crystal structures of the as-prepared photocatalysts were detected by X-ray powder diffraction (RIGAKU Ultima IV) using a Cu Kα X-ray source (λ = 0.15406 nm). Transmission electron microscopy (TEM) imaging and elemental mapping were performed on a field-emission transmission electron microscope (FEI Talos F200S G2) with an energy-dispersive X-ray spectrum (EDS) system. X-ray photoelectron spectroscopy (XPS) analysis was carried out on a VG ESCALAB 250 spectrometer using a monochromatized Al Kα X-ray source. UV–vis DRS of the samples were measured on a Cary 500 spectrophotometer using BaSO4 as a reflectance standard. The chemical bonds in the catalysts were detected on a Nicolet 670 Fourier-transform infrared (FTIR) spectrometer. The photoluminescence (PL) was recorded by transient and steady-state fluorescence spectrum system (Edinburgh FL-FS 920 TCSPC) with an excitation wavelength of 420 nm.
Photoelectrochemical (PEC) Measurements
Photoelectrochemical (PEC) measurements were performed on a ZAHNES CAB120 Electrochemical System in a standard three-electrode cell with a photocatalyst-coated FTO as the working electrode, Pt wire as counter electrode, and Ag/AgCl electrode as reference electrode. The working electrode was prepared by dropping 20 μL of suspension of catalyst (10 mg mL−1 in DMF) onto the conductive surface of FTO plate and then dried at room temperature. A 0.5 M Na2SO4 solution was used as electrolyte, and a 300 W Xe lamp was used as light source. Electrochemical impedance spectroscopy (EIS) was measured using 10 mM K3[Fe(CN)6]/K4[Fe(CN)6] aqueous solution as electrolyte at 0.5 V external potential within a frequency range of 0.01–105.
Photocatalytic Hydrogen Evolution
Photocatalytic H2 evolution experiment was carried out in a Pyrex automatic online photocatalytic analysis system. In a typical procedure, 5 mg of the photocatalyst was dispersed in 100 mL aqueous solution containing 10 mL lactic acid as sacrificial agent. The reaction system was sealed and evacuated for half an hour. Then the suspension was irradiated by a 300 W xenon lamp equipped with a 420 nm cutoff filter. The amount of H2 produced was analyzed with an in situ-connected gas chromatography (Panna GC-A91).
Acknowledgements
The authors thank the Recruitment Program of Global Experts, National Natural Science Foundation of China (grant nos. 61605028 and 61775040), the Hundred-Talent Project of Fujian, Fujian Science & Technology Innovation Laboratory for Optoelectronic Information (no. 2021ZZ126), Stiftelsen Olle Engkvist Byggmastare (grant no. SOEB-2015/167), Swedish Energy Agency (grant no. 46641-1 and P2018-90098), and The Key Laboratory for Ultrafine Materials of The Ministry of Education at East China University of Science and Technology for financial support.
Conflict of Interest
The authors declare no conflict of interest.
Open Research
Data Availability Statement
The data that support the findings of this study are available from the corresponding author upon reasonable request.


