Impact of Surface Functionalization on the Intrinsic Properties of the Resulting Fe–N–C Catalysts for Fuel Cell Applications
Abstract
Herein, Fe–N–C catalysts are prepared from surface functionalized carbon nanotubes (CNTs) in combination with iron acetate and phenanthroline. An improved performance and structural composition is obtained by surface functionalization of the CNTs with indazole or pyridine. Catalyst composition and morphology are characterized by transmission electron microscopy, N2 sorption, photoelectron spectroscopy, and 57Fe transmission Mössbauer spectroscopy. However, activity and selectivity toward oxygen reduction reaction are determined from rotating ring disc electrode (RRDE) experiments. The durability and stability are evaluated by accelerated stress tests (0.0–1.2 V) and differential electrochemical mass spectroscopy (DEMS), respectively. It is shown that surface functionalization with indazole enables the direct attachment of FeN4 centers to CNTs so that no impurity species are detected and a high activity is achieved, that can be attributed to an improved turnover frequency and higher mass-based site density. Even more striking is the excellent durability and stability of the realized catalyst. While these trends are well pronounced in RRDE and DEMS, challenges in the preparation of membrane electrode assemblies make the trend not as obvious in fuel cells (FCs).
1 Introduction
Fe–N–C catalysts are the most promising catalysts to substitute Pt/C for the oxygen reduction reaction (ORR) within the low-temperature proton-exchange fuel cells (PEFCs) or the alkaline fuel cell (AFC). In addition to this, these classes of catalysts are of potential interest for metal air batteries and CO2 reduction. One drawback of PEFCs is the need of greater amounts of precious platinum metal for the sluggish ORR at the cathode. Graphitized carbon materials in conjunction with transition metals (e.g., Fe, Co, and Mn) and heteroatoms (N, S, and P) are a cost-effective alternative that can carry out the ORR at reasonable rates (comparable with Pt/C). Proietti et al. demonstrated high performance during PEFC tests with a Fe–N–C-based ORR catalyst.[1] Today's most active Fe–N–C catalysts are prepared from metal–organic frameworks, often in combination with phenanthroline.[1, 2] Though, the stability of these materials is still insufficient for commercial applications. Several degradation mechanisms have been proposed to explain the rapid current decay of Me–N–C catalysts during fuel cell (FC) operation.[3] Whereas carbon corrosion induced by the attack of H2O2, respectively, H2O2-associated radicals is to present the most accepted one.[4] To improve the resistance of the carbon-based backbone of Me–N–C catalysts against corrosion, an increased degree of graphitization is beneficial. Contrary, highly graphitized carbon structures tend to host less MeN4 active sites than disordered carbon. This leads to a disadvantageous activity–stability tradeoff for Me–N–C catalysts.
This work aims to implement multiwalled carbon nanotubes (MWCNTs) as the backbone of an Fe–phenanthroline-based Fe–N–C catalyst to minimize the fraction of disordered carbon in the catalyst. The positive impact of using MWCNTs as a carbon support has already widely been proven for the platinum-based systems. For example, Wang et al. showed that under potentiostatic conditions (60 °C, 0.5 m H2SO4 and 0.9 V vs reversible hydrogen electrode [RHE]) MWCNTs form less surface oxides. In addition, a 30% lower corrosion induced current compared with conventional Vulcan XC-72 carbon was found.[5] Similar results were reported by Hasché et al. when conducting stability tests (10 000 cycles and more). MWCNT-supported Pt catalysts exhibited smaller mass activity losses as well as less decrease in electrochemically active surface area (ECSA).[6] Related to activity changes, Maiyalagan et al. found that Pt supported on nitrogen-doped MWCNTs achieved a tenfold higher catalytic activity for ORR than commercial Pt/C.[7] Also in the preparation of Fe–N–Cs, MWCNT were already used as a support illustrating an improved stability in comparison with amorphous carbon blacks.[8] Chung et al. obtained a mixture of nanotubes and nanoparticles comprising iron, nitrogen, and carbon when pyrolyzing iron acetate in the present of cyanamide.[9] The resulting material showed excellent ORR activity (E1/2 = 0.87 V) as well as higher stability than commercial 20 wt% Pt/C (E–TEK) in alkaline media. Different groups attached Co–porphyrins or Fe–porphyrins on MWCNTs by physical adsorption or after dimerization of the porphyrin's triple bonds through Hay-coupling reaction.[10] Xia et al. prepared intentionally nanotube-containing Fe–N–C catalysts with good performance in acidic and alkaline electrolyte.[11]
Theoretical calculations by Gao et al. revealed low (≈15 eV)-to-zero activation energy barriers for the acidic ORR on FeN4/MWCNT.[12] Based on this, the ORR on FeN4 centers directly integrated in or attached to MWCNT should be beneficial compared with conventional turbostratic carbon.
Motivated by these publications, we applied a surface functionalization of MWCNTs to directly attach FeN4 centers to the MWCNTs.[13] The subsequent thermal graphitization of this mixture leads to firmly attached FeNxCy moieties on the surface of the nanotubes, as verified by transmission electron microscopy (TEM) and Mössbauer spectroscopy. This catalyst shows very high ORR activity and selectivity (acidic) during rotating ring disc electrode (RRDE) experiments. An onset potential of 900 mV and an average H2O2 yield of ≈1% were measured, and the improved durability in accelerated stress tests is demonstrated in comparison with the reference catalyst (without functionalization). Differential electrochemical mass spectroscopy (DEMS) reveals that MWCNT-based Fe–N–C catalysts are less prone to carbon oxidation than a carbon black based catalyst. In addition, our new synthesis strategy is promising for device integration.
2 Results
2.1 Synthesis of Catalysts and Reference Materials
MWCNTs were functionalized with pyridine or indazole by a diazonium salt reaction. The successful attachment of different molecules on the surface of MWCNTs through applying this synthesis procedure including a detailed characterization is described in a previous study.[13] This modification aims to enable a direct connection between the MWCNTs and the Fe–phenanthroline complex, e.g., by coordination of the nitrogen lone pair of indazole with the iron cation. A scheme of the preparation process is shown in Figure 1 and illustrates the assumed interaction between the functionalized MWCNTs and the Fe–phenanthroline complex. The detailed synthesis steps are given in Experimental Section. In short, the respective types of (functionalized) MWCNTs are dispersed in ethanol together with specific amounts of Fe(Ac)2, phenanthroline, and sulfur. After the evaporation of the solvent and mortaring, the mixture is heated to 800 °C in N2 atmosphere followed by an acid-leaching step (to remove inorganic Fe-species) and a second heat treatment in N2.[14]
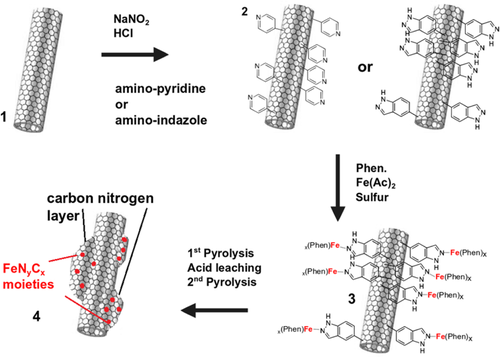
In total, four different MWCNT-based catalysts were synthesized from unmodified MWCNTs, pyridine-modified MWCNTs, and indazole-modified MWCNTs. The related catalysts are labeled FeNC, FeNCpyr, and FeNCind. As it turned out that the indazole-modified catalyst (FeNCind) showed the best results, a reference catalyst was prepared from unmodified MWCNTs but under the addition of a similar quantity of indazole prior to the pyrolysis. This reference catalyst should ensure that any beneficial effects are indeed related to surface functionalization rather than the addition of indazole. The related catalyst is named FeNCind–mix. Note that, the notation Fe–N–C refers to the general class of catalysts, whereas FeNC is an actual prepared catalyst within this work.
2.2 Verification of Improved Performance by Linking FeN4 Sites to MWCNTs
2.2.1 Activity and Selectivity Study
Figure 2a shows the cyclic voltammograms (CVs) of the four catalysts measured in N2-saturated 0.1 m H2SO4. It becomes clear that induced by the functionalization of the MWCNTs prior to the pyrolysis, a significant higher double layer capacity CDL is obtained. Even the addition of indazole leads to the double in capacity as compared with FeNC. The polarization curves in N2-saturated electrolyte obtained with a faster sweep of 100 mV s−1 are shown in Figure S1, Supporting Information. The benefit of surface functionalization on ORR activity is illustrated by the RRDE experiments shown in Figure 2b,d. The ORR polarization curves for different rotation rates and the Tafel plots related to the kinetic current density calculated from rpm1500, respectively, are shown in Figure S2 and S3, Supporting Information.
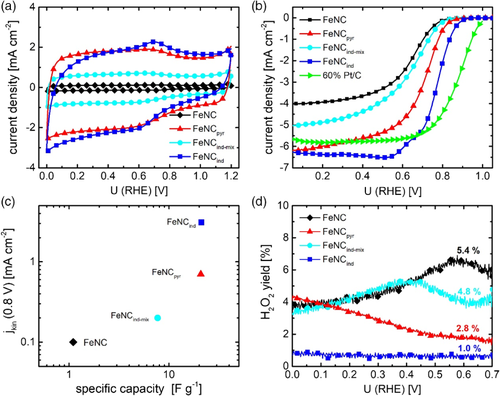
Please note, the measurements were obtained for a large catalyst loading of 0.8 mg cm−2 for better comparison with other Fe–N–Cs.[15] Again, also here, onset potential and kinetic current densities jkin follow the order FeNCind > FeNCpyr > FeNCind-mix > FeNC, whereas the average H2O2 formation is exactly opposite in trend. The average value of hydrogen peroxide formation was obtained from all data points at U < 0.7 V. In Figure 2c, the relation between jkin and CDL is shown. As for Fe–N–C catalysts, the molecular active FeN4 centers contribute directly to the double layer capacity, its size is a measure of the electrochemical active surface area. Thus, one would expect that more active catalysts reveal a higher CDL. Note, the only difference between CNTind and CNTind-mix is the surface functionalization step for CNTind. Based on the adsorbed quantity of indazole in CNTind, indazole was just added to the precursor mixture in the synthesis of CNTind-mix. Thus, we assume that the improving effect in terms of activity for CNTind in comparison with CNTind–mix must at least to some extent be related to the surface functionalization. Indeed, for macrocyclic systems, it was shown by experiment and density functional theory (DFT) calculations, that a covalent interaction versus adsorption favors the electron transfer and leads to an improved performance.[16] On the basis of DFT calculations, Cao et al. suggested that pyridine groups on the surface of the carbon nanotubes (CNTs) can directly interact with the iron centers of iron phthalocyanine molecules leading to a rehybridization of the Fe 3d orbitals as origin of an improved performance.16 Even though, in our case, the preparation involved a heat treatment, we assume that a similar interaction might enhance the performance of active sites and avoid their disintegration during the pyrolysis step.
2.2.2 Transmission Electron Microscopy
TEM pictures were recorded to validate the morphology of the catalysts. The aim was to understand if the carbon morphology and distribution looks different for the differently prepared catalysts. The pictures are shown in Figure 3, and additional pictures are shown in Figure S4, Supporting Information.
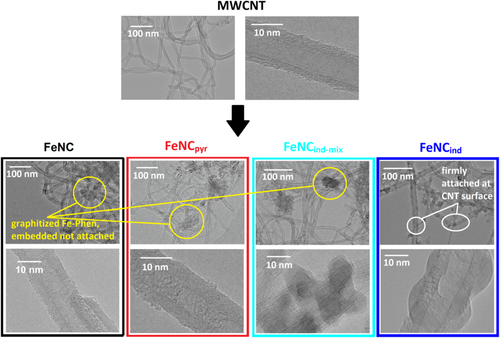
As shown in Figure 3, the pristine MWCNTs possess a diameter of about 10 nm and comprise several parallel graphene sheets rolled together into a tube. After subsequent pyrolysis of the MWCNTs in the presence of Fe(Ac)2, phenanthroline, and sulfur, the MWCNT substructure remains intact for all prepared catalysts. The stability of the MWCNTs during the heat treatment in N2 at 800 °C is an expected result, as confirmed by thermogravimetric analysis (TGA).[17] In the TEM images of the four catalysts in Figure 3 and Figure S4, Supporting Information, in addition to the MWCNT-type carbon, additional areas with amorphous carbon are visible and in some cases, even nanoparticles. The amorphous carbon is attributed to the in situ-formed carbon from the pyrolysis of the added FeNC precursors (Fe(Ac)2, phenanthroline, and sulfur). While this carbon seems firmly attached to the MWCNTs of FeNCind, are found in addition or in between the MWCNT network without a direct attachment or linkage to the tubes in case of FeNC, FeNCpyr, and FeNCind-mix. The pictures recorded at higher magnification (bottom row) clearly show, that the surface of the MWCNTs is clean of any pyrolysis residues. While the behavior is expected for FeNC and FeNCind-mix, one would assume interactions with the iron cations through the electron lone pair of the nitrogen atom for FeNCpyr. However, this interaction seems either not to occur or it is not decisive enough to result in the desired structure of directly attached FeNxCy moieties on top of the MWCNTs’ surface.
In contrast to all other catalysts, the TEM pictures of FeNCind reveal that the in situ-formed carbon is directly attached to the outside of the MWCNT walls. Based on this, we assume a better connection of the FeNx active sites and the MWCNT. Thus, the benefit of, e.g., higher electron conductivity that is known to improve Fe–N–C catalyst performance[18] could possibly be used to improve our catalysts.
2.2.3 BET Specific Surface Area
The Brunauer–Emmett–Teller (BET) specific surface area of the different materials was determined through N2 sorption measurements, as shown in Figure S5 (N2 sorption isotherms) and S6 (comparison of BET surface areas), Supporting Information. For reasons of comparison, the BET surface areas of the pristine MWCNTs[19] (MWCNTpristine) and after acid leaching and pyrolysis (MWCNTT,AL) are added. Induced by thermal and chemical treatments, the BET surface area of the MWCNTs increases from 300 to 377 m2 g−1. After the synthesis steps involving Fe–phenanthroline, the specific surface area of most of the materials is lower. The lower BET surface area of the catalysts in comparison with the acid washed and annealed MWCNTs is due to the contribution of the pyrolyzed Fe-phenanthroline. Related to that, Schardt et al. found a specific surface area of 295 m2g−1 for a very similar synthesis approach of Fe–phenanthroline and sulfur mixture.[20]
After clarifying that the beneficial activity and selectivity of FeNCind is indeed related to the surface functionalization of the MWCNTs (and not just to the mixing of MWCNTs with indazole), we will focus for the more detailed structural characterization on the three catalysts FeNC, FeNCpyr, and FeNCind.
2.3 In Depth Physicochemical Characterization
2.3.1 X-Ray Photoelectron Spectroscopy
X-ray photoelectron spectroscopy (XPS) was used to determine the surface near elemental composition of all catalysts as well as to investigate the chemical state of nitrogen in the different catalysts. XPS survey and Fe 2p spectra are shown in Figure S7 and S8, Supporting Information, respectively. The N 1s spectra of the three samples as well as the comparison of O 1s spectra are shown in Figure 4. For the three catalysts, similar nitrogen species were present. While in case of FeNC and FeNCpyr, the relation between NMeN and Npyrrole seems equal; for FeNCind, either the NMeN peak seems lower, or a more intense Npyrrole peak is found. In a recent work, Marshall-Roth et al. suggested that for FeN4 centers with pyridinic type of coordination the peak related to the interaction with iron is shifted to higher binding energies, overlaying with what is commonly called Npyrrolic and also labeled as shown in Figure 5.[21] As all samples were pressed on indium foil during XPS measurements, indium oxide can further contribute to the O 1s signature. Nevertheless, it becomes clear, that the FeNC catalyst (without functionalization of the MWCNTs) contains a larger fraction of oxygen and more oxygen that might be related to metal oxide (either from indium oxide or iron oxide). The possibility of iron oxide species will be discussed in more detail in the following paragraphs.
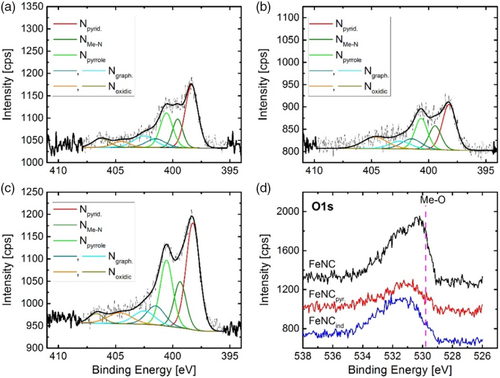
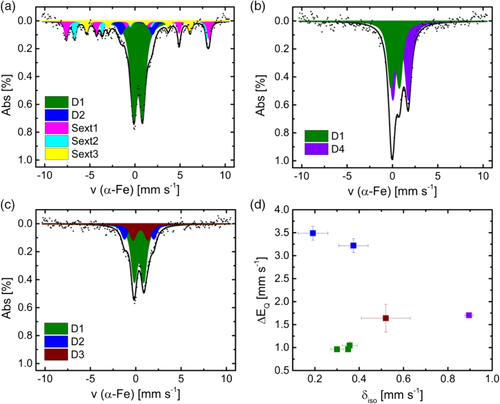
Table 1 shows the elemental composition as derived from XPS. All investigated catalysts contain a similar amount of iron. However, as shown in Figure S8, Supporting Information, it becomes also clear that the measurements are carried out at the detection limit and the error related to the iron content might be far high. The nitrogen content increases in the order FeNC < FeNCpyr < FeNCind. The nitrogen content assigned to metal nitrogen bonds was related to the overall iron content to get an idea to what extent FeN4 sites can be present in the catalysts or not. The ratio [NMeN]/[Fe] is almost equal for both catalysts obtained after surface functionalization and significantly larger as compared with the pure FeNC.
| [Fe] [at%/wt%] | [N] [at%/wt%] | [O] [at%/wt%] | [C] [at%/wt%] | A(NMeN)/% | [NMeN] [at%/wt%] | [NMeN] [Fe]−1 | |
|---|---|---|---|---|---|---|---|
| FeNC | 0.23/1.05 | 1.65/1.88 | 3.55/4.62 | 94.6/92.5 | 13.4 | 0.22/0.25 | 1.0 |
| FeNCpyr | 0.19/0.87 | 2.15/2.46 | 2.15/2.81 | 95.5/93.6 | 14.9 | 0.32/0.37 | 1.7 |
| FeNCind | 0.31/1.41 | 3.25/3.70 | 2.70/3.51 | 93.6/91.4 | 14.4 | 0.47/0.53 | 1.5 |
However, this value is always far below the expected minimum value of four (related to four nitrogen atoms coordinating to iron). If the nitrogen content related to Npyrrolic (or pyridinic N bond to metal) is also considered, values of, approximately, four are calculated for both catalysts obtained from functionalized MWCNTs and 2.5 for the FeNC catalyst from pristine MWCNTs.[21] Thus, in principle, a fourfold coordination of iron by nitrogen atoms would be possible for both catalysts derived from functionalized MWCNTs, whereas it is clear, that FeNC prepared from pristine MWCNTs must contain some iron-containing side phases.
To deepen the knowledge of iron species in these catalysts, Mössbauer spectroscopy will be discussed in the following before the turnover frequency (TOF) and mass-based site density (MSD) are determined.
2.3.2 57Fe Mössbauer Spectroscopy
Mössbauer spectroscopy can give important insights on the structural composition with respect to iron. Figure 5a–c shows the Mössbauer spectra of the catalysts, and Figure 5d compares isomer shift and quadrupole splitting of the doublets. For all catalysts, the Mössbauer spectra are dominated by the so-called D1 doublet that can have different origins as FeN4 sites of different oxidation and spin states, as well as iron and iron oxide clusters.[22] In addition to this doublet, FeNC contains three sextets and a second doublet D2. Here, the large quadrupole splitting of D2 points to a large electric field gradient as typically found for ferric intermediate spin species. One possible assignment might be FeN4 with weak axial ligands.[23] The three sextets are assigned to the A- and B-sites of Fe3O4 and α-FeOOH (in this order).[24] Thus, sextet 1 is similar to Fe3+ in a tetrahedral, sextet 2 is related to Fe2.5+ in an octahedral and sextet 3 is related to the distorted octahedral which is edge- and corner-shared in a 3D fashion as found for goethite. Such inorganic species have been found to be both, less active and less selective during ORR and could thus explain the worse activity of FeNC in comparison with the other catalysts (Figure 2).[25]
For FeNCpyr, only two doublets are obtained. The second doublet found in this catalyst, labeled D4 is a ferrous high-spin site. Such isomer shift values are typically for a fivefold coordination of iron with nitrogen or oxygen. Quadrupole splitting and isomer shift are smaller compared with another doublet often found in catalysts prepared in Jean-Pol Dodelet's group.2, 3, 26 The Mössbauer spectrum of FeNCind contains three doublets. D1 and D2 similar to FeNC, whereas the third doublet D3 has Mössbauer parameters typically found for ferrous FeN4 environments with intermediate spin.[23] Table 2 shows the Mössbauer parameters, absorption areas, and iron species assignments for the investigated catalysts. Detailed summary of the fitting process is given in the Supporting Information. In general, we like to point out that the assignment of doublets in this work is still in comparison with macrocyclic complexes, even though it is known that the carbon environment of the graphene layers can have an impact on the electron density found at the iron centers.[27] Indeed, in our recent work, we show that isomer shift and quadrupole splitting can change dramatically with increasing number of carbon atoms surrounding the FeN4 centers.[28] However, so far, there are no good models existing and more work is required to enable a reliable calculation of Mössbauer parameters for FeNC catalysts on the basis of DFT.
| FeNC | FeNCpyr | FeNCind | Assignm. | |||||||
|---|---|---|---|---|---|---|---|---|---|---|
| δ iso [mm s−1] | ΔEq [mm s−1] | A [%] | δ iso [mm s−1] | ΔEq [mm s−1] | A [%] | δ iso [mm s−1] | ΔEq [mm s−1] | A [%] | ||
| D1 | 0.35 | 0.96 | 59.0 | 0.30 | 0.96 | 44.0 | 0.36 | 1.05 | 63.0 | L2FeN4 (2+, S = 0) or LFeN4 (3+, S = 5/2) or clusters |
| D2 | 0.19 | 3.49 | 9.0 | – | – | – | 0.37 | 3.22 | 18.2 | FeN4 (3+, S = 3/2) |
| D3 | – | – | – | – | – | – | 0.52 | 1.64 | 19.0 | FeN4 (2+, S = 1) |
| D4 | – | – | – | 0.90 | 1.70 | 56.0 | – | – | – | FeL5 (2+, S = 2), L = O, N |
| δ iso [mm s−1] | H [T] | A [%] | ||||||||
| Sext1 | 0.31 | 49.1 | 12.5 | – | – | – | – | – | – | A-site Fe3O4, tetrahedral |
| Sext2 | 0.65 | 45.6 | 11.8 | – | – | – | – | – | – | B-site Fe3O4, octahedral |
| Sext3 | 0.37 | 35.6 | 7.8 | – | – | – | – | – | – | α-FeOOH, distorted octahedral |
It is worth mentioned that FeNC contains inorganic iron species in addition to the existing FeN4 centers. For both catalysts obtained from functionalized MWCNTs FeNCpyr and FeNCind, the existence of FeN4-only species could be possible; however, more likely is the overlay with some oxidic clusters or other impurity species.
After having clarified the structural composition of the catalysts, we would like to what factor the improvement in ORR activity is attributed and if the intended benefit of an improved durability is indeed found for these catalysts.
2.4 Determination of TOF and Mass-Based Site Densities
The ORR activity has two contributing factors: the TOF and the MSD.
From the mass-related concentration of nitrogen in metal nitrogen bonds, the MSD of FeN4 centers in these catalysts can be determined. As the ratio of molar masses of iron and nitrogen accounts for 4:1, whereas the ratio of iron to nitrogen atoms in each active site is assumed as 1:4, the mass-related concentration of nitrogen in metal nitrogen bonds is equal to the mass-related concentration of iron in active sites. The maximum MSD obtained in this work is 5.7 × 10¹⁹ sites gcat−1 for FeNCind.
From the kinetic current densities shown in Figure 2c together with the catalyst loading, the mass-related kinetic current densities can be determined. If these values are related to the MSDs of the different catalysts, the TOF can be obtained. In Figure 6, the TOFs of the catalysts are shown as a function of the MSDs. To maximize the overall current density, both values should be maximized. However, depending on the optimization strategy often only either the MSD or the TOF become better. For example, where the enhancement of TOF and MSD were reported typically compare quite different preparation routes with each other.2
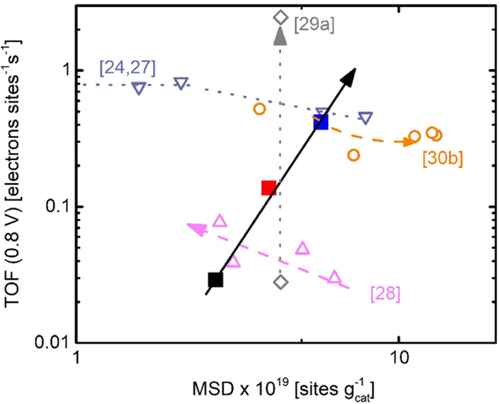
Optimization strategies for Fe–N–C catalysts include the amount of the iron precursor,[26, 29] an increase in pyrolysis temperature,[30] a subsequent heat treatment in NH3[31] or the addition of a second nitrogen precursor,[32] the related effects are shown in Figure 6 for other Fe–N–C catalysts using an additional carbon precursor. To the best of the authors’ knowledge for a distinct variation series, so far, never an enhanced TOF and MSD was reported at the same time. The approach using surface functionalized MWCNTs within the synthesis as done in this work improves both MSD and TOF for the FeNCind catalyst in comparison with FeNC and FeNCpyr, underlining the benefit of this preparation route.
2.5 Durability and Stability Testing
2.5.1 Potential Cycling in N2 Saturated Electrolyte (25 °C)
In Figure 7, the changes induced by cycling on the ORR and on the capacity are shown for FeNC (Figure 7a,b), FeNCpyr (Figure 7c,d), and FeNCind (Figure 7e,f). The change in half-wave potential decreases in the order FeNC > FeNCpyr > FeNCind. Considering the Tafel slope of 70 mV dec−1 that is also typical for this catalysts (Figure S9, Supporting Information, for Tafel plots with the beginning of test (BOT) and end of test (EOT) graphs),2, 14, 29 the related changes in half-wave potential would cause changes in current densities of 40%, 20%, and <5% for FeNC, FeNCpyr, and FeNCind, respectively. Even though the potential range and number of cycles are both larger (or equal), the decrease in our best catalyst is significantly less in comparison with other Fe–N–C catalysts prepared with in situ-formed carbon.[33] Table S1, Supporting Information, shows our results in comparison with other Fe–N–C catalysts which were also subjected to durability tests.
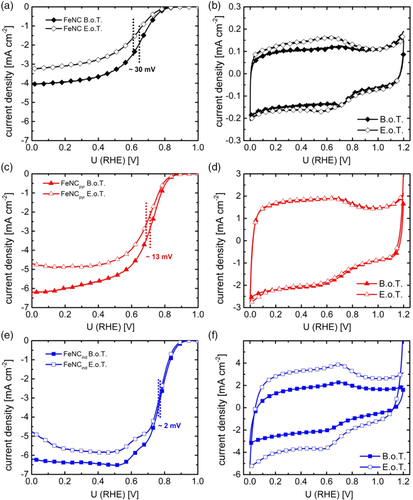
The observed trends are in good accordance with the structural composition derived from XPS and Mössbauer spectroscopy. FeNC contains additional inorganic Fe species. These species tend to dissolve more easily than FeNxCy moieties, as shown by a comparative operando spectroscopic analysis of different catalysts under RRDE and FC conditions.[34] This illustrates the beneficial effect of using functionalized MWCNTs in the preparation of FeNC catalysts.
The durability cycling was conducted in N2-saturated electrolyte to avoid the simultaneous appearance of ORR and avoiding H2O2 formation. As explained in Section 1, H2O2 formation is discussed by different groups as origin of a faster deactivation.4, 33 Nevertheless, a clear dependence of the durability on the H2O2 formation rate of the catalysts is evident when the average hydrogen peroxide formation and the change in half-wave potential are compared. Figure S10, Supporting Information, shows the hydrogen peroxide formation for the catalysts at BOT and EOT. As discussed by others, it can be assumed that hydrogen peroxide is formed on a different catalytic site than water.4, 35 The fact that catalysts with higher hydrogen peroxide formation (and thus more related catalytic sites) are less stable in durability cycling could indicate that the catalytic sites for hydrogen peroxide formation are less stable under such cycling conditions than those catalytic sites which are responsible for the direct reduction of oxygen.
Similar to Kumar et al., an increase in double layer capacity is observed for FeNC and FeNCind. This increase is explained either by the introduction of surface oxygen functional groups or an increase in carbon surface area through the formation of new pores.33 Both, the formation of surface functional groups and the formation of new pores are caused by carbon oxidation and describe different stages of the process.[36] Interestingly, the capacity of FeNCpyr remains unaffected, illustrating the benefit of both strategies for surface functionalization.
2.5.2 Differential Electrochemical Mass Spectroscopy
To further explore the beneficial effect of the functionalized MWCNTs in comparison with commercial carbon blacks, the most active and stable catalyst found so far FeNCind was compared with a state-of-the-art Pt/C and carbon-supported porphyrin-based Fe–N–C catalyst (CB–FeNCporph).
The used half-cell setup uses a catalyst spray-coated gas diffusion layer in combination with a membrane and allows for measurements under gaseous flow conditions. Thus, the obtained results come close to the real application conditions of a FC. All details about the DEMS setup are given in a previous study.[37] For the DEMS experiments, FeNCInd was comparatively investigated to Pt/C and a carbon-black phorphyrine-based (CB–FeNCporph) catalyst.
The aim was to investigate and compare the carbon corrosion behavior of the novel structure (attached Fe–N–C moieties to MWCNT substructures as found for FeNCind) to reference materials. Linear sweep voltammetry (LSV) was conducted from 0 to 1.4 V under N2 at 23 and 60 °C. In addition to the electrochemical data, the mass spectrometer (MS) of the DEMS setup simultaneously recorded the ion current of CO2 (m/z = 44), the results are shown in Figure 8.
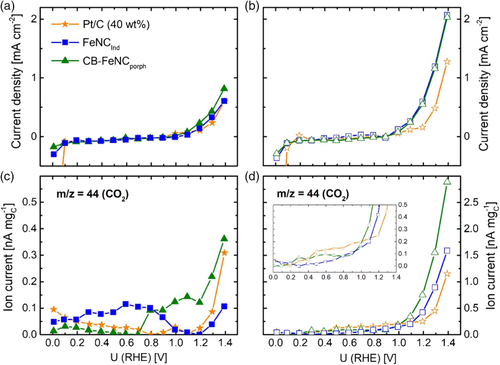
The upper graphs show the electrochemical data and the lower graphs display the respective ion currents. Considering the LSV data, the typical electrochemical response for Pt/C and both Fe–N–C catalysts is obtained. While in RRDE, specific redox peaks were found for some catalysts (Figure 2), which are less pronounced for the DEMS measurements. Similarly, this phenomenon was observed by Jurzinsky et al. by studying parasitic methanol oxidation during ORR applying the same DEMS setup.[38] The phenomenon is explained due to different transport behavior and surface conductivity of the differing interfaces of Catalyst/Nafion (DEMS) to Catalyst/H2SO4 [rotating disc electrode (RDE)/RRDE].[39] For both Fe–N–C catalysts, almost featureless curves arise between 0 and 1.0 V, whereas at higher potentials an oxidative current is measured. As simultaneously, CO2 is detected in the MS, the current density is ascribed to carbon oxidation. This oxidative current is distinctively more pronounced for the measurements carried out at elevated temperature of 60 °C (Figure 8b,d). A similar featureless electrochemical response for the middle potential range is obtained for the Pt/C catalyst. Contrary, for low potentials, the Pt/C catalysts show the typical hydrogen adsorption/desorption and hydrogen evolution behavior which is indicated by the measured reductive current. For the experiments conducted at 60 °C, the Pt-based material shows an overall lower oxidative current density for the high potential range compared with both Fe–N–C catalysts. The simultaneously recorded ion currents of CO2 show that there is a small potential delay of about 50–100 mV between electrochemical oxidation current densities and ion currents due to the fact that the electrochemical current includes surface oxidation processes which take place prior to the complete oxidation of carbon to CO2. When comparing the CO2 formation of the three catalysts at 23 °C, it appears that the CB–FeNCporph produces slightly more CO2 but the difference is not distinctively. On contrary, for the experiments at 60 °C, not only the overall electrochemical oxidative currents but also the overall ion currents are significantly enhanced. Further, there is a slight onset shift of the oxidative currents to lower potentials. Both effects are ascribed to the temperature dependence of the carbon corrosion process and emphasize the importance of performing measurements at elevated temperatures (PEFC usually runs at 80 °C), as e.g., also pointed out in Kumar et al.33 Considering the ion currents, the intensity of the carbon corrosion follows the trend CB–FeNCporph > FeNCind > Pt/C. Thus, it is concluded that CB-FeNCporph is significantly less stable against carbon corrosion compared with the other catalysts. For FeNCind, the ion current at 1.4 V reaches about 1.6 nA mgC−1 (current per mass of carbon). For Pt/C, it is about 1.2 nA mgC−1. However, for lower potentials (0.8–1.0 V), Pt/C shows the highest CO2 formation of all investigated catalysts. This might be explained by the catalytic effect of Pt on the carbon oxidation reaction.[40] In total, DEMS experiments reveal that at higher potentials and elevated temperatures Fe–N–C catalysts in general show stronger carbon oxidation than commercial Pt/C. However, still our FeNCind shows only half of the CO2 formation compared with CB–FeNCporph.
2.6 Application in PEFCs
The activities of the catalysts were investigated in PEFC single-cell tests. The polarization curves of FeNC, FeNCpyr, and FeNCind in H2–O2 PEFC are shown in Figure 9. Here, the beneficial effect of surface functionalization of the CNTs (prior to pyrolysis) on the ORR is not as pronounced compared with RDE. The activity at 600 mV decreases in the order FeNCind (161 mA cm−2) > FeNC (130 mA cm−2) > FeNCpyr (123 mA cm−2). Thus, still FeNCind is more active than the other two catalysts, however, the performance of the materials is more similar to each other than during RRDE. For reasons of comparison, Figure S11, Supporting Information, compares the performance of these catalysts to a commercial Pt/C catalyst. As the activity of Pt/C is in the expected range, we assume that material related effects might be responsible in case of the Fe–N–C catalysts. A possible explanation for the low performance is that the Nafion content of the investigated catalysts in this work has been fixed to 35 wt%. However, it has been shown that the optimum Nafion content can vary strongly depending on the respective catalyst material.15, 41
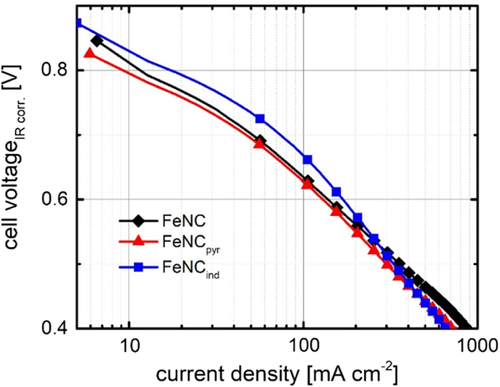
Despite this, the FC performance is low compared with other phenanthroline-based catalysts.[42] But it is equal to other Fe–N–C catalysts containing CNTs, even though our loading was less than half.[11] Indeed, it is difficult to prepare firm catalyst layers from the nanotube containing catalysts. Based on this, we assume that with further optimization of the electrode preparation process, a further improvement will be possible, that eventually then reflects the same trend as found in RRDE.
3 Conclusions
In this work, a new synthesis method is presented which firmly attaches FeNxCy formed by the pyrolysis of iron phenanthroline to a MWCNT substructure. Induced by a functionalization of the MWCNTs with indazole. It is assumed that during the mixing with iron and phenanthroline, the electron lone pair of indazole can interact with the iron centers. Based on that the in situ-formed carbon results in a better electronic interaction with the MWCNTs, which results in high ORR activity and excellent selectivity of FeNCind. The beneficial effect can be attributed to both, an enhanced TOF and MSD. As shown by Mössbauer Spectroscopy, the iron phases present in the catalysts seem to be of molecular FeNxCy-type. An excellent durability is found in comparison with the other catalysts investigated in this work, whereas the combined interpretation of selectivity and durability testing points to less stable H2O2 generating sites as compared with the catalytic sites for water formation. By DEMS, the improved stability toward carbon corrosion is confirmed and associated to the presence of the MWCNTs in the catalyst. Unfortunately, it was more difficult to achieve equally good FC performance as found by RRDE. This is attributed to problems in the preparation of homogeneous cathode catalyst layers of the MWCNT-structured materials. Indeed, the difference in interfaces under RRDE (catalyst/H2SO4) and FC (catalyst/Nafion) conditions might play a role. Nevertheless, this work emphasizes that azo-coupling reactions might be a useful strategy for attaching FeN4 sites or other nonprecious metal catalysts to nanostructured carbon as CNTs. This makes the synthesis not only attractive for Fe–N–C synthesis but for a broad field of application.
4 Experimental Section
Pretreatment of MWCNTs
The MWCNTs, Nanocyl7000 were purchased from Nanocyl SA. Due to metal impurities of the MWCNTs, a prior acid leaching step was done. For this purpose, 2 g Nanocyl7000 were dispersed in 300 mL concentrated HCl and 200 mL H2O, then stirred at 90 °C for 4 h. The dispersion was cooled down to room temperature (RT) over night, then filtered, and washed until neutral pH value. Subsequently, the acid-treated MWCNTs underwent a heat treatment to 800 °C under N2 atmosphere to remove excessive oxygen-containing surface groups and to heal possible defects caused by the acid leaching step. The applied heating ramp was 450 °C h−1, and the final temperature was held for 1 h. The acid-washed and heat-treated MWCNTs were then used directly in the synthesis (FeNC and FeNCind-mix) or underwent a further functionalization step with the respective amines (FeNCpyr and FeNCind).
Functionalization
All detailed steps for the diazonium salt-driven surface modification are described in detail in a previous study.[13] A short summary is given in the following paragraphs. In this work, 4–aminopyridine (98%, Alfa Aesar), 5-amino-1H-indazole (98%, Alfa Aesar) and sodium nitrite (98%, Carl Roth) were used for the functionalization step. In 20 mL of deionized water, 0.765 g of 5-amino-1H-indazole were dissolved together with 0.5 g of sodium nitrite. The solution temperature was adjusted and kept at 0 °C through an ice bath cooling over the whole reaction time. About 15 mL of concentrated HCl was added slowly. Afterward, a cooled dispersion of 50 mg cleaned Nanocyll7000 in 50 mL deionized water was added. The solution was kept at 0 °C for 20 h. The final product was obtained after filtering, washing with acetone and water mixture (1:1) until the filtrate was colorless and dried at 80 °C in air. A resulting yield around 55 mg was obtained.
Catalyst Synthesis
For the synthesis of the FeNC catalysts, Fe(Ac)2 anhydrous (min 29.5% Fe, Alfa Aesar), 1,10-phenanthroline (99%, Alfa Aesar), and sulfur (99,5%, Carl Roth) were used. Therefore, 200 mg of MWCNTs (or 200 mg of functionalized MWCNTs) were mixed with 95 mg Fe(Ac)2, 255 mg 1.10-phenanthroline, and 3 mg of sulfur in a mortar. The mixture was then dispersed in 5 mL EtOH for 20 min and subsequently dried at 80 °C in air. The dried powder was grinded again in the mortar and transferred into quartz glass boats which were placed in a quartz glass tube of a furnace (CarboLite HZS/12/900). Afterward, the sample was heated with 300 °C h−1 under N2, first up to 300 °C then 500 °C were the temperature was held for 30 min, each. The final temperature was 800 °C, where the material was dwelled for 60 min. The acid leaching step was conducted after the oven was cooled down to a temperature below 80 °C in 200 mL 2 m HCl for 2 h while sonicating and bubbling N2 through the mixture. The catalyst was filtered, washed with H2O, and dried. The powder then underwent a second heat treatment to heal the effects of the acid leaching by heating it under N2 atmosphere to 700 °C for 60 min, again applying a heating rate of 300 °C h−1. For the preparation of FeNCind–mix, 190 mg of MWCNTs mixed with 10 mg of 5-amino-1H-indazole was used.
Transmission Electron Microscopy
A FEI-Philips CM20 (LaB6 electrode, 120 kV acceleration) was used to record the TEM pictures. Therefore, in ethanol, dispersed sample was pipetted onto a conventional copper TEM grid with carbon film (S147-4 Plano), dried and transferred into the FEI CM20.
N2 Sorption Measurements
The specific surface areas of the catalysts were determined by recording N2 adsorption and desorption isotherms. The used instrument was an Autosorb-3B (Quantachrome, Boynton Beach, FL, USA). Similarly, the software to analyze the obtained data was provided by Quantachrome. Degassing of the respective samples (≈40 mg) was carried out at 200 °C under vacuum for 18 h. The BET method was applied to determine the surface area.
57Fe Mössbauer Spectroscopy
Mössbauer spectra were recorded in constant acceleration mode with a 57Co/Rh source at RT. All samples were measured without isotopic enrichment, typically 80–100 mg were used and measured about 3–4 days. The measurements were carried out in transmission mode within a velocity range of ±10 mm s−1, calibration of the velocity axis was made with respect to α-Fe. The spectra resolution is given by the 1024 multichannel analyzer, resulting in 512 points and the chosen velocity, leading to a step size of 0.08 mm s−1. The program “Recoil” was used for fitting the spectra.
X-Ray Photoelectron Spectroscopy
XPS measurements were carried out using a SPECS Phoibos 150 hemispherical analyzer and a SPECS XR50M Al Kα X-ray source (E = 1486.7 eV). All survey scans were recorded with a pass energy of 50 eV and an energy step of 0.5 eV. Detailed spectra were obtained for the Fe 2p, O 1s, N 1s, and C 1s regions using a pass energy of 10 eV and an energy step of 0.05 eV. The system is calibrated with a silver reference sample. For the measurement, the catalyst powder is pressed on an indium foil and transferred into the high-vacuum system. Spectra were analyzed using CasaXPS. Peaks were fitted using a Shirley background and a mixed Gauss/Lorentz peak.
Differential Electrochemical Mass Spectroscopy
A DEMS setup comprises an electrochemical half cell, which is connected to a MS. The custom-made cell and the rest of the setup is described in detail in a previous study.[37] In short, the investigated catalyst material is spray coated on a gas diffusion layer (see Fuel Cell Testing in Experimental Section) which serves as working electrode. The applied catalyst loading was 1.4 mg cm−2 for FeNCind-mix, 2.3 mg cm−2 for CB–FeNCporph and 2.2 mg cm−2 for the Pt/C catalyst (60 wt% Pt, Tanaka), with PTFE contents in the ink of 35 wt%. The working electrode is covered by a Nafion membrane (N117 Quintech GmbH), a 4 m H2SO4 reservoir on top connects a reference HydroFlex (GaskatelGmbH) and Pt wire as a counter electrode. N2 gas is supplied below the working electrode with a flow rate of 50 mL min−1. The MS is set to monitor the signal of m/z = 44, which refers to CO2. The used potentiostat was a Reference 600 from Gamry Instruments, and the MS Prisma was purchased from Pfeiffer Vacuum GmbH. LSV was conducted from 0.05 to 1.4 V with a scan rate of 10 mV s−1 at 23 and 60 °C, respectively.
RRDE Experiments
RRDE measurements were carried out using a MSR rotator, an OD PEEK shaft (AFE6MB, Pine Research) and a glassy carbon disk platinum ring disc electrode (AFE6R2GCPT, Pine Research) as working electrode. To avoid Pt impurities a glassy carbon rod was used as counter electrode. A standard Ag/AgCl (C3 Prozess-und Analysetechnik GmbH) was used as the reference electrode. All potentials in this work are given versus the RHE, measured with a Hydroflex (GaskatelGmbH). The used potentiostat was a Parstat3000A (AMETEK). VersaStudio software (Princeton Applied Research) was used to record the experiments.
CV and RRDE measurements were carried out in 0.1 m H2SO4 at RT. For the ink, 5 mg of catalyst is dispersed in 142 μL H2O, 83 μL isopropanol, and 25 μL Nafion solution (Quintech GmbH, PFSA 5 wt%) for 45 min (ice-cooled Emmi-H120, EMAG AG ultrasonic bath, 50 W). The catalyst loading on the working electrode was set to 0.8 mg cm−2. Ten voltammetric cycles under N2-saturated electrolyte were conducted from 1.2 to 0 V with a scan rate of 100 mV s−1 followed by two cycles with 10 mV s−1 in the same potential range. The ORR activity was investigated by performing cyclic voltammetry in the mentioned potential window with a sweep rate of 10 mV s−1 and applying different rotation rates for each cycle (O, 200, 400, 900, and 1500 rpm). Simultaneously, the ring current was traced at a constant potential of 1.2 V.
For reasons of comparison a Pt/C catalyst (PtHispec 9100, 60 wt% Pt) was measured by RDE using a standard PINR RDE GC disc (A = 0.1963 cm2) for the deposition of the Pt/C catalyst, a Pt wire as a counter electrode and a RHE Gaskatel as a reference electrode. For the ink preparation, 2 mg of the catalyst were suspended in a mixture of 3.98 mL H2O (ultrapure), 1 mL isopropanol, and 20 μL of Nafion (5%). After dispersion in an ultrasonic bath, 5.9 μL of this solution were dropcasted on the GC disc to yield a loading of 7.2 μgPt cm−2. Prior to the ORR activity measurement in oxygen saturated 0.1 m HClO4, the catalyst was cycled in N2-saturated electrolyte (50 cycles with 100 mV s−1, 5 cycles with 20 mV s−1, and 3 cycles with 5 mV s−1, all in a potential range of 0.05–1.0 V).
The activity measurement was carried out as linear sweep voltammogram measured with 5 mV s−1 from 0.05 to 1.0 V with rpm 1600 (and then capacity corrected by a related measurement in N2-saturated electrolyte).
Durability measurements were carried out in N2-saturated electrolyte. The same potential window was applied, and 10 000 cycles with a scan rate of 500 mV s−1 were conducted. Each durability cycle requires, therefore, 2.4 s and in total, the 10 000 cycles require 6.6 h. Activity and selectivity, as well as cyclic voltammetry were measured at BOT and EOT.
Preparation of the Membrane Electrode Assemblies
Anode inks were prepared by dispersing 80 mg Pt/C Elyst Pt20 0390 in 0.8 mL H2O, 0.8 mL Nafion™ (PFSA 5 wt%), and 1.6 mL isopropanol. Cathode inks were prepared by dispersing 42.5 mg of an Fe–N–C catalyst, 1 mL isopropanol, 0.5 mL Nafion (PFSA 5 wt%), and 0.13 mL H2O. For the preparation of the Pt/C membrane electrode assembly (MEA), the anode remained the same as compared with the Fe–N–C catalysts, and for the cathode 80 mg Pt/C Elyst Pt50 0380 were dispersed in 0.8 mL H2O, 0.8 mL Nafion (PFSA 5 wt%), and 1.6 mL isopropanol. Both Pt/C catalysts were provided by Umicore AG & Co. KG.
Each ink was dispersed for 1 h in an ultrasonic bath. The inks were spray coated on a gas diffusion layer (Freudenberg SE H23C9 purchased from Quintech GmbH) to form a gas diffusion electrode (GDE) and hand-cut to obtain an area of 4.84 cm2. MEA fabrication was done by hot pressing the GDEs together with a Nafion N212 membrane (Quintech GmbH). The anode loading was 0.1 mgPt cm−2. The cathode loading was 1.7 mgcatalyst cm−2; respectively, 0.24 mgPt cm−2 for the Fe–N–C catalysts and Pt/C. The aforementioned Nafion was used as an ionomer, and the Nafion-to-catalysts ratios for our catalysts and Pt/C were N/C = 0.59 and 0.5, respectively. As the Pt/C catalyst used on the cathode contains 50 wt% platinum, the N/Pt ratio is 1.
Fuel Cell Testing
A Model 840e from Scribner Associates was used to conduct the FC measurements. Measurements were conducted at 81 °C with 96% humidification and 1 bar gauge back pressure. Considering the pressure contribution from water vapor, the related absolute pressures of O2 and H2 are thus 1.5 bar. The gas flows of H2 and O2 were set to 200 sccm. As typical for FeNC catalysts, no break-in procedure was conducted, instead prior to the measurement of the polarization curve, the open-circuit voltage was recorded for 180 s. For obtaining the polarization curves, the current was increased from 0 A stepwise with a rate of 0.03 A every 10 s. The FC resistance iR-correction was carried out during the measurements with the automated tool provided from the test station. For the Pt/C reference measurement, the polarization curve is given after a break-in procedure was conducted by holding a constant potential of 600 mV for 2 h.
Acknowledgements
The main part of this work was funded by the BMBF via the NanoMatFutur young researcher group Fe-N-C-StRedO2 (03XP0092) of UIK. Additional financial support of S.P., UIK by the Graduate School of Excellence Energy Science and Engineering (GSC1070) and of S.W. by the BMBF project NUKFER (05K16RD1) is gratefully acknowledged. The authors highly appreciate the possibility of conducting XPS measurements on the DAISY-FUN system of Wolfram Jaegermann's group at TU Darmstadt. Providence of the Pt/C reference catalyst by Umicore is gratefully acknowledged.
Conflict of Interest
The authors declare no conflict of interest.


