Casein-Derived Activated Carbon: Turning Expired Milk into Active Material for Electrochemical Capacitors
Abstract
The development of high-performing materials that, at the same time, can be synthesized from cheap precursors, such as biowaste, is of critical importance for the realization of advanced and sustainable electrochemical double layer capacitors (EDLCs). Herein, reported for the first time, the use of casein extracted from expired milk for the realization of activated carbon (AC), suitable for EDLCs, is proposed. Utilizing this abundant and cheap precursor it is possible to obtain microporous AC that, in organic electrolytes (conventional and non), displays capacitance value comparable with those of commercially available ACs.
Electrochemical double layer capacitors (EDLCs) are energy storage devices that feature high power densities (10 kW kg−1) and long cycle life.1 Both of these qualities are a result of the storage mechanism of EDLCs: the fast physical adsorption of the electrolyte's ions on the electrode's surface.1 Electrolytes for EDLCs can be classified into aqueous-based, organic solvent-based, and ionic liquid-based (IL-based). Aqueous electrolytes generally feature high conductivities, low viscosities, low costs, environmental friendliness, and ease of processing. The usable operative voltage of aqueous electrolytes is limited by the electrochemical stability of water (1.23 V); however, voltage higher than 2 V has been reported in the literature by using water in salt systems.2 In comparison, organic solvent-based electrolytes and IL-based electrolytes allow higher operative voltages (up to 2.8 and 3.5 V, respectively).3 However, these electrolytes also feature lower conductivities, higher viscosities, higher costs, and require better process control to avoid contamination with moisture. In industry, organic solvent-based electrolytes are the material of choice because they offer a good compromise of usable operative voltage, decent transport properties (conductivity/viscosity), and acceptable costs.4
As active material, carbonaceous materials are the typical choice for EDLCs. Examples for these materials are activated carbons (ACs),3, 5 template carbons,6 carbide derived carbon,7 carbon nanotubes,8 and graphene.9 ACs are most commonly used because they feature high specific surface area (SSA), good conductivity, and low to moderate costs. Due to the storage mechanism of ion adsorption on the surface, a higher surface area would in theory lead to higher amount of adsorbed ion and, therefore, to a higher amount of energy stored. In praxis, however, this correlation is not strictly valid because other parameters such as the pore size and the accessibility of pores need to be considered as well. ACs can be produced from biomass, coal, polymers, petroleum coke, and biowaste with the majority being synthesized from carbon-rich organic precursors, e.g., coconut shells. Ideally, inexpensive and abundant precursor materials should be used for the production of ACs to keep the final costs of the produced AC low. Coconut shell,10 seaweed,11 oil palm kernel shell,12 sugar cane bagasse,13 agricultural waste,14 and milk powder15 have been proposed as potential precursor materials for the preparation of ACs.
Casein is a protein largely contained in milk and dairy products, historically used for the fabrication of glue. In our previous work, we have demonstrated that its binding ability can be exploited to fabricate AC-based electrodes for EDLCs.16 Here, we extend our study to its role as a precursor for the preparation of ACs. For ethical reasons, using food as a precursor for the preparation of ACs should be avoided. Therefore, we were only using milk that was way past its expiry date and that could not be sold on the market anymore. As a matter of fact, thousand tons of milk are wasted each year either as the result of too much being served or discarded for being sour or past its sell-by date.17 National and international consumer protection regulations also set limits on pathogens and traces of medicine or other chemicals in food, including milk (Regulation (EC) no 470/2009 of the European Parliament and of the Council). As a result, milk of sick dairy cows that get treated with medicine is therefore not allowed to enter the consumer market and because producers cannot sell this milk, it needs to be taken care of otherwise, which in most cases leads to thrashing of the milk. The improper disposal of milk, or other dairy products, is also an environmental concern. Indeed, the release of milk in rivers or lakes can have a drastic impact on the aquatic life due to the high biochemical oxygen demand (BOD) required to break it down. For this reason, like other animal by-products, milk is currently disposed via appropriate contractors. This already established recycling chain could be exploited to make use of milk as biowaste precursor for energy materials.
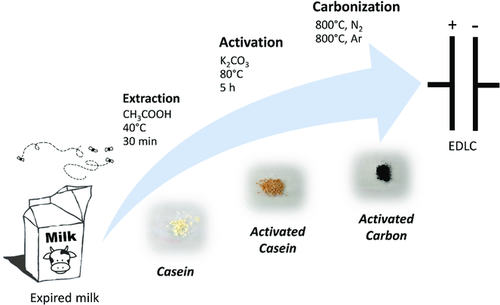
As schematically shown in Scheme 1, in a first step, the casein was separated from the expired milk via the addition of acetic acid. The resulting solid product was then chemically activated and carbonized to generate a casein-derived AC (CDAC).

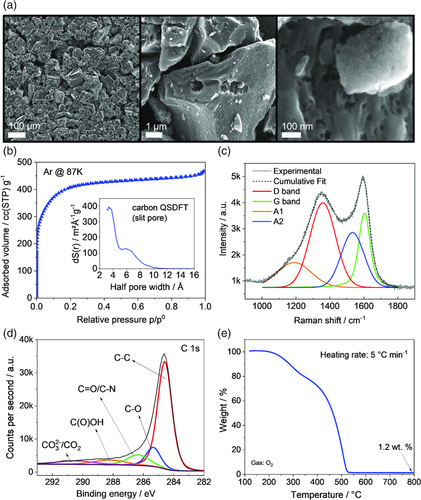
Figure 1a shows the scanning electron microscopy (SEM) images of the CDAC powder at different magnifications. As expectable from a bio-derived carbon whose precursor do not possess any particularly ordered morphology, the particles show irregular shape and size, ranging from ≈1 to 100 μm. Their surface appears rough and porous, as a result of the chemical activation step. The porosimetric analysis, done by Ar adsorption at 87 K as suggested by IUPAC (see Supporting Information), reveals a Type I isotherm characteristic of microporous materials. In fact, no adsorption/desorption hysteresis typical of mesopores can be observed (see Figure 1b). The surface area distribution (see Figure 1b inset) obtained via quenched solid density functional theory (QSDFT) analysis (results summarized in Table 1) shows that virtually the entire porosity is due to micropores (total pore volume, TPV: 0.566 cm3 g−1, Vmicro: 0.545 cm3 g−1) very similar to the widely used commercial carbon YP50 from Kuraray (Japan).18 The presence of small pores, mostly below 1 nm, results also on a relatively high SSA (DFT) of 1262 m2 g−1. The deconvolution of the Raman spectrum in Figure 1c shows the typical bands of graphitic carbon. The G band (green), centered at 1601 cm−1, is attributed to the in-plane vibration of the condensed aromatic rings present in the graphitic domains, whereas the D band (red), centered at 1341 cm−1, is related to edge defects in the graphitic domains.19 The two extra bands at around 1200 and 1500 cm−1, here labeled as A1 and A2 (orange and blue, respectively), are often observed in amorphous carbons. These can be attributed to tetrahedral and sp3 carbons and interstitial carbons, respectively.20 In general, the intensity ratio of the two main bands (ID/IG) is ≈1.1, indicating that the CDAC has prevalently a disordered structure, which is also confirmed by X-ray diffractometry (see Figure S1, Supporting Information). Interestingly though, this does not seem to be associated with a large amount of defects on the surface. In fact, the X-ray photoelectron spectroscopy (XPS) C1s spectrum shows in Figure 1d is mostly dominated by the C–C bond and only very minor peaks assignable to N- and O-containing groups can be noticed (see also survey spectrum and O1s and N1s regions in Figure S2, Supporting Information). By combining XPS and energy-dispersive x-ray spectroscopy (EDX) results (see Table 1 and Figure S3, Supporting Information), the elemental composition of the CDAC was estimated. The sample shows a lower C content (95.3 at%) on the surface (XPS) resulting from the presence of N- and O-containing functionalities (0.9 and 3.8 at%, respectively). Naturally, the C content increases in the bulk (EDX) up to 98.4 at%, with O decreasing to 1.4 at%. The remaining difference could be attributed to very small traces of mineral residues (e.g., carbonates, as suggested by the XPS O1s spectrum in Figure S2, Supporting Information). The thermogravimetric analysis (TGA) of the CDAC under O2 atmosphere shows that at around 500 °C, the carbon content was completely oxidized and only a small ash content (around 1.2% (w/w) of the sample) was left (Figure 1e). This confirms the purity of CDAC and that the washing procedure was effective in cleaning the sample after carbonization.

| Gas physisorption (Ar @ 87 K) | |||
|---|---|---|---|
| SSA (DFT) (m2 g−1) | TPV (cm3 g−1) | V micro (cm3 g−1) | V meso (cm3 g−1) |
| 1262 | 0.566 | 0.545 | 0.020 |
| Elemental analysis | |||
| Carbon (at%) | Nitrogen (at%) | Oxygen (at%) | |
| Surface (XPS) | 95.3 | 0.9 | 3.8 |
| Bulk (EDX) | 98.4 | – | 1.4 |
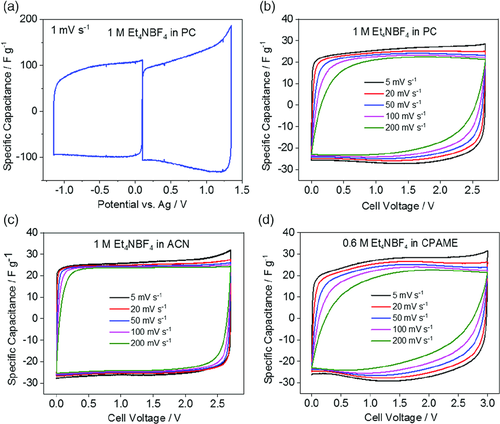
Figure 2 shows the cyclovoltammetric profiles of cells containing CDAC-based electrodes. The electrochemical response of three-electrode cells with 1 m Et4NBF4 in propylene carbonate (PC) as electrolyte is shown in Figure 2a. Both upon cathodic and anodic scan, the voltammetric waves show good charge propagation and lack of faradaic processes. Symmetric EDLCs were also assembled with 1 m Et4NBF4 in PC (Figure 2b), 1 m Et4NBF4 in acetonitrile (ACN) (Figure 2c), and 0.6 m Et4NBF4 in 3-cyanopropionic acid methyl ester (CPAME) (Figure 2d). The CV profiles have the typical quasi-rectangular shape that is expected of EDLCs; however, deviations from the ideal behavior can be observed for higher scan rates, especially for the CPAME-based electrolyte. These deviations can be attributed to the difference of transport properties (viscosity and conductivity) of the investigated electrolytes, which effect the overall resistance of the EDLC. The ACN-based electrolyte has the lowest viscosity and highest conductivity (0.6 mPa s and 55 mS cm−1, respectively),21 whereas the CPAME-based electrolyte has the highest viscosity and lowest conductivity (5.5 mPa s and 4.3 mS cm−1, respectively).22 With values of 2.6 mPa s and 13 mS cm−1, the PC-based electrolyte lies in the middle.23 The specific capacitances obtained for the different electrolytes range from 22 to 28 F g−1 depending on the applied scan rate and used electrolyte. At the lowest scan rate of 5 mV s−1, the EDLC using the CPAME-based electrolyte has the highest capacitance of 28 F g−1, whereas the EDLCs with ACN- and PC-based electrolytes both reach 26 F g−1. At the highest scan rate of 200 mV s−1, the EDLC using the ACN-based electrolyte is still able to provide 24 F g−1, whereas EDLCs using the other two electrolytes still provide 22 F g−1.

After the CV measurements, constant current measurements were conducted using current densities ranging from 0.5 to 20 A g−1 (Figure 3a). The maximum cell voltage was 2.7 V for the EDLCs containing the PC- and ACN-based electrolyte and 3.0 V for the EDLC containing the CPAME-based electrolyte. The equivalent series resistance (ESR) values of the EDLCs are 4, 10, and 16 Ω cm2 for the ACN-, PC-, and CPAME-based electrolytes, respectively, and follow the trend for the transport properties. The specific capacitance at a current density of 1 A g−1 is the highest for the PC-based systems (23 F g−1), closely followed by the ACN-based system (22 F g−1). The EDLC using the CPAME-based electrolyte has a specific capacitance of 19 F g−1 at this current density. The values of both ESR and specific capacitance are comparable with values of a commercially available AC (Norit DLC Super 30) that were previously reported by our group.22, 24

Finally, floating test was carried out to assess the long-term stability of CDAC as active material in EDLCs in combination with the different electrolytes (Figure 3b). After 500 h of floating, EDLCs using the CPAME-based electrolyte and ACN-based electrolyte are hardly delivering any capacitance anymore. While the system with the CPAME electrolyte loses its capacitance gradually over the 500 h, the ACN-based system loses the majority of its capacitance in the first 140 h. In comparison, the system using the PC-based electrolyte handles the floating test quite well: After 500 h, the specific capacitance is 19 F g−1, which corresponds to a value of 83% of the initial capacitance value (23 F g−1). In terms of ESR, the systems using the PC and CPAME electrolytes only see a relatively small increase (9% and 26%, respectively), whereas the ESR for the system using the ACN electrolyte increase by more than 500%. Compared with floating test that used commercially available carbons, the stability of EDLCs using the CDAC is lower, especially for the combinations with CPAME and ACN-based electrolytes.3, 9, 22, 25 It should be noted that the production process of CDAC was not optimized. It may be therefore possible that despite the double thermal treatment, residual surface groups on the CDAC cause side reactions during the long-term floating experiments.
Certainly, further efforts are required to improve the performance of the investigated electrodes, especially in view of their use in combination with nonconventional electrolytes. Nevertheless, the use of biowaste milk as precursor for the synthesis of AC appears to be a very promising strategy for the realization of active materials with promising properties for application in EDLCs.
Experimental Section
All experimental details can be found in the Supporting Information.
Acknowledgements
The authors acknowledge the support of the Bundesministerium für Wirtschaft und Energie (BMWi) for funding this work within the project “ULTIMATE: Ultrakondensatoren auf Basis Innovativer Materialien für eine erhöhte Energiespeicherfähigkeit” (contract number: 03ET6131). A.V. would also like to thank the Helmholtz Institute Ulm and Karlsruhe Institute of Technology for financial support.
Conflict of Interest
The authors declare no conflict of interest.


